Abstract
Background
Recent studies have revealed that super‐enhancer–associated long noncoding RNAs (SE‐LncRNAs) act pivotal roles in carcinogenesis. This study aimed to report the identification of a novel SE‐LncRNA, RP11‐569A11.1, and its functional role in colorectal cancer (CRC) progression.
Methods
Arraystar human SE‐LncRNA microarray was performed to detect differentially expressed SE‐LncRNAs in CRC tissues. RT‐qPCR was conducted to detect the expression level of RP11‐569A11.1 in CRC tissues and cells. The ROC curve was used to analyze the sensitivity and specificity of RP11‐569A11.1 in CRC diagnosis. CCK‐8 assay, colony formation assay, flow cytometry assay, and transwell assay were used to study the function of RP11‐569A11.1. RNA‐seq array was performed to analyze the potential downstream target gene of RP11‐569A11.1. Western blot assay was conducted to measure the protein level of interferon‐induced protein with tetratricopeptide repeat 2 (IFIT2).
Results
A total of 23 (15 up‐ and 8 downregulated) significantly expressed SE‐LncRNAs were identified in CRC tissues. The top 8 upregulated SE‐LncRNAs were RP11‐893F2.9, PTCSC1, RP11‐803D5.4, AC005592.2, LINC00152, LINC01232, AC017002.1, and RP4‐673M15.1, and the top 8 downregulated SE‐LncRNAs were RP11‐569A11.1, RP11‐245G13.2, RP11‐556N21.1, U91328.19, AX748340, CTD‐2337J16.1, CATG00000108830.1, and RP11‐670E13.2. Of which, RP11‐569A11.1 was found to be significantly downregulated in CRC tissues and cells. ROC curve analysis showed the area under the curve (AUC) of 0.77 [95% confidence interval (CI), 0.660–0.884, p < 0.001], and the diagnostic sensitivity and specificity were 74.29% and 71.43%, respectively. Functionally, overexpression of RP11‐569A11.1 inhibited CRC cell proliferation, migration and invasion, and induced cell apoptosis, while knockdown of RP11‐569A11.1 generated an opposite effect. Mechanistically, RP11‐569A11.1 positively regulated IFIT2 expression in CRC cells.
Conclusion
RP11‐569A11.1 inhibited CRC tumorigenesis by IFIT2‐dependent and could serve as a promising diagnostic biomarker in CRC.
Keywords: colorectal cancer, diagnostic biomarker, IFIT2, RP11‐569A11.1, super‐enhancer–associated long noncoding RNA
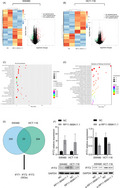
RP11‐569A11.1 positively regulated IFIT2 expression in CRC cells. A‐B, Hierarchical clustering and volcano plot revealed the altered genes with statistical significance in SW480 group and HCT‐116 group. C, The Gene ontology (GO) analysis of these altered genes from three aspects: biological process (BP), cellular component (CC) and molecular function (MF). D, The top enriched signaling pathways of these altered genes were analyzed by KEGG pathway. E, The intersection of 378 dysregulated genes in SW480 cell group with 317 dysregulated genes in HCT‐116 cell group. (F) RT‐qPCR and western blot assays were performed to detect the RNA and mRNA expression of IFIT2. * P < 0.05, and ** P < 0.01.
1. INTRODUCTION
Colorectal cancer (CRC) is one of the most malignant cancers, that ranks as the third leading cause of cancer‐related deaths worldwide. 1 In China, the morbidity of CRC has risen promptly and its mortality ranks the fifth of cancer‐related deaths. 2 , 3 Although the outcome of CRC patients has to some extent been improved owing to tremendous development of diagnostic strategies and medical instruments, most CRC patients are still diagnosed at an advanced stage, 4 , 5 and the molecular mechanism of that participated in carcinogenesis and progression of CRC is still vague. Therefore, further exploration of its tumorigenesis mechanism can help us to discover novel molecular target for CRC therapy.
Super‐enhancers (SEs) are characterized as clusters of enhancers, which are enriched in mediator binding sites and possess various chromatin markers, such as H3K4me1, H3K4me3, H3K27ac, and P300 acetyltransferase. 6 , 7 , 8 In various mammalian cells, SEs can regulate gene expression within a large genomic distance and determine cell‐type specificity. 7 , 9 More importantly, SEs are mainly distributed in mutation regions of the genome and are closely related to multiple disease lineages, especially human cancers. 10 , 11 SE‐LncRNAs are a specific type of lncRNAs that are transcribed from or interact with SEs. 12 , 13 Recent studies have shown that SE‐LncRNAs mechanically participated in extensive pathological process of human cancers by subjecting SE activation or interacting with proteins and other molecules. For example, Jiang et al. have showed that the SE‐LncRNA CCAT1 formed a complex with TP63 and SOX2 to activate the super‐enhancer of EGFR gene, thereby promoting the progression of squamous cancer. 14 Lin et al. have reported that SE‐LncRNA UCA1 activated YAP target genes by interacting directly with AMOT in epithelial ovarian cancer. 15 Squamous cell carcinoma (SCC)–specific LINC01503 derived from SE was overexpressed in SCC and promoted SCC metastasis through ERK signaling and AKT signaling. 16 Moreover, LINC01503, regulated by LncRNA GACAT3, was associated with clinicopathological characteristics in CRC patients. 17 All the above studies indicated that SE‐LncRNAs play important roles in carcinogenesis, but the function of SE‐LncRNAs involved in the progression of CRC has not been fully elucidated.
In this study, we performed Arraystar human SE‐LncRNA microarray to profile differentially expressed SE‐LncRNAs in 4 paired CRC tissues. And a novel SE‐LncRNA, RP11‐569A11.1, was found to be significantly downregulated in CRC tissues and cells. The sensitivity and specificity of RP11‐569A11.1 in CRC diagnosis were 74.29% and 71.43%, respectively. RP11‐569A11.1 functionally inhibited CRC cell proliferation and metastasis, but induced cell apoptosis. Mechanistically, RP11‐569A11.1 exerted tumor suppressor functions by regulating IFIT2. To date, there has been no report on the biological function of RP11‐569A11.1 in cancer.
2. MATERIALS AND METHODS
2.1. Patients and tissue samples
The study was approved by the Clinical Research Ethics Committee of Nanjing Medical University, and the ethical permit number was (2019)843. The research was conducted in accordance with the Declaration of Helsinki. Written informed consent was obtained from all patients. In this study, a total of 39 paired CRC tissues and matched NATs were analyzed, including 4 paired tissues for Arraystar human SE‐LncRNA microarray and 35 paired tissues for further experiments. All clinical samples were obtained from The Affiliated Cancer Hospital of Nanjing Medical University (Nanjing, China) and stored at −80°C until analysis. No patients received chemotherapy before resection, and all tissues have been certified by pathologists.
2.2. Microarray analysis
Arraystar human SE‐LncRNA microarray was performed on 4 pairs of CRC tissues and NATs to analyze differentially expressed SE‐LncRNAs. All experimental procedures were performed following Arraystar standard protocol. Briefly, RNA quantity and quality were measured by NanoDrop ND‐1000. Using the random primer method of Quick Amp labeling kit One‐Color (Agilent p/n 5190–0442), the RNA sample was amplified and transcribed into Cy3‐labeled cRNA along the full length of the transcript, without 3'bias. The labeled cRNAs were hybridized by Agilent Gene Expression Hybridization Kit (Agilent p/n 5188–5242). Use Agilent feature extraction software (v11.0.1.1) to analyze the acquired array images, and use GeneSpring GX v12.1 software package (Agilent Technologies) for further analysis and standardization. SE‐LncRNAs with statistically significant differences between the two groups were identified through p‐value/FDR and fold change.
2.3. Cell culture
Colorectal cancer cell lines HT‐29, HCT‐116, SW480, LoVo, and immortalized colon epithelial cell line FHC were purchased from the American Type Culture Collection (ATCC) and cultured in Dulbecco's modified Eagle's medium (DMEM, KeyGen) supplemented with 10% fetal bovine serum (Gibco; Invitrogen) and 1% penicillin/streptomycin (Invitrogen) in an incubator containing 5% CO2 at 37°C.
2.4. Isolation of RNA and RT‐qPCR
Total RNA was isolated using TRIzol reagent (Invitrogen). Purified RNAs were reverse‐transcribed into cDNA using PrimeScript™ RT Reagent Kit with gDNA Eraser (TaKaRa). RT‐qPCR assay was performed on QuantStudio 6 Flex real‐time PCR system using SYBR™ Select Master Mix Kit (Thermo Fisher Scientific). GAPDH was used to normalize relative gene expression levels calculated using the 2−ΔΔCt method. The primer sequences were as follows: 5′‐ CCAAGCTCCTTGAGGCTAGA‐3′ (forward) and 5′‐ ATGCAGATTAAGGGGGAGCAG‐3′ (reverse) for RP11‐569A11.1, 5′‐ AAGCACCTCAAAGGGCAAAAC −3′ (forward) and 5′‐ TCGGCCCATGTGATAGTAGAC −3′ (reverse) for IFIT2, and 5′‐ GCAAGAGCACAAGAGGAAGA −3′ (forward) and 5′‐ ACTGTGAGGAGGGGAGATTC −3′ (reverse) for GAPDH.
2.5. Subcellular fractionation and RNA isolation
The separation of nuclear and cytosolic fractions was carried out using the PARISTM kit (Invitrogen) according to the manufacturer's protocol. The RNA isolated from the nucleus and cytoplasm was subjected to subsequent reverse transcription and RT‐qPCR of RP11‐569A11.1.
2.6. Fluorescence in situ hybridization assay
Colorectal cancer cells were fixed by 4% paraformaldehyde and hybridized by RP11‐569A11.1 probe (5′‐ GTTACATCTCTAGTATAACACCGACACCAGAGATGCAGATTAAGTGCTTTTGAATTTCTGGCAGAG‐3′). Through denaturation, annealing, and renaturation processes, DAPI staining was used for nuclear staining. The result was finally observed under a fluorescence microscope. All experimental procedures were performed according to the manufacturer's protocol of FISH kit (GenePharma).
2.7. Overexpression and interference construction
The plasmid overexpression vector of RP11‐569A11.1 and negative control were constructed by GenePharma. The Smarter Silence of RP11‐569A11.1 and negative control were purchased by Ribobio. IFIT2 overexpression plasmid and small interfering RNAs (siRNA) were synthesized by GenePharma. The target sequence of RP11‐569A11.1 Smarter Silence was as follows: (1) AGACTGCTGCTGGGCTTTGC; (2) TCCTATACAGCCTCTGCCAG; (3) CCAAGCTCCTTGAGGCTAGA; (4) GCAGAGAGGGCTTTTATTT; (5) CCAGGTAGACGGTGTTATA; and (6) GGTTCTGAAGCACCATCTC. IFIT2 siRNA sequence was as follows: sense 5′‐GGAAUUCAGUAAAGAGCUUTT‐3′ and antisense 5′‐AAGCUCUUUACUGAAUUCCTT‐3′.
2.8. Cell transfection
Cells were cultured in six‐well plates, and when the cell density reached 60%‐80%, transfection was carried out with Lipofectamine 3000 (Invitrogen) according to the manufacturer's instructions.
2.9. CCK‐8 and colony formation assays
Cell proliferation capacity was evaluated by Cell Counting Kit‐8 (CCK‐8, Dojindo Laboratories). HCT‐116 and SW480 cells were seeded in 96‐well plates with initial density of 5 × 10³ cells/well. At 0 h, 24 h, 48 h, and 72 h, absorbance values at 450 nm were measured by a microplate reader. For the colony formation assay, 1 × 10³ CRC cells were added into each well of a 6‐well plate and cultured with 10% FBS for 7 days. The colonies were fixed with 4% paraformaldehyde for 30 min and then stained with 1% crystal violet for 30 min. The number of colonies was counted under a light microscope. Experiments were repeated in triplicate.
2.10. Cell migration and invasion assays
Migration chambers (Corning Inc costar®) and invasion chambers (Corning® Matrigel® invasion chamber) were used for cell migration and invasion assays. A total of 8.0 × 10⁴ CRC cells suspended in 200 μl serum‐free DMEM were seeded into the upper chamber of transwell and 600 μl DMEM containing 20% (v/v) FBS for the lower chamber. After incubated for 48 h, the non‐migrated or non‐invaded cells in the upper chamber were removed by cotton‐tipped swabs. The cells that passed through chamber were fixed by 4% paraformaldehyde and then stained with 1% crystal violet. The average number of cells was obtained by calculating six random visual fields. Each experiment was conducted in triplicate.
2.11. Cell apoptosis analyses
After 24‐h transfection, HCT‐116 and SW480 cells were digested with trypsin without EDTA to obtain single‐cell suspensions. Then, cells were subjected to Annexin V‐fluorescein isothiocyanate (FITC) and propidium iodide (PI) using Annexin V‐FITC/PI kit (BestBio). All samples were analyzed with BD FACSVerse flow cytometry (BD Biosciences). Assays were performed at least three times.
2.12. RNA sequencing array and bioinformatics analysis
RNA‐seq array was conducted to analyze gene expression profiles in RP11‐569A11.1‐overexpressed cells (SW480 and HCT‐116) and to discover potential downstream genes of RP11‐569A11.1. The whole RNA‐seq was conducted by CapitalBio Technology. Hierarchical clustering and volcano plot were used to reveal the systemic variations of differentially expressed genes (p < 0.05 and fold change >1). The Gene Ontology (GO) and Kyoto Encyclopedia of Genes and Genomes (KEGG) pathway were applied for enrichment analysis of altered genes. The results of GO and KEGG pathway with p < 0.05 were defined significantly enrichment, and the lower the p‐value, the more significantly for GO term and KEGG pathway.
2.13. Western blot
RIPA buffer (Servicebio, #G2002) with protease and phosphatase inhibitors was used to lyse cell and extract protein, and the protein concentration was determined using BCA protein array kit (Servicebio, #G2026). Total proteins were separated by SDS‐PAGE and transferred to polyvinylidene fluoride membranes. The primary antibodies were cultured to directly against target proteins: IFIT2 (#12604‐1‐AP, Proteintech) and GAPDH (#5174, CST).
2.14. Statistical analysis
All statistical analyses were performed using GraphPad Prism v7.03. Wilcoxon matched‐pairs test was used to analyze significant differences in expression between CRC tissues and their NATs. Student's t‐test was applied for the comparison between data from two groups. A value of p < 0.05 was considered statistically significant.
3. RESULTS
3.1. Differentially expressed SE‐LncRNAs in CRC tissues
To explore the role of SE‐LncRNAs in CRC, we conducted Arraystar human SE‐LncRNA microarray to profile differentially expressed SE‐LncRNAs in 4 paired CRC tissues and matched NATs. LncRNA data are carefully constructed using the most highly respected public transcriptome databases (RefSeq, UCSC Known Genes, Ensembl database, and LncRNA database), as well as landmark publications. Super‐enhancer data were arranged from dbSUPER database. The variations of SE‐LncRNA expression were revealed by scatter plot and volcano plot (Figure 1A,B). Based on the filter criteria of fold change >2 and p‐value <0.05, a total of 15 significantly upregulated and 8 significantly downregulated SE‐LncRNAs were identified (Figure 1C).
FIGURE 1.
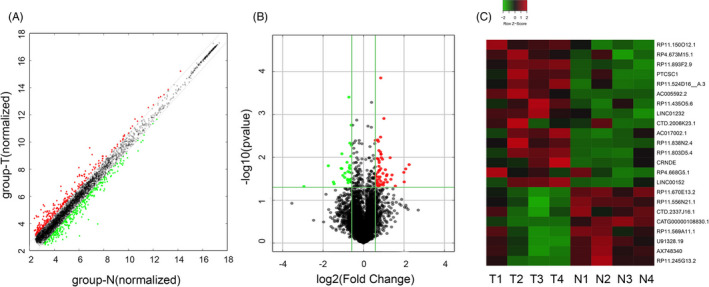
SE‐LncRNA microarray analysis of CRC tissues. A, The scatter plot displayed variation in SE‐LncRNA expression between group‐N (normal) and group‐T (CRC). B, The volcano plot represented the fold change values and P‐values of the microarray data. C, Hierarchical clustering revealed differentially expressed SE‐LncRNAs (fold change >2, p‐value <0.05). Red and green colors represented upregulated and downregulated SE‐LncRNAs, respectively
3.2. RP11‐569A11.1 is significantly downregulated in CRC tissues and cells
Among these differentially expressed SE‐LncRNAs, RP11‐569A11.1 was remarkably downregulated in CRC (fold change = −2.025, p‐value = 0.026). To confirm the result of microarray analysis, we collected 35 paired CRC tissues to detect the expression level of RP11‐569A11.1. The result of RT‐qPCR showed the level of RP11‐569A11.1 in CRC tissues was significantly lower than that in matched NATs (0.28 ± 0.36 vs 1.00 ± 1.33, p < 0.001, Figure 2A), that was consistent with the result of TCGA database (Figure 2B). Receiver operating characteristic (ROC) curve showed the area under the curve (AUC) of 0.77 [95% confidence interval (CI), 0.660–0.884, p < 0.001], and the diagnostic sensitivity and specificity were 74.29% and 71.43%, respectively (Figure 2C). Similarly, in CRC cell lines (HT‐29, LoVo, HCT‐116, and SW480), the expression of RP11‐569A11.1 was lower than that in the immortalized colon epithelial cell line FHC (Figure 2D). The cell line HCT‐116 and SW480 with lower expression of RP11‐569A11.1 were subjected to further researcher.
FIGURE 2.
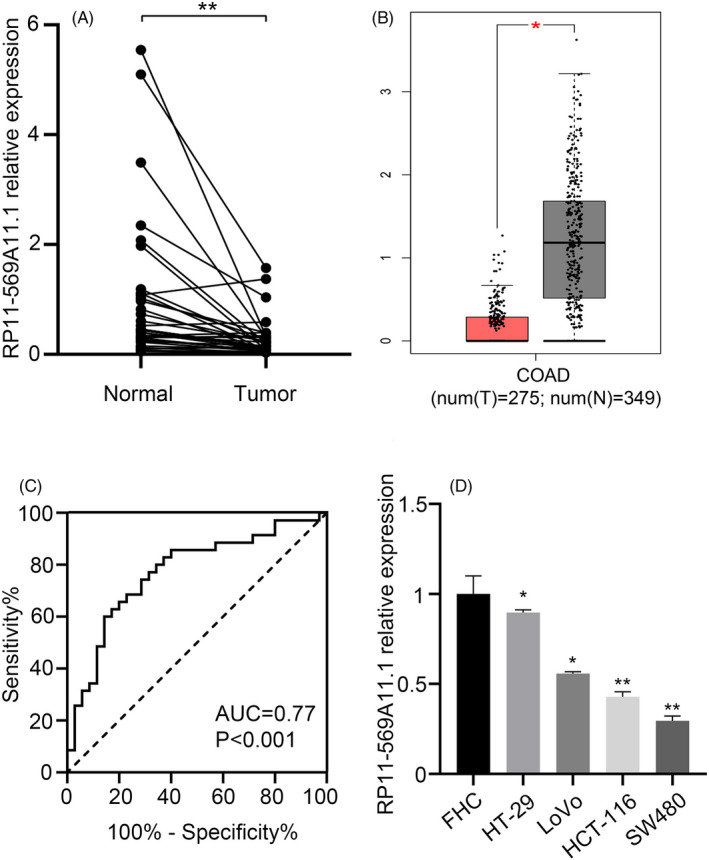
RP11‐569A11.1 was significantly downregulated in CRC tissues and cell lines. A, RP11‐569A11.1 expression was detected in 35 paired CRC tissues and matched NATs. B, TCGA data of RP11‐569A11.1 expression in CRC tissues and normal tissues. C, ROC curve was performed to analyze the sensitivity and specificity of RP11‐569A11.1 in CRC diagnosis. D, RP11‐569A11.1 expression was measured in colon epithelial cell FHC and CRC cell lines (HT‐29, LoVo, HCT‐116, and SW480). * p < 0.05 and ** p < 0.01
3.3. RP11‐569A11.1 is super‐enhancer–associated long noncoding RNA mainly located in nucleus
RP11‐569A11.1, also known as SYT2‐AS1, was located on chromosome 1q32.1 with coordinate of 202573396–202574421 and a length of 314 bp using the UCSC Genome Browser database. The GeneID and TransID were ENSG00000226862 and ENST00000428573, respectively. RP11‐569A11.1 was a SE‐LncRNA that was obtained from microarray result and dbSUPER (http://asntech.org/dbsuper/) database by analyzing H3K27ac ChIP‐seq data. CPAT (http://lilab.research.bcm.edu/cpat/) predicted that RP11‐569A11.1 had no protein coding potential with 0.00977 probability (Figure 3A). Additionally, we performed subcellular fractionation and fluorescence in situ hybridization (FISH) experiments to explore the location of RP11‐569A11 in CRC cells. The result revealed that RP11‐569A11.1 was mainly distributed in the nucleus (Figure 3B,C).
FIGURE 3.
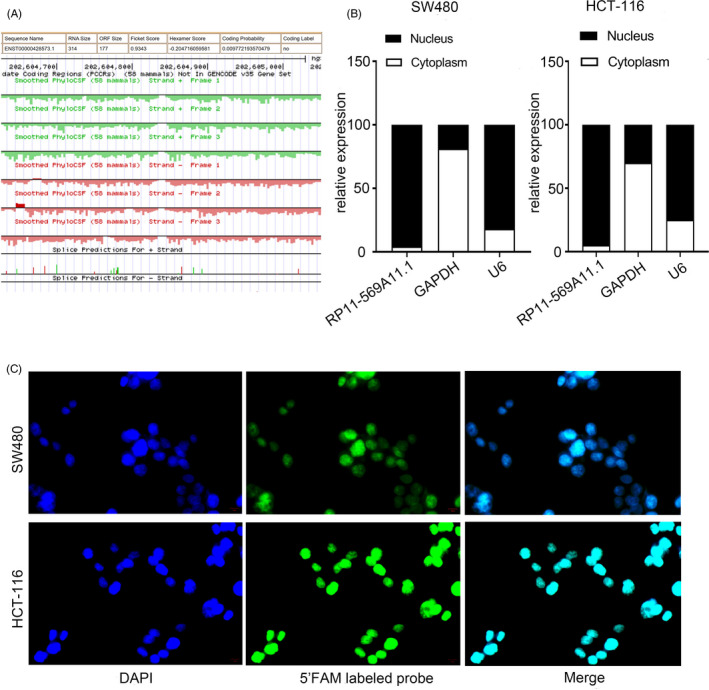
RP11‐569A11.1 was mainly distributed in nucleus. A, The probability of RP11‐569A11.1 to encode proteins. B, Subcellular fractionation assay was used to determine the nuclear and cytoplasmic expression ratio of RP11‐569A11.1 in CRC cell. C, Fluorescence in situ hybridization assay (FISH) was used to detect the subcellular localization of RP11‐569A11.1 in CRC cell. * p < 0.05 and ** p < 0.01
3.4. Overexpression of RP11‐569A11.1 inhibits cell proliferation, migration, and invasion, but induces apoptosis in CRC
The significantly lower level of RP11‐569A11.1 in CRC tissues and cells inspired us to investigate the biological function of RP11‐569A11.1 in CRC. We upregulated RP11‐569A11.1 expression using pcDNA3.1 plasmid (Figure 4A) and applied experiments of gain of function in SW480 and HCT‐116 cells, respectively. The result showed that overexpression of RP11‐569A11.1 significantly inhibited cell proliferation and colony formation in CCK‐8 assay and colony formation assay (Figure 4B,C). In flow cytometry analysis, upregulated RP11‐569A11.1 enhanced cell apoptosis rate (Figure 4D). Likewise, transwell assays demonstrated that RP11‐569A11.1 overexpression significantly inhibited cell migration and invasion abilities (Figure 4E).
FIGURE 4.
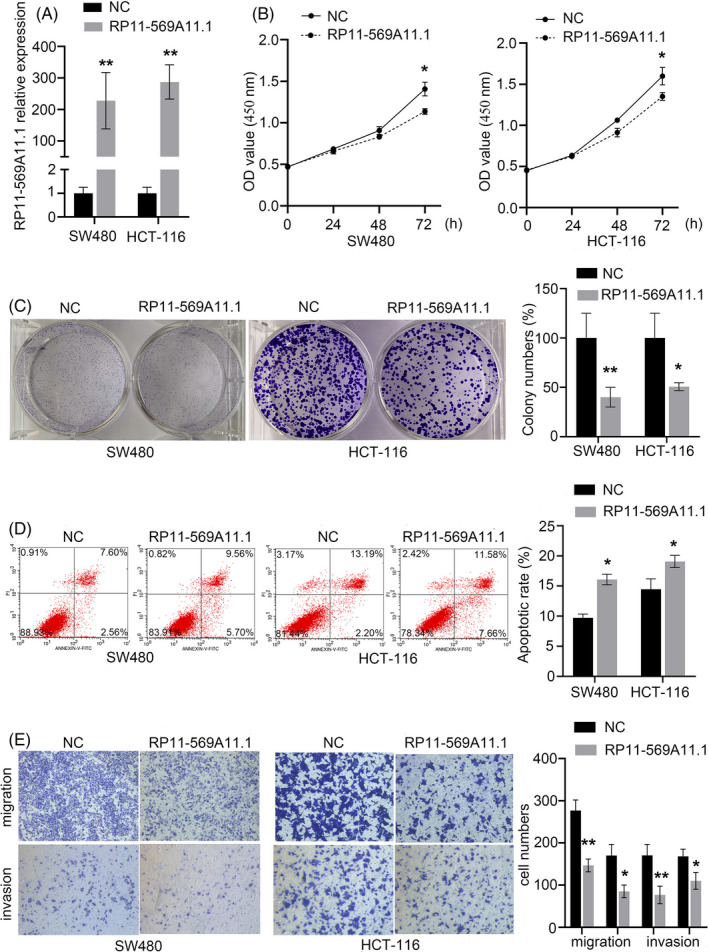
Overexpression of RP11‐569A11.1 inhibited CRC cell proliferation, migration, and invasion, but induced cell apoptosis. A, The efficiency of RP11‐569A11.1 overexpression in CRC cell was assessed by RT‐qPCR. B‐C, CCK‐8 and colony formation assays were performed to assess cell proliferation ability. D, Flow cytometry array was used to determine cell apoptosis. E, Transwell arrays were conducted to measure cell migration and invasion activities. *p < 0.05 and ** p < 0.01
3.5. Knockdown of RP11‐569A11.1 promotes cell proliferation, migration, and invasion, but suppresses apoptosis in CRC
To further verify the effect of RP11‐569A11.1 on CRC cell, we synthesized a Smart Silence to specifically inhibit RP11‐569A11.1 expression (Figure 5A) and performed the experiments of loss of function. The result showed inhibition of RP11‐569A11.1 promoted cell proliferation and colony formation (Figure 5B,C), but decreased cell apoptosis rate when compared with control groups (Figure 5D). In transwell assays, knockdown of RP11‐569A11.1 significantly increased cell migration and invasion abilities (Figure 5E). Collectively, the results in above illustrated that RP11‐569A11.1 may play a role of tumor suppressor in CRC, that was in correspondence with the clinical findings.
FIGURE 5.
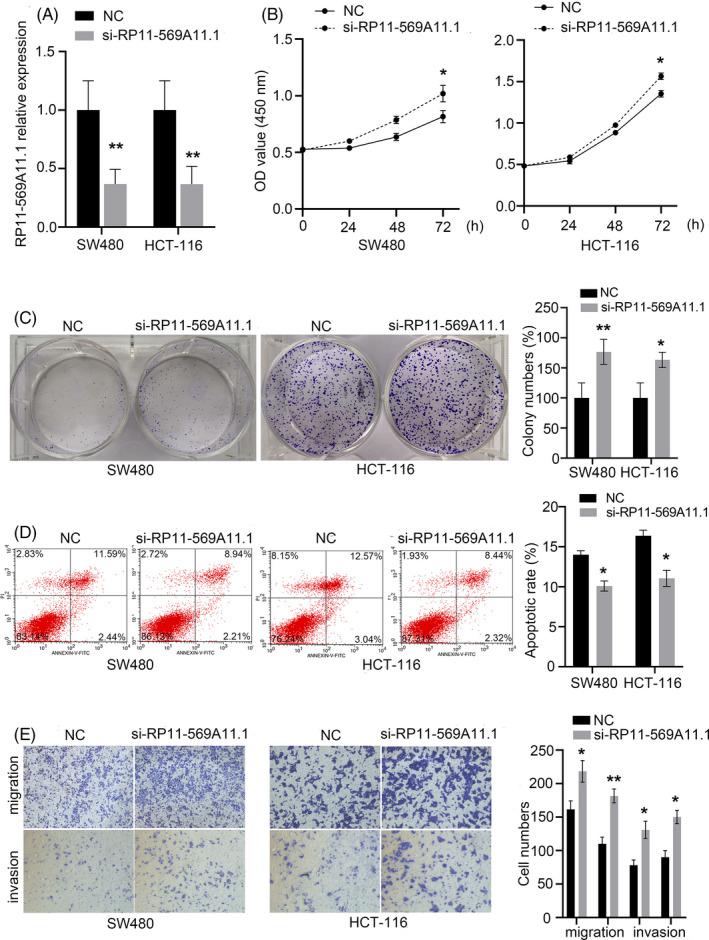
Knockdown of RP11‐569A11.1 promoted CRC cell proliferation, migration, and invasion, but suppressed cell apoptosis. A, The efficiency of RP11‐569A11.1 knockdown in CRC cell was assessed by RT‐qPCR. B‐C, Cell proliferation ability was assessed by CCK‐8 and colony formation assays. D, Cell apoptosis was determined by flow cytometry array. E, Cell migration and invasion activities were measured by transwell arrays. *p < 0.05 and ** p < 0.01
3.6. Analysis of potential downstream genes of RP11‐569A11.1
To explore the molecular mechanism of RP11‐569A11.1 in CRC, we performed RNA‐seq assay to analyze gene expression profiles in RP11‐569A11.1‐overexpressed cells (SW480 and HCT‐116). Hierarchical clustering indicated the systematic variations of genes between NC group and RP11‐569A11.1 group in SW480 and HCT‐116 cells, respectively. The volcano plot revealed 378 dysregulated genes (196 upregulated and 182 downregulated) in RP11‐569A11.1‐overexpressed SW480 cells and 317 dysregulated genes (201 upregulated and 116 downregulated) in RP11‐569A11.1‐overexpressed HCT‐116 cell, when compared with NC groups (fold change >1.5 and p‐value <0.05) (Figure 6A,B). Additionally, GO analysis was applied to analyze the enrichment of these altered genes from three aspects: biological process (BP), cellular component (CC), and molecular function (MF) (Figure 6C). Likewise, KEGG pathway analysis revealed the enrichment of dysregulated genes in top enriched signaling transduction pathways (Figure 6D). Of which, interferon signaling pathway, DNA methylation, TNF signaling pathway, and NF‐kappa B signaling pathway have been reported to be closely related to tumorigenesis, 18 , 19 , 20 , 21 which indicated that RP11‐569A11.1 had potential regulatory functions in CRC tumorigenesis and progression.
FIGURE 6.
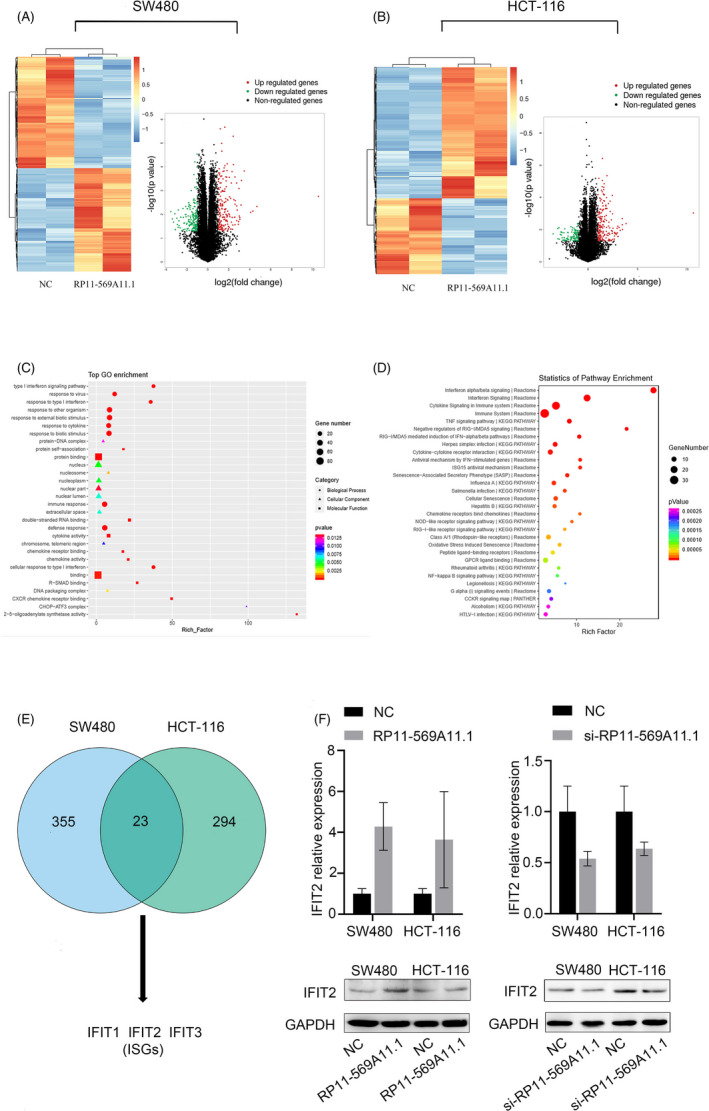
RP11‐569A11.1 positively regulated IFIT2 expression in CRC cells. A‐B, Hierarchical clustering and volcano plot revealed the altered genes with statistical significance in SW480 group and HCT‐116 group. C, The Gene Ontology (GO) analysis of these altered genes from three aspects: biological process (BP), cellular component (CC), and molecular function (MF). D, The top enriched signaling pathways of these altered genes were analyzed by KEGG pathway. E, The intersection of 378 dysregulated genes in SW480 cell group with 317 dysregulated genes in HCT‐116 cell group. F, RT‐qPCR and Western blot assays were performed to detect the RNA and mRNA expression of IFIT2. * p < 0.05 and ** p < 0.01
3.7. RP11‐569A11.1 positively regulates IFIT2 expression in CRC cell
To effectively find the downstream target gene of RP11‐569A11.1, we focused on the intersection of 378 dysregulated genes in SW480 cell group with 317 dysregulated genes in HCT‐116 cell group and found a subset of IFN‐stimulated genes (ISGs), such as IFIT1, IFIT2, and IFIT3, was significantly upregulated following RP11‐569A11.1 overexpression (Figure 6E). Of which, IFIT2 was a well‐known tumor suppressor in various types of human cancer. We hypothesized that RP11‐569A11.1 exerted its anti‐tumor effect by regulating IFIT2. To test it, we detected the expression of IFIT2 in RP11‐569A11.1 overexpression and knockdown cells by RT‐qPCR and Western blot assays. The result showed that overexpression of RP11‐569A11.1 upregulated IFIT2 expression, while knockdown of RP11‐569A11.1 downregulated IFIT2 expression (Figure 6F). Collectively, these data indicated that IFIT2 may be the downstream target of RP11‐569A11.1.
3.8. RP11‐569A11.1 exerts tumor suppressor functions in CRC via IFIT2
Rescue experiments were performed to investigate whether RP11‐569A11.1 exerts tumor suppressor functions in CRC by IFIT2. We knockdown IFIT2 by siRNA transfection in RP11‐569A11.1 overexpression cell and upregulated IFIT2 by plasmid transfection in CRC cell. As shown in Figure 7A,B, knockdown of IFIT2 significantly prompted cell proliferation and colony formation inhibited by RP11‐569A11.1 overexpression. Furthermore, IFIT2 knockdown rescued the promoting cell apoptosis effect following RP11‐569A11.1 overexpression (Figure 7C). Cell migration ability suppressed by RP11‐569A11.1 upregulation was also encouraged when IFIT2 was downregulated (Figure 7D). Collectively, these data indicated that RP11‐569A11.1 exerted tumor suppressor functions in CRC via IFIT2.
FIGURE 7.
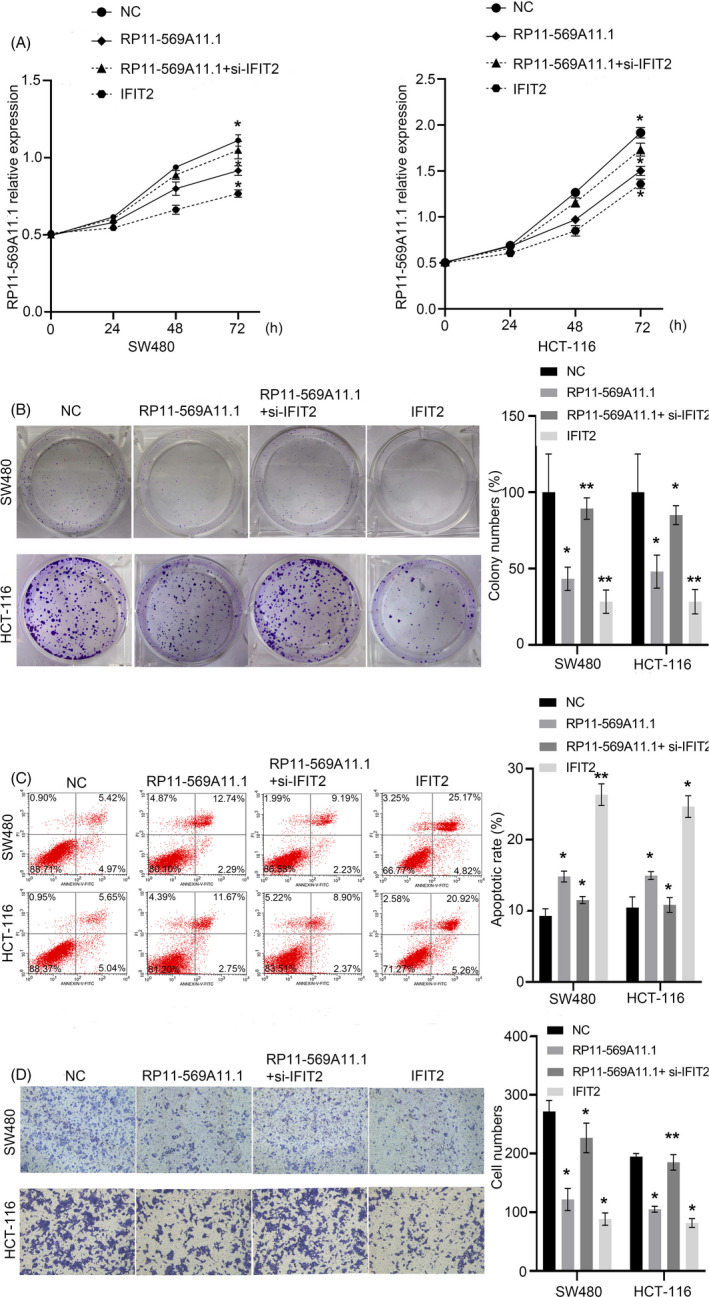
RP11‐569A11.1 exerted tumor suppressor functions by IFIT2‐dependent. A‐B, Cell proliferation abilities in CRC cell transfected with NC, RP11‐569A11.1, and IFIT2 and co‐transfected with RP11‐569A11.1 and IFIT2 siRNA were assessed by CCK‐8 and colony formation assays. C, Cell apoptotic rate was determined by flow cytometry array. D, Cell migration and invasion activities were evaluated by transwell arrays. *p < 0.05 and ** p < 0.01
4. DISCUSSION
Colorectal cancer is a highly heterogeneous disease involving various genes alterations, mainly oncogenes activation or the tumor suppressor genes inactivation. 22 , 23 For example, the gene polymorphism of LncRNA H19 was confirmed to be associated with a decreased risk of CRC in a Chinese Han population. 24 Currently, SE‐LncRNAs have started to attract widespread attention of researchers because of its crucial role in the development of cancer, including CRC, and have been considered as a promising biomarker for CRC diagnosis. In the present study, we characterized SE‐LncRNA expression profile in CRC tissues. Given that the expression abundance of SE‐LncRNA at lower levels than that of mRNA, and RNA‐seq is not sensitive to low‐abundance SE‐LncRNAs, 25 we conducted Arraystar human SE‐LncRNAs microarray to detect differentially expressed SE‐LncRNAs. Among these SE‐LncRNAs, RP11‐569A11.1 was found to be significantly downregulated in CRC tissues and cells. Meanwhile, ROC curve result showed that the diagnostic sensitivity and specificity of RP11‐569A11.1 in CRC were 74.29% and 71.43%, respectively, suggesting the potential of RP11‐569A11.1 as a diagnostic biomarker in CRC.
RP11‐569A11.1 is located on chromosome 1q32.1 and is an antisense RNA of SYT2. In vitro experiments confirmed that RP11‐569A11.1 overexpression could inhibit cell proliferation and metastasis, and induced cell apoptosis, while RP11‐569A11.1 knockdown generated an opposite effect. Thus, we suggested that RP11‐569A11.1 acted as a tumor suppressor gene in CRC carcinogenesis. Acting in cis to regulate its adjacent gene expression is one of the most important mechanisms of SE‐lncRNAs. 26 , 27 Thus, we first explore the underlying mechanisms by analyzing the genes that overlapped with RP11‐569A11.1 or within 50 KB of its transcription start site, but failed. Finally, we performed RNA‐seq assay to analyze the potential downstream genes of RP11‐569A11.1 and found a set of upregulated IFN‐stimulated genes (ISGs) in RP11‐569A11.1‐overexpressed cell. Further RT‐qPCR and Western blot analysis showed a positive regulatory relationship between RP11‐569A11.1 and IFIT2, which suggested that IFIT2 may be a functional target gene of RP11‐569A11.1.
Interferon‐induced protein with tetratricopeptide repeat 2 (IFIT2), also known as IFN‐stimulated gene 54 (ISG54), was an important member of ISGs, which formed complexes with itself or with two other related human ISGs, ISG56/IFIT1 and ISG60/IFIT3. 28 Due to its inhibitory effect on cell proliferation, migration, and invasion and promoting cell apoptosis, IFIT2 has been identified as a tumor suppressor in many types of human cancers, including CRC. For example, IFIT2 downregulation by Wnt/β‐catenin signaling promoted CRC carcinogenesis and development through suppressing cell apoptosis. 29 The poor survival of human non‐small‐cell cancer (NSCLC) patients was associated with the decreased IFIT2 expression. 30 The deficiency of IFIT2 promoted the progression of oral squamous cell carcinoma (OSCC) by activating atypical protein kinase C (aPKC) pathway and epithelial‐mesenchymal transition (EMT). 31 IFIT2 participated in various biological processes by promoting cell death and apoptosis. 32 To further explore whether RP11‐569A11.1 affected the tumorigenesis and development of CRC by IFIT2, we performed rescue experiments and found that downregulation of IFIT2 partially abolished the inhibitory effect of RP11‐569A11.1 on proliferation and metastasis of CRC cells. That suggested that RP11‐569A11.1 exerts tumor suppressor functions in CRC by regulating IFIT2, in which the underlying mechanisms might be investigated in further study. Moreover, from the intersection of SW480 cell group with HCT‐116 cell group, there were 20 dysregulated genes. Of which, EGR1, KLF10, TXNIP, and ATF3 have been confirmed to play a tumor suppressor role in CRC, which may be the potential regulated genes by RP11‐569A11.1, which might be validated by further study.
Collectively, this is the first study to systematically evaluate the role of RP11‐569A11.1 in CRC. RP11‐569A11.1 was downregulated in CRC tissues and inhibited CRC cell proliferation and metastasis by regulating IFIT2 expression. The diagnostic sensitivity and specificity of RP11‐569A11.1 were 74.29% and 71.43%, respectively. These findings suggest that RP11‐569A11.1 acted as a tumor suppressor in CRC and had potential to serve as a diagnostic biomarker in CRC.
CONFLICT OF INTEREST
The authors report no conflicts of interest in this work.
AUTHOR CONTRIBUTIONS
Huanhuan Chen: perform experiments, analyze data and draft the manuscript. Linping Yan, Xin Zhou: guide experiment operation. Junyu Zheng, Pan Jiang: collect CRC tissues and perform experiments. Feng Yan: make conception and design this study. All authors read and approved the final manuscript.
Funding information
This research was supported by the National Natural Science Foundation of China (81871718) and Innovative Team of Jiangsu Province (CXTDA2017017).
DATA AVAILABILITY STATEMENT
The data that support the findings of this study are available from the corresponding author upon reasonable request.
REFERENCES
- 1. Siegel RL, Miller KD, Jemal A. Cancer statistics, 2019. CA Cancer J Clin. 2019;69(1):7‐34. [DOI] [PubMed] [Google Scholar]
- 2. Zheng RS, Sun KX, Zhang SW, et al. Report of cancer epidemiology in China, 2015. Zhonghua Zhong Liu Za Zhi. 2019;41(1):19‐28. [DOI] [PubMed] [Google Scholar]
- 3. Zhu J, Tan Z, Hollis‐Hansen K, Zhang Y, Yu C, Li Y. Epidemiological trends in colorectal cancer in China: an ecological study. Dig Dis Sci. 2017;62(1):235‐243. [DOI] [PubMed] [Google Scholar]
- 4. Dekker E, Tanis PJ, Vleugels JLA, Kasi PM, Wallace MB. Colorectal cancer. Lancet (London, England). 2019;394(10207):1467‐1480. [DOI] [PubMed] [Google Scholar]
- 5. Siegel RL, Fedewa SA, Anderson WF, et al. Colorectal cancer incidence patterns in the United States, 1974–2013. J Natl Cancer Inst. 2017;109(8):djw322. [DOI] [PMC free article] [PubMed] [Google Scholar]
- 6. Pott S, Lieb JD. What are super‐enhancers? Nat Genet. 2015;47(1):8‐12. [DOI] [PubMed] [Google Scholar]
- 7. Khan A, Zhang X. dbSUPER: a database of super‐enhancers in mouse and human genome. Nucleic Acids Res. 2016;44(D1):D164‐D171. [DOI] [PMC free article] [PubMed] [Google Scholar]
- 8. Mousavi K, Zare H, Dell'orso S, et al. eRNAs promote transcription by establishing chromatin accessibility at defined genomic loci. Mol Cell. 2013;51(5):606‐617. [DOI] [PMC free article] [PubMed] [Google Scholar]
- 9. Ong CT, Corces VG. Enhancer function: new insights into the regulation of tissue‐specific gene expression. Nat Rev Genet. 2011;12(4):283‐293. [DOI] [PMC free article] [PubMed] [Google Scholar]
- 10. Mack SC, Pajtler KW, Chavez L, et al. Therapeutic targeting of ependymoma as informed by oncogenic enhancer profiling. Nature. 2018;553(7686):101‐105. [DOI] [PMC free article] [PubMed] [Google Scholar]
- 11. Katerndahl CDS, Heltemes‐Harris LM, Willette MJL, et al. Antagonism of B cell enhancer networks by STAT5 drives leukemia and poor patient survival. Nat Immunol. 2017;18(6):694‐704. [DOI] [PMC free article] [PubMed] [Google Scholar]
- 12. Schaukowitch K, Joo JY, Liu X, Watts JK, Martinez C, Kim TK. Enhancer RNA facilitates NELF release from immediate early genes. Mol Cell. 2014;56(1):29‐42. [DOI] [PMC free article] [PubMed] [Google Scholar]
- 13. Soibam B. Super‐lncRNAs: identification of lncRNAs that target super‐enhancers via RNA:DNA:DNA triplex formation. RNA (New York, NY). 2017;23(11):1729‐1742. [DOI] [PMC free article] [PubMed] [Google Scholar]
- 14. Jiang Y, Jiang YY, Xie JJ, et al. Co‐activation of super‐enhancer‐driven CCAT1 by TP63 and SOX2 promotes squamous cancer progression. Nat Commun. 2018;9(1):3619. [DOI] [PMC free article] [PubMed] [Google Scholar]
- 15. Lin X, Spindler TJ, de Souza Fonseca MA, et al. Super‐enhancer‐associated LncRNA UCA1 interacts directly with AMOT to activate YAP target genes in epithelial ovarian cancer. iScience. 2019;17:242‐255. [DOI] [PMC free article] [PubMed] [Google Scholar]
- 16. Xie JJ, Jiang YY, Jiang Y, et al. Super‐enhancer‐driven long non‐coding RNA LINC01503, regulated by TP63, is over‐expressed and oncogenic in squamous cell carcinoma. Gastroenterology. 2018;154(8):2137‐51.e1. [DOI] [PubMed] [Google Scholar]
- 17. Ye S, Lu Y, Ru Y, et al. LncRNAs GACAT3 and LINC00152 regulate each other through miR‐103 and are associated with clinicopathological characteristics in colorectal cancer. J Clin Lab Anal. 2020;34(9):e23378. [DOI] [PMC free article] [PubMed] [Google Scholar]
- 18. Köhler F, Rodríguez‐Paredes M. DNA methylation in epidermal differentiation, aging, and cancer. J Invest Dermatol. 2020;140(1):38‐47. [DOI] [PubMed] [Google Scholar]
- 19. Guo Y, Feng Y, Liu H, et al. Potentially functional genetic variants in the TNF/TNFR signaling pathway genes predict survival of patients with non‐small cell lung cancer in the PLCO cancer screening trial. Mol Carcinog. 2019;58(7):1094‐1104. [DOI] [PMC free article] [PubMed] [Google Scholar]
- 20. Soleimani A, Rahmani F, Ferns GA, Ryzhikov M, Avan A, Hassanian SM. Role of the NF‐κB signaling pathway in the pathogenesis of colorectal cancer. Gene. 2020;726:144132. [DOI] [PubMed] [Google Scholar]
- 21. Sakahara M, Okamoto T, Oyanagi J, et al. IFN/STAT signaling controls tumorigenesis and the drug response in colorectal cancer. Cancer Sci. 2019;110(4):1293‐1305. [DOI] [PMC free article] [PubMed] [Google Scholar]
- 22. Carethers JM, Jung BH. Genetics and genetic biomarkers in sporadic colorectal cancer. Gastroenterology. 2015;149(5):1177‐1190.e3. [DOI] [PMC free article] [PubMed] [Google Scholar]
- 23. Siegel RL, Miller KD, Fedewa SA, et al. Colorectal cancer statistics, 2017. CA Cancer J Clin. 2017;67(3):177‐193. [DOI] [PubMed] [Google Scholar]
- 24. Yu B, Chen J, Hou C, Zhang L, Jia J. LncRNA H19 gene rs2839698 polymorphism is associated with a decreased risk of colorectal cancer in a Chinese Han population: a case‐control study. J Clin Lab Anal. 2020;34(8):e23311. [DOI] [PMC free article] [PubMed] [Google Scholar]
- 25. Labaj PP, Leparc GG, Linggi BE, Markillie LM, Wiley HS, Kreil DP. Characterization and improvement of RNA‐Seq precision in quantitative transcript expression profiling. Bioinformatics (Oxford, England). 2011;27(13):i383‐i391. [DOI] [PMC free article] [PubMed] [Google Scholar]
- 26. Anderson KM, Anderson DM, McAnally JR, Shelton JM, Bassel‐Duby R, Olson EN. Transcription of the non‐coding RNA upperhand controls Hand2 expression and heart development. Nature. 2016;539(7629):433‐436. [DOI] [PMC free article] [PubMed] [Google Scholar]
- 27. Xiang JF, Yin QF, Chen T, et al. Human colorectal cancer‐specific CCAT1‐L lncRNA regulates long‐range chromatin interactions at the MYC locus. Cell Res. 2014;24(5):513‐531. [DOI] [PMC free article] [PubMed] [Google Scholar]
- 28. Reich NC. A death‐promoting role for ISG54/IFIT2. J Interferon Cytokine Res. 2013;33(4):199‐205. [DOI] [PMC free article] [PubMed] [Google Scholar]
- 29. Ohsugi T, Yamaguchi K, Zhu C, Ikenoue T, Furukawa Y. Decreased expression of interferon‐induced protein 2 (IFIT2) by Wnt/β‐catenin signaling confers anti‐apoptotic properties to colorectal cancer cells. Oncotarget. 2017;8(59):100176‐100186. [DOI] [PMC free article] [PubMed] [Google Scholar]
- 30. Su W, Xiao W, Chen L, et al. Decreased IFIT2 expression in human non‐small‐cell lung cancer tissues is associated with cancer progression and poor survival of the patients. Onco Targets Ther. 2019;12:8139‐8149. [DOI] [PMC free article] [PubMed] [Google Scholar]
- 31. Lai KC, Liu CJ, Chang KW, Lee TC. Depleting IFIT2 mediates atypical PKC signaling to enhance the migration and metastatic activity of oral squamous cell carcinoma cells. Oncogene. 2013;32(32):3686‐3697. [DOI] [PubMed] [Google Scholar]
- 32. Stawowczyk M, Van Scoy S, Kumar KP, Reich NC. The interferon stimulated gene 54 promotes apoptosis. J Biol Chem. 2011;286(9):7257‐7266. [DOI] [PMC free article] [PubMed] [Google Scholar]
Associated Data
This section collects any data citations, data availability statements, or supplementary materials included in this article.
Data Availability Statement
The data that support the findings of this study are available from the corresponding author upon reasonable request.


