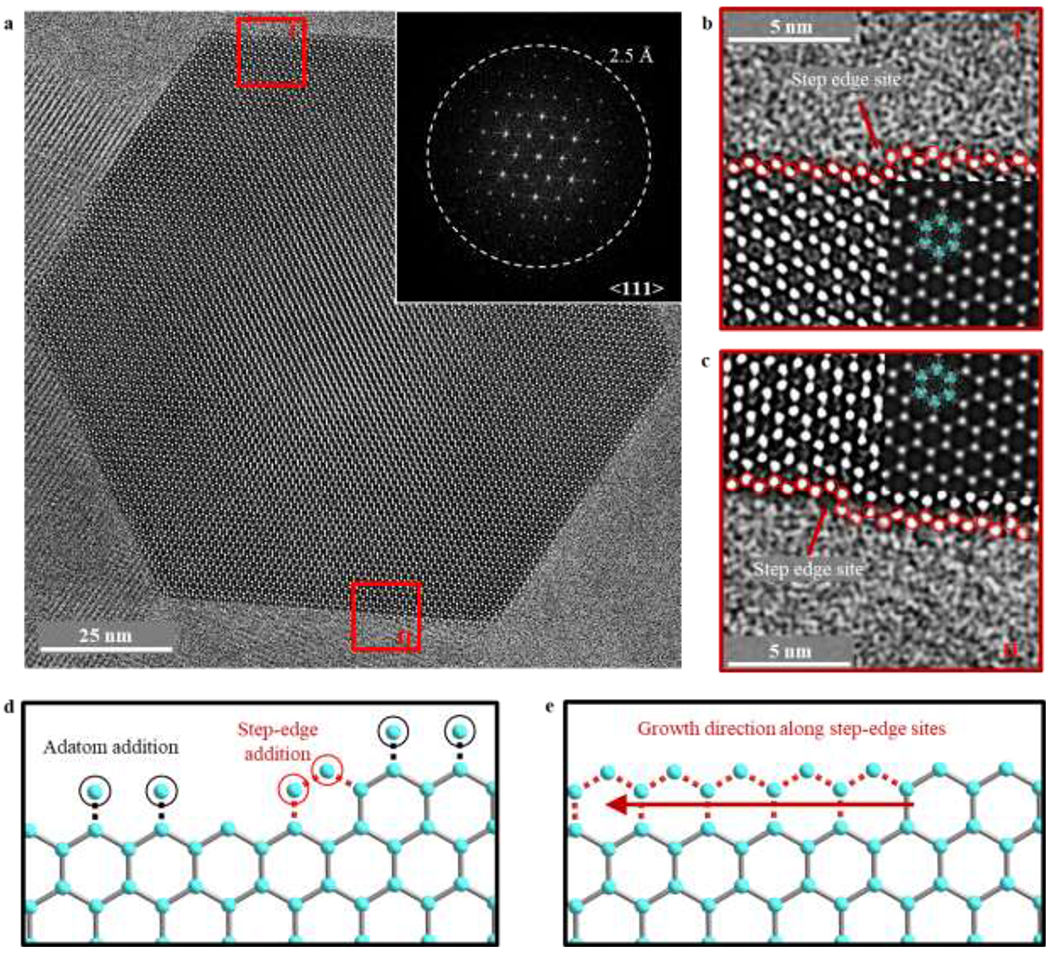
Figure 3 |. Atomic surface and step-edge sites of ZIF-8 particles.

a, Denoised cryo-EM image of ZIF-8 after synthesis (not vacuum-dried) taken at 250 nm overfocus with electron dose rate of ~4.5 e−/Å2/s for 1.5s. Bright spots correspond to Zn clusters. Inset: corresponding FFT pattern. White dashed circle represents information transfer of 2.5 Å. b, c, Magnified images of region I (b) and region II (c) boxed in red from (a). The ZIF-8 atomic structure is overlaid onto a simulated TEM image in the second inset, which is calculated using 250 nm overfocus and 100 nm sample thickness. The simulated TEM image matches well with the experimental cryo-EM image. The Zn clusters on the surface are double-coordinated and are outlined in red circles. A step-edge site is observed in both (b) and (c), indicated by the red arrow. d, Schematic of possible surface additions of Zn clusters during ZIF-8 growth. Whereas adatom addition (circled in black) would result in single-coordinated Zn clusters, addition at the step-edge site (circled in red) would result in double-coordinated Zn clusters. e, Schematic of ZIF-8 growth initiated at the step-edge site, which is thermodynamically more favorable.
