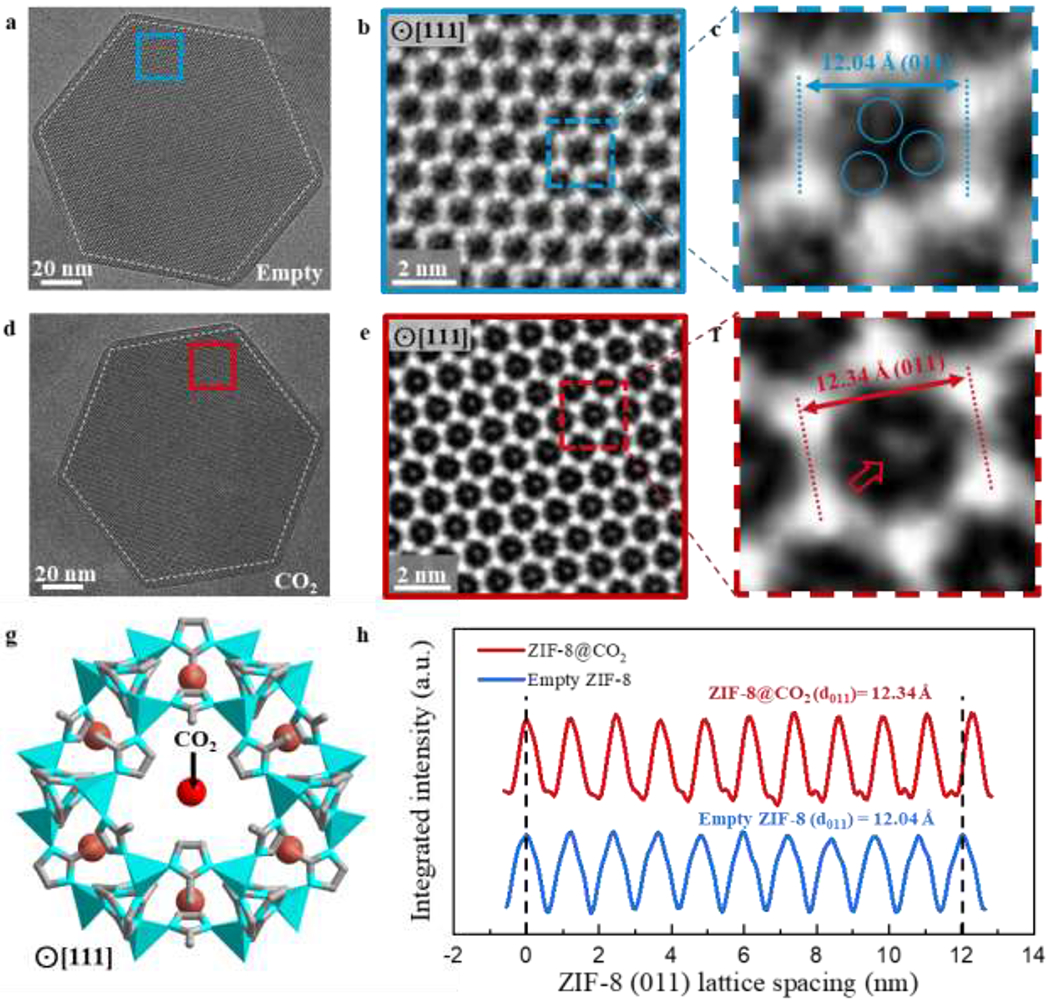
Figure 4 |. Host-guest structures within ZIF-8 viewed along <111> projection.

a, Cryo-EM image of vacuum-dried, empty ZIF-8 (outlined by white dashed lines) taken with electron dose rate of ~4.5 e−/Å2/s for 1.5s along the <111> projection. b, CTF-corrected denoised image of blue boxed region from (a). Bright regions correspond to mass density. c, Magnified image of a single ZIF-8 unit cell from (b). Density (circled in blue) near the interior edge of the unit cell may correspond to the organic imidazolate linkers. d, Cryo-EM image of CO2-filled ZIF-8 particle (outlined by white dashed lines) taken with electron dose rate of ~4.5 e−/Å2/s for 1.5s along the <111> projection. e, CTF-corrected denoised image of red boxed region from (d). Bright regions correspond to mass density. Contrast in the center of the 6-ring window is clearly observed for multiple unit cells. f, Magnified image of a single ZIF-8 unit cell from (e). Density at the center of the unit cell (indicated by red arrow) likely corresponds to CO2 adsorbed within ZIF-8. g, Simulated structure of ZIF-8 with DFT-predicted binding site of CO2 (simplified as red spheres) along the <111> projection. This is consistent with the experimental cryo-EM image from (f). h, Integrated intensity of ZIF-8 plotted over 10 unit cells along the <011> direction, indicating a 3% lattice expansion when CO2 is introduced to ZIF-8.
