

Abstract
Background
To compare head and neck cancer (HNC) patients treated with three-weekly versus weekly cisplatin-based or other chemotherapy-based concurrent chemoradiation (CRT) and CRT with versus without induction chemotherapy (ICT) to investigate differences in overall survival (OS) and cancer-specific survival (CSS).
Methods
HNC patients treated with definitive or adjuvant CRT at Roswell Park Comprehensive Cancer Center between 2003 and 2017 were retrospectively reviewed. Propensity score matching was performed to obtain three sets of balanced matched pairs: three-weekly and weekly cisplatin CRT, three weekly and non-cisplatin CRT, CRT with and without ICT. Multivariate Cox regression and Kaplan-Meier analyses were used to estimate and compare survival outcomes.
Results
A total of 623 patients received either definitive (81%) or post-operative (19%) RT. Of these, 283 patients concurrently received three-weekly cisplatin (45%); 189 patients (30%) received weekly cisplatin; 151 patients (24%) received non-cisplatin regimen. Median follow-up was 55.4 months (interquartile range, 38.0–88.7). Patients who received CRT alone and those who received ICT and CRT had no difference in 5-year OS (51.5% and 41.0% respectively, P=0.53) and CSS (64.9% and 49.7% respectively, P=0.21). Compared to patients who received three-weekly cisplatin, patients who received weekly cisplatin had no difference in 5-year OS (59.3% vs. 54.1%, P=0.35) and CSS (70.3% vs. 62.4%, P=0.09); patients who received non-cisplatin CRT also had no difference in 5-year OS (54.5% vs. 58.3%, P=0.51) and CSS (67.5% vs. 64.7%, P=0.45).
Conclusions
No significant difference in OS and CSS was observed in any of the three pairs of CRT regimens. ICT prior to CRT did not improve survival of CRT alone. Non-cisplatin and weekly cisplatin regimens did not prove to be inferior to the standard three-weekly cisplatin.
Keywords: Head and neck cancer (HNC), concurrent chemoradiation (CRT), cisplatin, induction chemotherapy (ICT), overall survival (OS)
Introduction
Concurrent chemoradiation (CRT) with high-dose cisplatin (HDC) (three cycles of 100 mg/m2 given once every 3 weeks) produces better locoregional control (LRC) and overall survival (OS) compared to radiotherapy (RT) alone in several randomized trials of head and neck cancer (HNC) (1-7). Compared to RT alone, however, CRT with HDC reports roughly 20–40% greater rate of high-grade toxicity that significantly deters up to 40% of patients from completing the aggressive treatment (3-8).
Low-dose cisplatin (LDC) (30–50 mg/m2 given once weekly) regimens show promising LRC, OS, and cancer-specific survival (CSS) with acceptable rate of severe acute toxicity (9-11). Several retrospective analyses suggest comparable efficacy and improved toxicity profile with LDC (12-15). Three randomized trials, however, report conflicting data that HDC versus LDC (16,17) and LDC versus HDC (18) is superior in the post-operative setting.
Multiple non-cisplatin based regimens have been tested but have not supplanted HDC (19-24). Induction chemotherapy (ICT), despite its efficacy compared to RT alone in larynx preservation (25,26) and reduction of distant metastases (1,4,25,26), does not improve survival compared to CRT alone (27,28).
In this study, we aimed to compare HNC patients treated with (I) ICT and CRT vs. CRT alone, (II) HDC- vs. LDC-based CRT, (III) HDC- vs. other chemotherapy-based CRT to determine whether there is a significant difference in OS and CSS.
We present the following article in accordance with the STROBE reporting checklist (available at http://dx.doi.org/10.21037/atm-20-5032).
Methods
Patient population
An institutional database of HNC patients treated with definitive or post-operative CRT between 2003 and 2017 at Roswell Park Comprehensive Cancer Center was retrospectively reviewed. Patients who received CRT were included regardless of dosing schedule and chemotherapy agent; those who received RT alone or treatment with non-curative intent were excluded. Patients who received ICT followed by CRT were included; those who received ICT alone or ICT with RT were excluded. Length of follow-up, for those still alive, was defined as length of time between date of diagnosis to last date of follow-up visit.
Statistical analysis
Multivariate (MVA) logistic regression analysis was performed using backward selection (α<0.20) of potential confounders to identify patient factors and treatment factors associated with survival. All P values were two-sided and factors with P values ≤0.05 were considered statistically significant. MVA Cox regression analysis was performed to identify factors that are associated with OS and CSS. Kaplan-Meier analysis was used to estimate survival of matched cohorts.
Propensity score matching was performed in patients with (I) CRT with and without ICT, (II) HDC-CRT and LDC-CRT, (III) HDC-CRT and non-cisplatin CRT. Survival outcomes were compared. Baseline characteristics, including age, gender, pre-RT weight, smoking status, p16 status, tumor staging, primary tumor site, and treatments received were matched to construct well-balanced pairs. Propensity score matching was performed using the nearest neighbor matching without replacement method in 1:1 ratio with a caliper width of 0.1 of the standard deviation of the logit (29). SAS (SAS Institute, Cary, NC, USA) and R (version 3.6.1, R Project for Statistical Computing, Vienna, Austria) software were used.
Ethical statement
The study was conducted in accordance with the Declaration of Helsinki (as revised in 2013). The study was approved by the institutional review board of Roswell Park Comprehensive Cancer Center (EDR-103707) and individual consent for this retrospective analysis was waived.
Results
Baseline characteristics
We analyzed a total of 623 patients, of whom 506 were males (81%) and 117 were females (19%) with a median age at time of diagnosis of 61 years [interquartile range (IQR), 50.4–66.6]. About 95% [593] of these HNC patients had squamous cell carcinoma. The most common site of primary tumor was oropharynx (42%). Median follow-up was 55.4 months (IQR, 38.0–88.7 months). All patients received either definitive (81%) or post-operative (19%) RT, median dose 70 Gy (IQR, 70–70 Gy) for all cohorts.
Standard regimen of three-weekly HDC was concomitantly used to treat 283 patients (45%); weekly LDC (30–50 mg/m2 once weekly) was given to 189 patients (30%); 151 patients (24%) received other chemotherapy regimen which included weekly cetuximab, weekly carboplatin, platinum regimen not otherwise specified, and crossover to carboplatin or cetuximab. Total or mean cumulative dose in each cohort is unknown due to incomplete information in the database. Prior to matching, median OS for HDC cohort was 40.3 months (IQR, 26.2–63.5), LDC was 42.4 months (IQR, 19.8–78.4), and other chemotherapy was 37.9 months (IQR, 13.8–69.2). Taxane-based ICT was given to 70 patients (11%). Median OS before matching for this cohort was 34.6 months (IQR, 16.5–65.3). The baseline patient and treatment characteristics before matching are summarized in Table 1.
Table 1. Baseline characteristics before matching.
| Variable | Cis q3wk | Cis q1wk | Other | P | |||||
|---|---|---|---|---|---|---|---|---|---|
| N | % | N | % | N | % | ||||
| Gender | 0.29 | ||||||||
| Male | 234 | 83 | 156 | 83 | 116 | 77 | |||
| Female | 49 | 17 | 33 | 17 | 35 | 23 | |||
| Total | 283 | 100 | 189 | 100 | 151 | 100 | |||
| Age (yrs) | <0.001 | ||||||||
| <61 | 173 | 61 | 91 | 48 | 60 | 40 | |||
| ≥61 | 110 | 39 | 98 | 52 | 91 | 60 | |||
| Total | 283 | 100 | 189 | 100 | 151 | 100 | |||
| Smoker | 0.008 | ||||||||
| Never | 71 | 25 | 37 | 20 | 26 | 17 | |||
| Former | 147 | 52 | 87 | 46 | 93 | 62 | |||
| Current | 65 | 23 | 65 | 34 | 32 | 21 | |||
| Total | 283 | 100 | 189 | 100 | 151 | 100 | |||
| HPV | 0.007 | ||||||||
| Negative | 47 | 17 | 50 | 26 | 33 | 22 | |||
| Positive | 121 | 43 | 59 | 31 | 42 | 28 | |||
| NA | 115 | 41 | 80 | 42 | 76 | 50 | |||
| Total | 283 | 100 | 189 | 100 | 151 | 100 | |||
| Comorbidity (no.) | 0.05 | ||||||||
| 0 | 63 | 22 | 42 | 22 | 17 | 11 | |||
| 1 | 87 | 31 | 51 | 27 | 41 | 27 | |||
| 2 | 69 | 24 | 48 | 25 | 44 | 29 | |||
| 3+ | 64 | 23 | 48 | 25 | 49 | 32 | |||
| Total | 283 | 100 | 189 | 100 | 151 | 100 | |||
| T stage | <0.001 | ||||||||
| X | 1 | 0 | 0 | 0 | 2 | 1 | |||
| 0-2 | 145 | 51 | 79 | 42 | 68 | 45 | |||
| 3-4 | 136 | 48 | 109 | 58 | 71 | 47 | |||
| NA | 1 | 0 | 1 | 1 | 10 | 7 | |||
| Total | 283 | 100 | 189 | 100 | 151 | 100 | |||
| N stage | <0.001 | ||||||||
| 0-1 | 78 | 28 | 61 | 32 | 67 | 44 | |||
| 2-3 | 203 | 72 | 127 | 67 | 74 | 49 | |||
| NA | 2 | 1 | 1 | 1 | 10 | 7 | |||
| Total | 283 | 100 | 189 | 100 | 151 | 100 | |||
| M stage | <0.001 | ||||||||
| 0 | 277 | 98 | 182 | 96 | 135 | 89 | |||
| 1 | 5 | 2 | 4 | 2 | 5 | 3 | |||
| NA | 1 | 0 | 3 | 2 | 11 | 7 | |||
| Total | 283 | 100 | 189 | 100 | 151 | 100 | |||
| Primary site | 0.03 | ||||||||
| NA | 23 | 8 | 27 | 14 | 26 | 17 | |||
| Oral cavity | 25 | 9 | 22 | 12 | 9 | 6 | |||
| Nasopharynx | 14 | 5 | 2 | 1 | 2 | 1 | |||
| Oropharynx | 130 | 46 | 70 | 37 | 63 | 42 | |||
| Hypopharynx | 15 | 5 | 14 | 7 | 9 | 6 | |||
| Glottis | 33 | 12 | 21 | 11 | 19 | 13 | |||
| Salivary | 5 | 2 | 3 | 2 | 2 | 1 | |||
| Other | 0 | 0 | 3 | 2 | 5 | 3 | |||
| Unknown | 22 | 8 | 15 | 8 | 9 | 6 | |||
| Multiple | 16 | 6 | 12 | 6 | 7 | 5 | |||
| Total | 283 | 100 | 189 | 100 | 151 | 100 | |||
| Histology | <0.001 | ||||||||
| Squamous | 278 | 98 | 182 | 96 | 133 | 88 | |||
| Other | 5 | 2 | 7 | 4 | 18 | 12 | |||
| Total | 283 | 100 | 189 | 100 | 151 | 100 | |||
| RT type | 0.63 | ||||||||
| Definitive | 230 | 81 | 149 | 79 | 125 | 83 | |||
| Adjuvant | 53 | 19 | 40 | 21 | 26 | 17 | |||
| Total | 283 | 100 | 189 | 100 | 151 | 100 | |||
| RT total dose (Gy) | 0.15 | ||||||||
| Median | 70 | 70 | 70 | ||||||
| IQR | 70–70 | 70–70 | 70–70 | ||||||
| RT start year | 0.01 | ||||||||
| <2011 | 72 | 25 | 50 | 26 | 58 | 38 | |||
| ≥2011 | 211 | 75 | 139 | 74 | 93 | 62 | |||
| Total | 283 | 100 | 189 | 100 | 151 | 100 | |||
| RT complete | 0.02 | ||||||||
| No | 3 | 1 | 10 | 5 | 8 | 5 | |||
| Yes | 278 | 98 | 178 | 94 | 141 | 93 | |||
| NA | 2 | 1 | 1 | 1 | 2 | 1 | |||
| Total | 283 | 100 | 189 | 100 | 151 | 100 | |||
| Treatment response | <0.001 | ||||||||
| No response | 6 | 2 | 7 | 4 | 11 | 7 | |||
| Partial | 237 | 84 | 142 | 75 | 92 | 61 | |||
| Complete | 23 | 8 | 22 | 12 | 30 | 20 | |||
| NA | 17 | 6 | 18 | 10 | 18 | 12 | |||
| Total | 283 | 100 | 189 | 100 | 151 | 100 | |||
| Surgery | 0.51 | ||||||||
| No | 225 | 80 | 147 | 78 | 125 | 83 | |||
| Yes | 58 | 20 | 42 | 22 | 26 | 17 | |||
| Total | 283 | 100 | 189 | 100 | 151 | 100 | |||
| Induction chemo | 0 | ||||||||
| No | 264 | 93 | 156 | 83 | 133 | 88 | |||
| Yes | 19 | 7 | 33 | 17 | 18 | 12 | |||
| Total | 283 | 100 | 189 | 100 | 151 | 100 | |||
| Nutrition support | 0.07 | ||||||||
| No | 122 | 43 | 62 | 33 | 55 | 36 | |||
| Yes | 161 | 57 | 127 | 67 | 96 | 64 | |||
| Total | 283 | 100 | 189 | 100 | 151 | 100 | |||
| Hospitalized | 0.97 | ||||||||
| No | 215 | 76 | 142 | 75 | 112 | 74 | |||
| Yes | 67 | 24 | 46 | 24 | 39 | 26 | |||
| NA | 1 | 0 | 1 | 1 | 0 | 0 | |||
| Total | 283 | 100 | 189 | 100 | 151 | 100 | |||
| WBC count | 0.11 | ||||||||
| Normal | 242 | 86 | 153 | 81 | 113 | 75 | |||
| Low | 5 | 2 | 5 | 3 | 5 | 3 | |||
| High | 25 | 9 | 20 | 11 | 17 | 11 | |||
| NA | 11 | 4 | 11 | 6 | 16 | 11 | |||
| Total | 283 | 100 | 189 | 100 | 151 | 100 | |||
| Hemoglobin (g/dL) | <0.001 | ||||||||
| ≥12 | 229 | 81 | 132 | 70 | 86 | 57 | |||
| <12 | 43 | 15 | 46 | 24 | 49 | 32 | |||
| NA | 11 | 4 | 11 | 6 | 16 | 11 | |||
| Total | 283 | 100 | 189 | 100 | 151 | 100 | |||
Cis, cisplatin; q3wk, once every 3 weeks; Q1wk, once every week; HPV, human papilloma virus; NA, not available; RT, radiotherapy; IQR, interquartile range; Chemo, chemotherapy; WBC, white blood cell.
Survival outcome
MVA showed no significant association between alternative chemotherapy regimen and survival. In comparison to standard HDC dosing, neither non-cisplatin nor weekly LDC was associated with any significant change in OS [hazard ratio (HR) 0.95, 95% confidence interval (CI), 0.70–1.28, P=0.72] or CSS (HR 1.14, 95% CI, 0.79–1.65, P=0.48). ICT was also not associated with any significant change in OS (HR 1.28, 95% CI, 0.89–1.82, P=0.18) or CSS (HR 1.41, 95% CI, 0.93–2.13, P=0.10). The results of MVA on survival outcome are organized in Table 2.
Table 2. Cox regression analysis of survival outcome.
| Variable | Overall survival | Cancer-specific survival | |||||||||||||
|---|---|---|---|---|---|---|---|---|---|---|---|---|---|---|---|
| UVA | MVA | UVA | MVA | ||||||||||||
| HR | 95% CI | P | HR | 95% CI | P | HR | 95% CI | P | HR | 95% CI | P | ||||
| Chemo | |||||||||||||||
| Cis q3wk | 1 | Ref | 1 | Ref | 1 | Ref | 1 | Ref | |||||||
| Cis q1wk | 1.36 | 1.03–1.79 | 0.03 | 0.97 | 0.72–1.30 | 0.82 | 1.69 | 1.21–2.36 | 0.002 | 1.17 | 0.81–1.70 | 0.4 | |||
| Others | 1.79 | 1.36–2.37 | <0.001 | 1.04 | 0.75–1.42 | 0.83 | 2.03 | 1.44–2.87 | <0.001 | 1.05 | 0.70–1.57 | 0.81 | |||
| ICT | |||||||||||||||
| No | 1 | Ref | 1 | Ref | 1 | Ref | 1 | Ref | |||||||
| Yes | 1.54 | 1.12–2.12 | 0.007 | 1.29 | 0.90–1.85 | 0.17 | 1.8 | 1.25–2.59 | 0.002 | 1.46 | 0.96–2.23 | 0.07 | |||
| Gender | |||||||||||||||
| Male | 1 | Ref | 1 | Ref | |||||||||||
| Female | 1.13 | 0.85–1.50 | 0.41 | 1.08 | 0.76–1.53 | 0.66 | |||||||||
| Age (yrs) | |||||||||||||||
| <61 | 1 | Ref | 1 | Ref | 1 | Ref | 1 | Ref | |||||||
| ≥61 | 1.57 | 1.24–1.97 | <0.001 | 1.56 | 1.22–1.99 | <0.001 | 1.57 | 1.19–2.08 | 0.001 | 1.68 | 1.25–2.26 | <0.001 | |||
| Smoker | |||||||||||||||
| Never | 1 | Ref | 1 | Ref | 1 | Ref | 1 | Ref | |||||||
| Former | 1.92 | 1.36–2.72 | <0.001 | 1.51 | 1.04–2.18 | 0.03 | 1.91 | 1.25–2.91 | 0.003 | 1.31 | 0.84–2.06 | 0.23 | |||
| Current | 2.53 | 1.75–3.67 | <0.001 | 2.23 | 1.51–3.30 | <0.001 | 2.49 | 1.59–3.90 | <0.001 | 1.98 | 1.23–3.17 | 0.005 | |||
| HPV | |||||||||||||||
| Negative | 1 | Ref | 1 | Ref | 1 | Ref | 1 | Ref | |||||||
| Positive | 0.51 | 0.37–0.71 | <0.001 | 0.92 | 0.65–1.30 | 0.63 | 0.58 | 0.39–0.86 | 0.006 | 1.2 | 0.79–1.82 | 0.39 | |||
| NA | |||||||||||||||
| Comorbidity (no.) | |||||||||||||||
| 0 | 1 | Ref | 1 | Ref | |||||||||||
| 1 | 0.8 | 0.56–1.13 | 0.21 | 0.74 | 0.49–1.12 | 0.15 | |||||||||
| 2 | 1.1 | 0.78–1.55 | 0.59 | 0.94 | 0.63–1.41 | 0.78 | |||||||||
| 3+ | 1.23 | 0.88–1.73 | 0.23 | 0.99 | 0.66–1.48 | 0.97 | |||||||||
| T stage | |||||||||||||||
| X | 2.43 | 0.34–17.43 | 0.38 | 3.75 | 0.52–27.16 | 0.19 | |||||||||
| 0–2 | 1 | Ref | 1 | Ref | 1 | Ref | 1 | Ref | |||||||
| 3–4 | 2.32 | 1.81–2.97 | <0.001 | 1.87 | 1.44–2.41 | <0.001 | 2.95 | 2.15–4.05 | <0.001 | 2.33 | 1.69–3.21 | <0.001 | |||
| N stage | |||||||||||||||
| 0–1 | 1 | Ref | 1 | Ref | |||||||||||
| 2–3 | 0.95 | 0.74–1.22 | 0.69 | 1.14 | 0.84–1.55 | 0.41 | |||||||||
| NA | |||||||||||||||
| M stage | |||||||||||||||
| 0 | 1 | Ref | 1 | Ref | 1 | Ref | 1 | Ref | |||||||
| 1 | 3.89 | 2.17–6.95 | <0.001 | 1.02 | 0.49–2.14 | 0.96 | 3.87 | 1.98–7.59 | <0.001 | 0.77 | 0.35–1.70 | 0.52 | |||
| NA | |||||||||||||||
| Histology | |||||||||||||||
| Squamous | 1 | Ref | 1 | Ref | 1 | Ref | 1 | Ref | |||||||
| Other | 2 | 1.31–3.06 | 0.001 | 0.87 | 0.46–1.63 | 0.66 | 2.3 | 1.42–3.74 | <0.001 | 0.98 | 0.43–2.21 | 0.96 | |||
| Primary site | |||||||||||||||
| NA | 1 | Ref | 1 | Ref | 1 | Ref | 1 | Ref | |||||||
| OC | 0.84 | 0.54–1.31 | 0.44 | 0.93 | 0.56–1.54 | 0.77 | |||||||||
| NP | 0.68 | 0.32–1.44 | 0.32 | 0.77 | 0.34–1.73 | 0.53 | |||||||||
| OP | 0.43 | 0.30–0.61 | <0.001 | 1.13 | 0.73–1.73 | 0.59 | 0.39 | 0.26–0.59 | <0.001 | 1.08 | 0.63–1.83 | 0.78 | |||
| HP | 0.95 | 0.59–1.54 | 0.84 | 0.89 | 0.50–1.58 | 0.68 | |||||||||
| Glottis | 0.8 | 0.52–1.22 | 0.3 | 0.68 | 0.41–1.15 | 0.15 | |||||||||
| Salivary | 0.78 | 0.35–1.73 | 0.54 | 0.96 | 0.40–2.27 | 0.92 | |||||||||
| Other | 0.33 | 0.08–1.34 | 0.12 | 0.46 | 0.11–1.91 | 0.29 | |||||||||
| Unknown | 0.39 | 0.22–0.69 | 0.001 | 1.07 | 0.54–2.12 | 0.84 | 0.29 | 0.13–0.61 | 0.001 | 0.86 | 0.35–2.12 | 0.75 | |||
| Multiple | 1.15 | 0.70–1.87 | 0.59 | 0.93 | 0.51–1.70 | 0.81 | |||||||||
| RT total dose (Gy) | |||||||||||||||
| <70 | 1 | Ref | 1 | Ref | 1 | Ref | 1 | Ref | |||||||
| ≥70 | 0.66 | 0.50–0.86 | 0.002 | 0.82 | 0.60–1.11 | 0.2 | 0.57 | 0.42–0.78 | <0.001 | 0.72 | 0.51–1.03 | 0.07 | |||
| RT start year | |||||||||||||||
| <2011 | 1 | Ref | 1 | Ref | |||||||||||
| ≥2011 | 0.91 | 0.71–1.17 | 0.49 | 0.97 | 0.72–1.31 | 0.84 | |||||||||
| RT complete | |||||||||||||||
| No | 1 | Ref | 1 | Ref | 1 | Ref | 1 | Ref | |||||||
| Yes | 0.16 | 0.10–0.25 | <0.001 | 0.53 | 0.33–0.86 | 0.01 | 0.12 | 0.08–0.20 | <0.001 | 0.44 | 0.27–0.71 | 0.001 | |||
| Response | |||||||||||||||
| None | 1 | Ref | 1 | Ref | 1 | Ref | 1 | Ref | |||||||
| Partial | 0.08 | 0.05–0.12 | <0.001 | 0.08 | 0.05–0.13 | <0.001 | 0.05 | 0.03–0.08 | <0.001 | 0.05 | 0.03–0.08 | <0.001 | |||
| Complete | 0.5 | 0.31–0.81 | 0.005 | 0.45 | 0.27–0.75 | 0.002 | 0.46 | 0.28–0.76 | 0.002 | 0.46 | 0.28–0.77 | 0.003 | |||
| Surgery | |||||||||||||||
| No | 1 | Ref | 1 | Ref | |||||||||||
| Yes | 0.86 | 0.64–1.16 | 0.34 | 0.92 | 0.65–1.31 | 0.66 | |||||||||
| Nutrition support | |||||||||||||||
| No | 1 | Ref | 1 | Ref | 1 | Ref | |||||||||
| Yes | 1.29 | 1.01–1.65 | 0.04 | 0.95 | 0.72–1.26 | 0.74 | 1.29 | 0.96–1.74 | 0.09 | ||||||
| Hospitalized | |||||||||||||||
| No | 1 | Ref | 1 | Ref | 1 | Ref | 1 | Ref | |||||||
| Yes | 1.65 | 1.28–2.12 | <0.001 | 1.52 | 1.17–1.98 | 0.002 | 1.49 | 1.09–2.02 | 0.01 | 1.31 | 0.95–1.81 | 0.1 | |||
| WBC count | |||||||||||||||
| Normal | 1 | Ref | 1 | Ref | 1 | Ref | 1 | Ref | |||||||
| Low | 2.55 | 1.39–4.68 | 0.002 | 1.61 | 0.85–3.08 | 0.15 | 2.94 | 1.50–5.76 | 0.002 | 1.84 | 0.89–3.80 | 0.1 | |||
| High | 2.04 | 1.47–2.82 | <0.001 | 1.27 | 0.89–1.80 | 0.18 | 2.35 | 1.62–3.41 | <0.001 | 1.36 | 0.90–2.06 | 0.14 | |||
| Hemoglobin (g/dL) | |||||||||||||||
| ≥12 | 1 | Ref | 1 | Ref | 1 | Ref | 1 | Ref | |||||||
| <12 | 2.38 | 1.86–3.06 | <0.001 | 1.36 | 1.05–1.77 | 0.02 | 2.5 | 1.86–3.36 | <0.001 | 1.05 | 0.75–1.47 | 0.78 | |||
Chemoradiation with and without ICT
A total of 51 pairs were matched, with all variables well balanced (Table 3). Median overall follow-up was 71.7 months (IQR, 43.4–98.4). Median OS was 35.3 months (IQR, 14.3–74.2) and 36.0 months (IQR, 17.7–60.0) for non-ICT and ICT cohorts, respectively (P=0.53). OS at 5 years was 51.5% (95% CI, 39.1–67.7%) for patients who did not receive ICT and 41.0% (95% CI, 28.8–58.5%) for patients who received ICT (P=0.53, Figure 1). CSS at 5 years was 64.9% (95% CI, 52.2–80.7%) for non-ICT cohort and 49.7% (95% CI, 36.2–68.3%) for ICT cohort (P=0.21, Figure 2).
Table 3. Baseline characteristics after matching.
| Variable | Cis q3wk | Cis q1wk | P | Cis q3wk | Other | P | No ICT | ICT | P | |||||||||
|---|---|---|---|---|---|---|---|---|---|---|---|---|---|---|---|---|---|---|
| N | % | N | % | N | % | N | % | N | % | N | % | |||||||
| Gender | 0.89 | 0.86 | 0.36 | |||||||||||||||
| Male | 153 | 84 | 151 | 83 | 74 | 79 | 76 | 81 | 47 | 92 | 43 | 84 | ||||||
| Female | 30 | 16 | 32 | 17 | 20 | 21 | 18 | 19 | 4 | 8 | 8 | 16 | ||||||
| Total | 183 | 100 | 183 | 100 | 94 | 100 | 94 | 100 | 51 | 100 | 51 | 100 | ||||||
| Age (yrs) | 0.30 | 0.88 | 1 | |||||||||||||||
| <61 | 101 | 55 | 90 | 49 | 46 | 49 | 44 | 47 | 33 | 65 | 33 | 65 | ||||||
| ≥61 | 82 | 45 | 93 | 51 | 48 | 51 | 50 | 53 | 18 | 35 | 18 | 35 | ||||||
| Total | 183 | 100 | 183 | 100 | 94 | 100 | 94 | 100 | 51 | 100 | 51 | 100 | ||||||
| Smoker | 0.40 | 0.45 | 0.42 | |||||||||||||||
| Never | 45 | 25 | 35 | 19 | 16 | 17 | 14 | 15 | 14 | 27 | 8 | 16 | ||||||
| Former | 83 | 45 | 85 | 46 | 63 | 67 | 58 | 62 | 17 | 33 | 20 | 39 | ||||||
| Current | 55 | 30 | 63 | 34 | 15 | 16 | 22 | 23 | 20 | 39 | 23 | 45 | ||||||
| Total | 183 | 100 | 183 | 100 | 94 | 100 | 94 | 100 | 51 | 100 | 51 | 100 | ||||||
| HPV | 0.20 | 0.93 | 0.82 | |||||||||||||||
| Negative | 37 | 20 | 49 | 27 | 18 | 19 | 20 | 21 | 12 | 24 | 15 | 29 | ||||||
| Positive | 73 | 40 | 59 | 32 | 30 | 32 | 31 | 33 | 18 | 35 | 17 | 33 | ||||||
| NA | 73 | 40 | 75 | 41 | 46 | 49 | 43 | 46 | 21 | 41 | 19 | 37 | ||||||
| Total | 183 | 100 | 183 | 100 | 94 | 100 | 94 | 100 | 51 | 100 | 51 | 100 | ||||||
| Comorbidity (no.) | 0.82 | 0.89 | 1 | |||||||||||||||
| 0 | 41 | 22 | 41 | 22 | 11 | 12 | 10 | 11 | 12 | 24 | 13 | 25 | ||||||
| 1 | 57 | 31 | 49 | 27 | 27 | 29 | 26 | 28 | 17 | 33 | 16 | 31 | ||||||
| 2 | 43 | 23 | 47 | 26 | 30 | 32 | 27 | 29 | 11 | 22 | 10 | 20 | ||||||
| 3+ | 42 | 23 | 46 | 25 | 26 | 28 | 31 | 33 | 11 | 22 | 12 | 24 | ||||||
| Total | 183 | 100 | 183 | 100 | 94 | 100 | 94 | 100 | 51 | 100 | 51 | 100 | ||||||
| T stage | 0.46 | 0.61 | 1 | |||||||||||||||
| X | 0 | 0 | 0 | 0 | 0 | 0 | 1 | 1 | 0 | 0 | 0 | 0 | ||||||
| 0–2 | 89 | 49 | 77 | 42 | 46 | 49 | 50 | 53 | 17 | 33 | 17 | 33 | ||||||
| 3–4 | 93 | 51 | 105 | 57 | 47 | 50 | 43 | 46 | 32 | 63 | 33 | 65 | ||||||
| NA | 1 | 1 | 1 | 1 | 1 | 1 | 0 | 0 | 2 | 4 | 1 | 2 | ||||||
| Total | 183 | 100 | 183 | 100 | 94 | 100 | 94 | 100 | 51 | 100 | 51 | 100 | ||||||
| N stage | 0.71 | 0.66 | 1 | |||||||||||||||
| 0–1 | 50 | 27 | 58 | 32 | 42 | 45 | 39 | 41 | 10 | 20 | 11 | 22 | ||||||
| 2–3 | 132 | 72 | 124 | 68 | 51 | 54 | 55 | 59 | 39 | 76 | 39 | 76 | ||||||
| NA | 1 | 1 | 1 | 1 | 1 | 1 | 0 | 0 | 2 | 4 | 1 | 2 | ||||||
| Total | 183 | 100 | 183 | 100 | 94 | 100 | 94 | 100 | 51 | 100 | 51 | 100 | ||||||
| M stage | 1 | 1 | 1 | |||||||||||||||
| 0 | 178 | 97 | 178 | 97 | 91 | 97 | 91 | 97 | 47 | 92 | 48 | 94 | ||||||
| 1 | 4 | 2 | 4 | 2 | 2 | 2 | 3 | 3 | 2 | 4 | 2 | 4 | ||||||
| NA | 1 | 1 | 1 | 1 | 1 | 1 | 0 | 0 | 2 | 4 | 1 | 2 | ||||||
| Total | 183 | 100 | 183 | 100 | 94 | 100 | 94 | 100 | 51 | 100 | 51 | 100 | ||||||
| Primary site | 0.97 | 0.99 | 1 | |||||||||||||||
| NA | 18 | 10 | 26 | 14 | 11 | 12 | 9 | 10 | 6 | 12 | 7 | 14 | ||||||
| Oral cavity | 22 | 12 | 21 | 11 | 9 | 10 | 7 | 7 | 2 | 4 | 2 | 4 | ||||||
| Nasopharynx | 2 | 1 | 2 | 1 | 3 | 3 | 2 | 2 | 1 | 2 | 2 | 4 | ||||||
| Oropharynx | 77 | 42 | 70 | 38 | 47 | 50 | 46 | 49 | 24 | 47 | 19 | 37 | ||||||
| Hypopharynx | 12 | 7 | 14 | 8 | 4 | 4 | 4 | 4 | 5 | 10 | 7 | 14 | ||||||
| Glottis | 20 | 11 | 20 | 11 | 11 | 12 | 13 | 14 | 2 | 4 | 3 | 6 | ||||||
| Salivary | 2 | 1 | 3 | 2 | 1 | 1 | 2 | 2 | 1 | 2 | 1 | 2 | ||||||
| Other | 0 | 0 | 0 | 0 | 0 | 0 | 0 | 0 | 1 | 2 | 1 | 2 | ||||||
| Unknown | 17 | 9 | 15 | 8 | 5 | 5 | 7 | 7 | 4 | 8 | 4 | 8 | ||||||
| Multiple | 13 | 7 | 12 | 7 | 3 | 3 | 4 | 4 | 5 | 10 | 5 | 10 | ||||||
| Total | 183 | 100 | 183 | 100 | 94 | 100 | 94 | 100 | 51 | 100 | 51 | 100 | ||||||
| Histology | 1 | 1 | 1 | |||||||||||||||
| Squamous | 178 | 97 | 177 | 97 | 90 | 96 | 91 | 97 | 49 | 96 | 50 | 98 | ||||||
| Other | 5 | 3 | 6 | 3 | 4 | 4 | 3 | 3 | 2 | 4 | 1 | 2 | ||||||
| Total | 183 | 100 | 183 | 100 | 94 | 100 | 94 | 100 | 51 | 100 | 51 | 100 | ||||||
| RT type | 0.90 | 1 | NA | |||||||||||||||
| Definitive | 147 | 80 | 145 | 79 | 79 | 84 | 79 | 84 | 51 | 100 | 51 | 100 | ||||||
| Adjuvant | 36 | 20 | 38 | 21 | 15 | 16 | 15 | 16 | 0 | 0 | 0 | 0 | ||||||
| Total | 183 | 100 | 183 | 100 | 94 | 100 | 94 | 100 | 51 | 100 | 51 | 100 | ||||||
| RT total dose (Gy) | 0.53 | 0.83 | 0.69 | |||||||||||||||
| Median | 70 | 70 | 70 | 70 | 70 | 70 | ||||||||||||
| IQR | 70–70 | 70–70 | 70–70 | 70–70 | 70–70 | 70–70 | ||||||||||||
| RT start year | 1 | 0.88 | 0.84 | |||||||||||||||
| <2011 | 48 | 26 | 47 | 26 | 29 | 31 | 31 | 33 | 25 | 49 | 23 | 45 | ||||||
| ≥2011 | 135 | 74 | 136 | 74 | 65 | 69 | 63 | 67 | 26 | 51 | 28 | 55 | ||||||
| Total | 183 | 100 | 183 | 100 | 94 | 100 | 94 | 100 | 51 | 100 | 51 | 100 | ||||||
| RT complete | 0.08 | 0.62 | 1 | |||||||||||||||
| No | 2 | 1 | 9 | 5 | 2 | 2 | 1 | 1 | 2 | 4 | 2 | 4 | ||||||
| Yes | 179 | 98 | 173 | 95 | 91 | 97 | 93 | 99 | 49 | 96 | 49 | 96 | ||||||
| NA | 2 | 1 | 1 | 1 | 1 | 1 | 0 | 0 | 0 | 0 | 0 | 0 | ||||||
| Total | 183 | 100 | 183 | 100 | 94 | 100 | 94 | 100 | 51 | 100 | 51 | 100 | ||||||
| Treatment response | 0.65 | 0.86 | 0.97 | |||||||||||||||
| No response | 5 | 3 | 6 | 3 | 6 | 6 | 4 | 4 | 4 | 8 | 3 | 6 | ||||||
| Partial | 148 | 81 | 138 | 75 | 69 | 73 | 69 | 73 | 35 | 69 | 37 | 73 | ||||||
| Complete | 17 | 9 | 21 | 11 | 9 | 10 | 12 | 13 | 8 | 16 | 8 | 16 | ||||||
| NA | 13 | 7 | 18 | 10 | 10 | 11 | 9 | 10 | 4 | 8 | 3 | 6 | ||||||
| Total | 183 | 100 | 183 | 100 | 94 | 100 | 94 | 100 | 51 | 100 | 51 | 100 | ||||||
| Surgery | 1 | 0.71 | 1 | |||||||||||||||
| No | 142 | 78 | 142 | 78 | 75 | 80 | 78 | 83 | 50 | 98 | 51 | 100 | ||||||
| Yes | 41 | 22 | 41 | 22 | 19 | 20 | 16 | 17 | 1 | 2 | 0 | 0 | ||||||
| Total | 183 | 100 | 183 | 100 | 94 | 100 | 94 | 100 | 51 | 100 | 51 | 100 | ||||||
| ICT | 0.16 | 1 | NA | |||||||||||||||
| No | 164 | 90 | 154 | 84 | 85 | 90 | 84 | 89 | 51 | 100 | 0 | 0 | ||||||
| Yes | 19 | 10 | 29 | 16 | 9 | 10 | 10 | 11 | 0 | 0 | 51 | 100 | ||||||
| Total | 183 | 100 | 183 | 100 | 94 | 100 | 94 | 100 | 51 | 100 | 51 | 100 | ||||||
| Chemotherapy | NA | NA | 1 | |||||||||||||||
| Cis q3wk | 183 | 100 | 0 | 0 | 94 | 100 | 0 | 0 | 18 | 35 | 18 | 35 | ||||||
| Cis q1wk | 0 | 0 | 183 | 100 | 0 | 0 | 0 | 0 | 22 | 43 | 22 | 43 | ||||||
| Other | 0 | 0 | 0 | 0 | 0 | 0 | 94 | 100 | 11 | 22 | 11 | 22 | ||||||
| Total | 183 | 100 | 183 | 100 | 94 | 100 | 94 | 100 | 51 | 100 | 51 | 100 | ||||||
| Nut support | 0.38 | 0.46 | 1 | |||||||||||||||
| No | 68 | 37 | 59 | 32 | 40 | 43 | 34 | 36 | 21 | 41 | 21 | 41 | ||||||
| Yes | 115 | 63 | 124 | 68 | 54 | 57 | 60 | 64 | 30 | 59 | 30 | 59 | ||||||
| Total | 183 | 100 | 183 | 100 | 94 | 100 | 94 | 100 | 51 | 100 | 51 | 100 | ||||||
| Hospitalized | 0.86 | 0.62 | 1 | |||||||||||||||
| No | 140 | 77 | 136 | 74 | 71 | 76 | 67 | 71 | 45 | 88 | 44 | 86 | ||||||
| Yes | 42 | 23 | 46 | 25 | 23 | 24 | 27 | 29 | 6 | 12 | 7 | 14 | ||||||
| NA | 1 | 1 | 1 | 1 | 0 | 0 | 0 | 0 | 0 | 0 | 0 | 0 | ||||||
| Total | 183 | 100 | 183 | 100 | 94 | 100 | 94 | 100 | 51 | 100 | 51 | 100 | ||||||
| WBC count | 0.64 | 0.32 | 0.79 | |||||||||||||||
| Normal | 157 | 86 | 149 | 81 | 81 | 86 | 76 | 81 | 37 | 73 | 40 | 78 | ||||||
| Low | 1 | 1 | 3 | 2 | 3 | 3 | 2 | 2 | 1 | 2 | 2 | 4 | ||||||
| High | 16 | 9 | 20 | 11 | 5 | 5 | 12 | 13 | 8 | 16 | 5 | 10 | ||||||
| NA | 9 | 5 | 11 | 6 | 5 | 5 | 4 | 4 | 5 | 10 | 4 | 8 | ||||||
| Total | 183 | 100 | 183 | 100 | 94 | 100 | 94 | 100 | 51 | 100 | 51 | 100 | ||||||
| Hgb (g/dL) | 0.37 | 0.86 | 0.83 | |||||||||||||||
| ≥12 | 140 | 77 | 128 | 70 | 71 | 76 | 69 | 73 | 28 | 55 | 31 | 61 | ||||||
| <12 | 34 | 19 | 44 | 24 | 18 | 19 | 21 | 22 | 18 | 35 | 16 | 31 | ||||||
| NA | 9 | 5 | 11 | 6 | 5 | 5 | 4 | 4 | 5 | 10 | 4 | 8 | ||||||
| Total | 183 | 100 | 183 | 100 | 94 | 100 | 94 | 100 | 51 | 100 | 51 | 100 | ||||||
Cis, cisplatin; q3wk, once every 3 weeks; Q1wk, once every week; IC, induction chemotherapy; HPV, human papilloma virus; NA, not available; RT, radiotherapy; IQR, interquartile range; ICT, induction chemotherapy; Nut, nutrition; WBC, white blood cell; Hgb, hemoglobin
Figure 1.

Overall survival for chemoradiation with vs. without induction after matching.
Figure 2.

Cancer-specific survival for chemoradiation with vs. without induction after matching.
HDC and LDC chemoradiation
A total of 183 pairs were matched, with all variables well balanced (Table 3). Median overall follow-up was 60.4 months (IQR, 38.0–88.4). Median OS was 38.7 months (IQR, 24.8–61.5) and 44.8 months (IQR, 20.8–78.6) for HDC and LDC cohorts, respectively (P=0.35). OS at 5 years was 59.3% (95% CI, 51.9–67.7%) for patients treated with HDC and 54.1% (95% CI, 46.9–62.2%) for patients treated with LDC (P=0.35, Figure 3). CSS at 5 years was 70.3% (95% CI, 63.0–78.4%) for HDC cohort and 62.4% (95% CI, 55.2–70.5%) for LDC cohort (P=0.09, Figure 4).
Figure 3.

Overall survival for three-weekly cisplatin (cis q3wk) vs. weekly cisplatin (cis q1wk) chemoradiation after matching.
Figure 4.
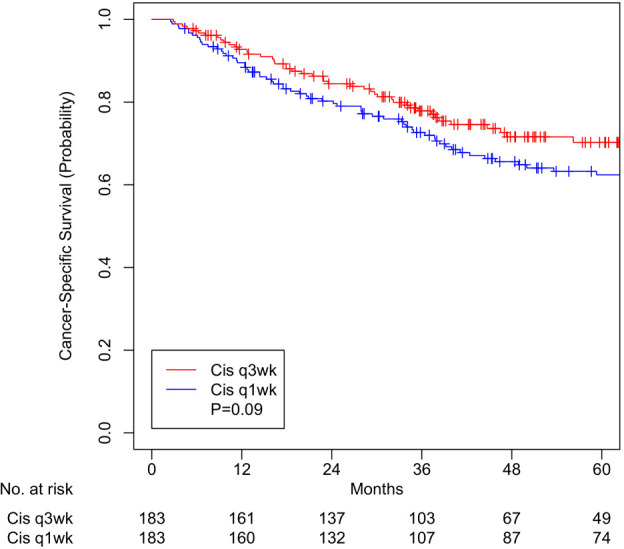
Cancer-specific survival three-weekly cisplatin (cis q3wk) vs. weekly cisplatin (cis q1wk) chemoradiation after matching.
HDC and non-cisplatin chemoradiation
A total of 94 pairs were matched, with all variables well balanced (Table 3). Median overall follow-up was 52.3 months (IQR, 39.1–94.5). Median OS was 37.7 months (IQR, 21.4–60.5) and 42.6 months (IQR, 19.9–70.9) for HDC and other chemotherapy cohorts, respectively (P=0.51). OS at 5 years was 54.5% (95% CI, 44.7–66.4%) for patients treated with three-weekly HDC and 58.3% (95% CI, 48.6–69.8%) for patients treated with non-cisplatin CRT (P=0.51, Figure 5). CSS at 5 years was 67.5% (95% CI, 57.8–78.9%) for HDC cohort and 64.7% (95% CI, 55.0–76.0%) for non-cisplatin cohort (P=0.45, Figure 6).
Figure 5.

Overall survival for three-weekly cisplatin (cis q3wk) vs. non-cisplatin (other) chemoradiation after matching.
Figure 6.

Cancer-specific survival for three-weekly cisplatin (cis q3wk) vs. non-cisplatin (other) chemoradiation after matching.
Discussion
Analysis of well-balanced matched pairs of CRT regimens found: (I) ICT does not show to increase survival benefit of CRT alone, (II) HDC may not be the optimal dose as LDC shows insignificant difference in survival, and (III) non-cisplatin regimens fail to improve survival compared to HDC but may be an effective alternative for patients who are unfit to tolerate cisplatin. These findings are consistent with the literature.
We controlled for variables such as current smoking status, older age, advanced tumor stage, unexpected hospitalization, and nutrition support (Table 2) that are known to be associated with worse survival in our patients as well as other variables by performing propensity score matching in three groups of patients and created well-balanced matched-pairs (Table 3). Compared to patients who received ICT prior to CRT, patients who did not receive ICT had no difference in 5-year OS (51.5% vs. 41.0%, P=0.53, Figure 1) and CSS (64.9% vs. 49.7%, P=0.21, Figure 2). Compared to patients who received HDC-CRT, patients who received LDC had no difference in 5-year OS (59.3% vs. 54.1%, P=0.35, Figure 3) and CSS (70.3% vs. 62.4%, p=0.09, Figure 4); patients who received non-cisplatin also had no difference in 5-year OS (54.5% vs. 58.3%, P=0.51, Figure 5) and CSS (67.5% vs. 64.7%, P=0.45, Figure 6).
ICT compared to chemoradiation alone
Despite its potential to reduce tumor burden and assist in the administration of and patient selection for adjuvant therapy, ICT in treatment of HNC remains debatable with unproven advantage over standard-of-care with CRT alone (Tables 4-6).
Table 4. References for studies on induction chemotherapy.
| ICT | Study | Chemo | RT | OS | DFS | ||||||||||||||
|---|---|---|---|---|---|---|---|---|---|---|---|---|---|---|---|---|---|---|---|
| Author, year | Design | Incl pd | Tx | Arms | Pts (no.) | Median f/u (mo.) | Regimen | Dose to 1' (Gy) | 3-yr OS | 5-yr OS | Diff in OS | 3-yr DFS | 5-yr DFS | Diff in DFS | |||||
| ICT vs. Surg | Wolf et al. (VA Larynx), 1991 (25) |
Prosp PIII, LC | – | Def | A. ICT then RT | 166 | 33 | PF | 66–76 | 60% | – | p=0.98 | 58% | 53% | P=0.12 | ||||
| B. Surg then RT | 166 | – | 50–50.4 +/− 10 | 63% | – | 70% | 65% | ||||||||||||
| Lefebvre et al. (EORTC 24891), 1996 (26) | Prosp PIII, PSC | 1990–1992 | Def | A. ICT then RT | 100 | 51 | PF | 50 +/− 20 | 57% | 30% | None reported | 43% | 25% | None reported | |||||
| B. Surg then RT | 94 | – | 50 +/− 14 | 43% | 35% | 32% | 27% | ||||||||||||
| Forastiere et al. (RTOG 91–11), 2003 (3) | Prosp PIII, LC | 1992–2000 | Def | A. ICT then RT | 173 | 45.6 | Cis–5FU | 70 | 76% (2yr) | 55% | None reported | 52% (2–yr) | 38% | A>C, P=0.02; B>C, P=0.006 | |||||
| B. CRT | 172 | HDC | 70 | 74% (2-yr) | 54% | 61% (2-yr) | 36% | ||||||||||||
| C. RT alone | 173 | – | 70 | 75% (2-yr) | 56% | 44% (2-yr) | 27% | ||||||||||||
| ICT vs. CRT alone | Haddad et al. (PARADIGM), 2013 (27) | Prosp PIII | 2004–2008 | Def | A. ICT then CRT | 70 | 49 | TPF–> Doce/Carbo | 72/70 | 73% | 67% | P=0.77 | 67% (PFS) | – | P=0.82 | ||||
| B. CRT alone | 75 | HDC | 72 | 78% | 70% | 69% (PFS) | – | ||||||||||||
| Cohen et al. (DeCIDE), 2014 (28) | Prosp PIII | 2004–2009 | Def | A. ICT tbe CRT | 138 | 30 | TPF–> DFHX | 74–75 | – | 67% | P=0.68 | – | – | – | |||||
| B. CRT alone | 135 | DFHX | 74–75 | – | 67% | – | – | – | |||||||||||
| Ghi et al., ABSTRACT only (30) | Prosp PIII | 2008–2014 | Def | A. ICT then CRT | 207 | 41.3 | TPF –> Cis–5FU or Cetux | 70 | 58% | – | A>B, P=0.025 | 47% (PFS) | – | A>B, P=0.015 | |||||
| B. CRT alone | 208 | Cis–5FU or Cetux | 70 | 46% | – | 37% (PFS) | – | ||||||||||||
| Stokes et al., 2017 (31) | Retrosp | 2003–2011 | Def | A. ICT then CRT | 1569 | 29.7 | NA | >66 | – | – | p=0.35 | – | – | – | |||||
| B. CRT alone | 6462 | NA | >66 | – | – | – | – | – | |||||||||||
| Chen et al., 2016 (32) | Retrosp | 2002–2011 | Def | A. CRT alone | 7986 | 50 | Pt–based | 70 | 50% | 44% | A>B/C, P<0.0001 | – | 46% | A>B/C, P<0.0001 | |||||
| B. ICT +/− RT/CRT | 503 | Docetaxel–based | 70 | 38% | 30% | – | 41% | ||||||||||||
| C. ICT +/− RT/CRT | 2232 | Pt–based | 70 | 38% | 30% | – | 38% | ||||||||||||
| Ock et al., 2016 (33) | Retrosp | 2005–2013 | Def | A. ICT then CRT | 144 | 52.4 | Varied | 60 | 77% | – | A>B, P=0.017 (matched) | 65% (PFS) | – | P=0.06 | |||||
| B. CRT alone | 80 | Varied | 60 | 57% | – | 54% (PFS) | – | ||||||||||||
| Merlano et al., Ongoing (34) | Prosp PIII | Ongoing | Def | A. ICT then CRT | – | – | TPF- > Cetux | 70 | – | – | – | – | – | – | |||||
| B. CRT alone | – | – | HDC | 70 | – | – | – | – | – | – | |||||||||
| Yang et al., 2019 (35) | Prosp PIII, NPC | 2008–2015 | Def | A. ICT then CRT | 238 | 82.6 | PF- > HDC | – | 89% | 81% | A>B, P=0.04 | 81% | 73% | A>B, P=0.007 | |||||
| B. CRT alone | 238 | HDC | – | 88% | 77% | 74% | 63% | ||||||||||||
| Zhang et al., 2019 (36) | Prosp PIII, NPC | 2013–2016 | Def | A. ICT then CRT | 242 | 42.7 | Gem-Cis –> HDC | 70 | 95% | – | A>B, HR 0.43 | 85% | – | A>B, P=0.001 | |||||
| B. CRT alone | 238 | HDC | 70 | 90% | – | 77% | – | ||||||||||||
Chemo, chemotherapy; RT, radiotherapy; CRT, chemoradiation; OS, overall survival; DFS, disease–free survival; PFS, progression–free survival; ICT, induction chemotherapy; Incl pd, inclusion period; Tx, treatment; Pts, patients; f/u, follow–up; 1’, primary; Diff, difference; Surg, surgery; Pros, prospective; PIII, phase III; Retrosp, retrospective; LC, laryngeal cancer; PSC, pyriform sinus cancer; NPC, nasopharyngeal cancer; TPF, docetaxel-Platinum-5-Fluorouracil (Docetaxel 75 mg/m2 on day 1, cisplatin 75–100 mg/m2 on day 1, 5-fluorouracil 750–1,000 mg/m2 on days 1–4 as continuous infusion; 3–4 cycles on 21–day interval); PF, Platinum-5-Fluorouracil (Cisplatin 80–100 mg/m2 given as rapid intravenous infusion followed by 5-fluorouracil 800–1,000 mg/m2/day continuous 24-hour infusion for 5 days; 2–4 cycles on 21-day interval); Def, definitive; Cis-5FU, Cisplatin-5-Fluorouracil (Cisplatin 75–100 mg/m2 bolus then 5–fluorouracil 1 g continuous infusion for 2–3 cycles); HDC, high dose cisplatin (80–100 mg/m2 3–weekly ×2–3 cycles); Doce, Docetaxel (20 mg/m2 weekly for 4 cycles); Carbo, Carboplatin (weekly); DFHX, Docetaxel-fluorouracil-hydroxyurea; Cetux, Cetuximab (initial dose 400 mg/m2 during the week before radiotherapy followed by maximum of 7 doses of 250 mg/m2 during radiotherapy; Pt, Platinum; Gem-Cis, Gemcitabine-Cisplatin (Gemcitabine 1 g/m2 on days 1 and 8, cisplatin 80 mg/m2 on days 1, 22, 43).
Table 5. References for studies on induction chemotherapy.
| ICT | Study | LRC | DC | Response | ||||||||
|---|---|---|---|---|---|---|---|---|---|---|---|---|
| Author | Arms | 2-yr LRC | Diff in LRC | 3-yr DC | 5-yr DC | Diff in DC | Overall Resp | Diff in Resp | ||||
| ICT vs. Surg | Wolf et al. (25) | A. ICT –> RT | 92%, ns | B>A, P=0.0005 | 89%, ns | – | A>B, P=0.016 | – | None reported | |||
| B. Surg –> RT | 95%, ns | 83%, ns | – | – | ||||||||
| Lefebvre et al. (26) | A. ICT –> RT | None reported | 72% | 65% | A>B, P=0.041 | – | None reported | |||||
| B. Surg –> RT | 57% | 52% | – | |||||||||
| Forastiere et al. (3) | A. ICT –> RT | 61% [54–69] | B>A, P=0.003 | 91%, 2-yr DC | 85% | B>C, P=0.03 | – | – | ||||
| B. CRT | 78% [72–85] | A vs. C, P=0.16 | 92%, 2-yr DC | 88% | – | – | ||||||
| C. RT alone | 56% [48–63] | B>C, P<0.001 | 84%, 2-yr DC | 78% | – | – | ||||||
| ICT vs. CRT alone | Haddad et al. (27) | A. ICT –> CRT | 84%, ns | None reported | 93%, ns | – | None reported | – | – | |||
| B. CRT alone | 85%, ns | 89%, ns | – | – | – | |||||||
| Cohen et al. (28) | A. ICT –> CRT | 70% | P=0.16 | – | 62% | P=0.37 | 74% | P=0.45 | ||||
| B. CRT alone | 60% | – | 60% | 79% | ||||||||
| Ghi et al., Abstract (30) | A. ICT –> CRT | – | – | – | – | – | – | – | ||||
| B. CRT alone | – | – | – | – | – | – | – | |||||
| Stokes et al. (31) | A. ICT –> CRT | – | – | – | – | – | – | – | ||||
| B. CRT alone | – | – | – | – | – | – | – | |||||
| Chen et al. (32) | A. CRT alone | – | – | – | – | – | ||||||
| B. ICT +/− RT/CRT | – | – | – | – | – | |||||||
| C. ICT +/− RT/CRT | – | – | – | – | – | |||||||
| Ock et al. (33) | A. ICT –> CRT | 69% (3-yr) | P=0.11 | 89% | – | P=0.85 | 76% | A>B, P=0.005 (matched) | ||||
| B. CRT alone | 59% (3-yr) | 87% | – | 53% | ||||||||
| Merlano et al., ongoing (34) | A. ICT –> CRT | – | – | – | – | – | – | – | ||||
| B. CRT alone | – | – | – | – | – | – | – | |||||
| Yang et al. (35) | A. ICT –> CRT | 88% (5-yr) | P=0.21 | 86% | 83% | A>B, P=0.014 | – | – | ||||
| B. CRT alone | 85% (5-yr) | 82% | 73% | – | – | |||||||
| Zhang et al. (36) | A. ICT –> CRT | 92% (3-yr) | None reported | 91% | – | None reported | 97% | None reported | ||||
| B. CRT alone | 91% (3-yr) | 84% | – | 97% | ||||||||
LRC, locoregional control; DC, distant control; ICT, induction chemotherapy; CRT, chemoradiation; RT, radiotherapy; Diff, difference; Resp, response; Surg, surgery; TPF, docetaxel-platinum-5-fluorouracil (docetaxel 75 mg/m2 on day 1, cisplatin 75–100 mg/m2 on day 1, 5-fluorouracil 750–1,000 mg/m2 on days 1–4 as continuous infusion; 3–4 cycles on 21-day interval); PF, platinum-5-fluorouracil (cisplatin 80–100 mg/m2 given as rapid intravenous infusion followed by 5-fluorouracil 800–1,000 mg/m2/day continuous 24-hour infusion for 5 days; 2–4 cycles on 21-day interval).
Table 6. References for studies on induction chemotherapy (continued).
| ICT | Study | Severe acute toxicity (grade 3–5) | |||||||||||||||||
|---|---|---|---|---|---|---|---|---|---|---|---|---|---|---|---|---|---|---|---|
| Author | Arms | Pts (no.) | N/V | Mucositis | Dysphagia | Leukopenia | Neutropenia | Tbcp | Anemia | Infection | Renal | Neuro | Skin | Ototoxic | Total toxic deaths | All | Diff in acute toxicity | ||
| ICT vs. Surg | Wolf et al. (25) | A. ICT –> RT | – | – | – | – | – | – | – | – | – | – | – | – | – | 5 | – | None reported | |
| B. Surg –> RT | – | – | – | – | – | – | – | – | – | – | – | – | – | 3 | – | ||||
| Lefebvre et al. (26) | A. ICT –> RT | – | – | – | – | – | – | – | – | – | – | – | – | – | – | – | Not assessed | ||
| B. Surg –> RT | – | – | – | – | – | – | – | – | – | – | – | – | – | – | – | ||||
| Forastiere et al. (3) | A. ICT –> RT | 168 | 14% | 20% | 19% | 52% (hematologic) | 5% | 2% | 4% | 10% | – | 5 | 66% | None reported | |||||
| B. CRT | 171 | 20% | 43% | 35% | 47% (hematologic) | 4% | 4% | 5% | 7% | – | 9 | 77% | |||||||
| C. RT alone | 171 | 0 | 24% | 19% | 3% (hematologic) | 1% | 0 | 0 | 9% | – | 5 | 47% | |||||||
| ICT vs. CRT alone | Haddad et al. (27) | A. ICT –> CRT | – | – | – | – | – | – | – | – | – | – | – | – | – | – | – | Not assessed | |
| B. CRT alone | – | – | – | – | – | – | – | – | – | – | – | – | – | – | – | ||||
| Cohen et al. (28) | A. ICT –> CRT | 124 | 6%/3% | 51% | 12% | 26% | 3% | 3% | 7% | 11% | – | – | 18% | – | – | 47% | A>B, P=0.002 | ||
| B. CRT alone | 133 | 5%/2% | 47% | 15% | 11% | 2% | 2% | 3% | 14% | – | – | 24% | – | – | 24% | ||||
| Ghi et al., Abstract (30) | A. ICT –> CRT | – | – | – | – | – | – | – | – | – | – | – | – | – | – | – | Not assessed | ||
| B. CRT alone | – | – | – | – | – | – | – | – | – | – | – | – | – | – | – | ||||
| Stokes et al. (31) | A. ICT –> CRT | – | – | – | – | – | – | – | – | – | – | – | – | – | – | – | Not assessed | ||
| B. CRT alone | – | – | – | – | – | – | – | – | – | – | – | – | – | – | – | ||||
| Chen et al. (32) | A. CRT alone | – | – | – | – | – | – | – | – | – | – | – | – | – | – | – | Not assessed | ||
| B. ICT +/− RT/CRT | – | – | – | – | – | – | – | – | – | – | – | – | – | – | – | ||||
| C. ICT +/− RT/CRT | – | – | – | – | – | – | – | – | – | – | – | – | – | – | – | ||||
| Ock et al. (33) | A. ICT –> CRT | – | – | – | – | – | – | – | – | – | – | – | – | – | – | – | Not assessed | ||
| B. CRT alone | – | – | – | – | – | – | – | – | – | – | – | – | – | – | – | ||||
| Merlano et al., Ongoing (34) | A. ICT –> CRT | – | – | – | – | – | – | – | – | – | – | – | – | – | – | – | Not assessed | ||
| B. CRT alone | – | – | – | – | – | – | – | – | – | – | – | – | – | – | – | ||||
| Yang et al. (35) | A. ICT –> CRT | No report on acute adverse events. Eye damage significantly higher with CRT alone than ICT–>CRT (16% vs. 10%, P=0.03) | |||||||||||||||||
| B. CRT alone | |||||||||||||||||||
| Zhang et al. (36) | A. ICT –> CRT | 239 | 23% | 29% | – | 26% | 28% | 11% | 10% | 0 | 3% | – | 2% | 0 | – | 76% | None reported | ||
| B. CRT alone | 237 | 14% | 32% | – | 20% | 11% | 1% | 1% | 0 | 0% | – | 4% | 0 | – | 56% | ||||
ICT, induction chemotherapy; Pts, patients; N/V, nausea or vomiting; Tbcp, thrombocytopenia; Neuro, neurological; Diff, difference; Surg, surgery; TPF, docetaxel-platinum-5-fluorouracil (docetaxel 75 mg/m2 on day 1, cisplatin 75–100 mg/m2 on day 1, 5–fluorouracil 750–1,000 mg/m2 on days 1–4 as continuous infusion; 3–4 cycles on 21-day interval); PF, platinum-5-fluorouracil (cisplatin 80–100 mg/m2 given as rapid intravenous infusion followed by 5-fluorouracil 800–1,000 mg/m2/day continuous 24-hour infusion for 5 days; 2–4 cycles on 21-day interval); CRT, chemoradiation; RT, radiotherapy.
Pignon et al. in a meta-analysis of 87 trials found that CRT had a greater mortality benefit than ICT, though ICT offered a significant reduction of distant metastasis (DM) risk (HR 0.73, 95% CI, 0.61–0.88, P=0.001) (1).
Three recent phase III randomized trials compared docetaxel, cisplatin, and 5-flurouracil (TPF) ICT followed by CRT against CRT alone in patients with locally advanced HNC (28,29,34). Two of these trials fell short of their target accrual (145 of targeted 330 patients in PARADIGM, 285 of targeted 400 patients in DeCIDE trial) and failed to show significant difference in OS between the two arms (HR 1.09, 95% CI, 0.59–2.03, P=0.77 in PARADIGM; HR 0.91, 95% CI 0.59–1.41, P=0.70 in DeCIDE), and both showed 3-year OS rates over 20% higher than the expected 50–55% in the two arms (28,29). Although we reviewed a heterogeneous patient population including those with advanced as well as earlier stage disease and used taxane-based of ICT, analysis of our matched pairs supports the lack of improvement in survival with taxane-based induction before CRT. Similarly, a retrospective analysis of over 8,000 patients in the National Cancer Data Base (NCDB) by Stokes et al. reports that ICT does not offer significant survival advantage when compared to CRT alone (HR 0.96, 95% CI, 0.88–1.05, P=0.35) while making it more likely for patients to receive lower (<66 Gy) RT doses (P<0.01); subgroup analysis on advanced disease also did not show difference in survival with ICT (31). Chen et al. retrospectively analyzed over 10,000 HNC patients in Taiwan who were treated with either CRT alone or ICT (docetaxel- or platinum-based) preceding locoregional treatment and also showed superior survival rate (P<0.0001) with CRT alone (32).
In contrast, Ghi et al. in Italy randomized 420 patients to receive TPF then CRT (with cisplatin or cetuximab) or CRT (with cisplatin or cetuximab) alone and demonstrated 3-year OS (57.6% vs. 45.7%, HR 0.72, 95% CI, 0.55–0.96, P=0.025) and PFS (46.8% vs. 36.7%, HR 0.73, 95% CI, 0.57–0.94, P=0.015) favoring TPF over CRT alone (30). The 3-year OS rates fall within the expected range but may reflect compromised survival due to use of cetuximab- rather than solely cisplatin-based CRT. A retrospective single-center analysis with propensity score matching by Ock et al. was similar to our study but had different results that too showed survival benefit with taxane-based ICT, which improved 3-year OS (77.4% vs. 56.7%, HR 0.48, 95% CI, 0.26–0.87, P=0.017) as well as complete response rates (75.7% vs. 52.9%, P=0.005) compared to CRT alone (33). Subgroup analysis was also done and showed that male patients with N2-3 oropharyngeal cancer had improved OS with ICT followed by CRT.
The ongoing phase III trial (INTERCEPTOR) by Gruppo Oncologico del Nord-Ovest comparing TPF followed by cetuximab-CRT and HDC-CRT alone (clinicaltrials.gov, NCT00999700) will stratify patients by HPV status (34).
ICT may also play a role in locoregionally advanced nasopharyngeal cancer (LA-NPC.) Yang et al. recently reported on 476 patients with LA-NPC that demonstrated long-term OS (81% vs. 77%, P=0.04) and disease-free survival (DFS) (73% vs. 63%, P=0.007) benefits with ICT preceding standard CRT (35). Zhang et al. randomized a similarly sized cohort of LA-NPC patients to receive gemcitabine and cisplatin-based ICT or CRT alone and also reported improved 3-year OS (HR 0.43, 95% CI, 0.24–0.77) and 3-year DFS (85% vs. 77%, P=0.001) with ICT (36).
With the possible exception of LA-NPC, routine use of ICT may not be advised given increased toxicity and no clear survival benefit. In our patients, we no longer routinely use ICT except: (I) on a clinical trial or (II) if required to achieve 30 days of smoking cessation in current smokers. Current smokers are known to have significantly reduced survivals that can be effectively ameliorated by 30 days of smoking cessation (37). This OS benefit justifies use of ICT; moreover, ICT allows initiation of treatment without significant delay from the time of diagnosis which can also reduce survival (38).
Optimal cisplatin dose for chemoradiation
In addition to studies showing the OS and LRC benefits of HDC (1-7), as shown in Tables 7-9, 2 of 3 studies of LDC with RT showed significant OS benefit over RT alone and the third showed significant improvement in LRC.
Table 7. References for studies on cisplatin–based chemoradiotherapy regimen.
| CIS-CRT | Study | Chemo | RT | OS | DFS | |||||||||||||||
|---|---|---|---|---|---|---|---|---|---|---|---|---|---|---|---|---|---|---|---|---|
| Author, year | Design | Incl pd | Tx | Arms | Pts (no.) | Median f/u (mo.) | Regimen | Dose to 1’ (Gy) | 3-yr OS | 5-yr OS | Diff in OS | 3-yr DFS | 5-yr DFS | Diff in DFS | ||||||
| HDC vs. RT | Pignon et al. (MACH–NC), 2009 (1) | Retrosp | 1965–2000 | Def/Adj | CRT vs. LRT | Total 17,346 | 67.2 | Varied | Varied | CRT has 6.5% 5-yr absolute OS benefit, P<0.001 | CRT improves DFS, P<0.0001 | |||||||||
| ICT vs. LRT | Varied | Varied | ||||||||||||||||||
| Adelstein et al., 2003 (2) | Prosp PIII | 1992–1999 | Def | A. RT alone | 95 | 41 | – | 70 | 23% | 14% | B>A, P=0.014 | 33% | 24% | B>A, P=0.01 | ||||||
| B. CRT | 87 | HDC | 70 | 37% | 26% | 51% | 45% | |||||||||||||
| C. Split CRT | 89 | Cis–5FU | 60–70 | 27% | 21% | 41% | 41% | |||||||||||||
| Cooper et al. (RTOG 9501), 2004 (5) | Prosp PIII | 1995–2000 | Adj | A. RT alone | 210 | 45.9 | – | 60–66 | 45% | 40% | P=0.19 | 38% | 25% | B>A, P=0.04 | ||||||
| B. CRT | 206 | HDC | 60–66 | 55% | 45% | 48% | 35% | |||||||||||||
| Bernier et al. (EORTC 22931), 2004 (6) | Prosp PIII | 1994–2000 | Adj | A. RT alone | 167 | 60 | – | 66 | 48% | 40% | B>A, P=0.02 | 40% (PFS) | 36% (PFS) | B>A, P=0.04 | ||||||
| B. CRT | 167 | 60 | HDC | 66 | 60% | 53% | 55% (PFS) | 47% (PFS) | ||||||||||||
| LDC vs. RT | Bachaud et al., 1996 (9) | Prosp PIII | 1984–1988 | Adj | A. RT alone | 44 | 36 | – | 65–74 | 46% (2-yr) | 13% | B>A, P<0.01 | 44% (2-yr) | 23% | B>A, P<0.02 | |||||
| B. CRT | 39 | 36 | LDC | 65–74 | 72% (2-yr) | 36% | 68% (2-yr) | 45% | ||||||||||||
| Sharma et al., 2010 (10) | Prosp PII, OP/NPC | 2003–2005 | Def | A. RT alone | 76 | 22 | – | 70 | 42% | – | B>A, P=0.024 | 42% (PFS) | – | P=0.88 | ||||||
| B. CRT | 77 | 22 | LDC | 70 | 62% | – | 37% (PFS) | – | ||||||||||||
| Ghosh-Laskar et al., 2016 (11) | Prosp PIII | 2000–2007 | Def | A. RT alone | 57 | 48 | – | 66–70 | – | 36% | P=0.11 | 25% | B>A, P=0.03 | |||||||
| B. CRT | 65 | 48 | LDC | 66–70 | – | 56% | 39% | |||||||||||||
| HDC vs. LDC | Lee et al., 2018 (12) | Retrosp | 2007–2012 | Def | A. HDC-CRT | 65 | – | HDC | 66.4, mean | 81% | – | P=0.34 | 64% (PFS) | – | P=0.81 | |||||
| B. LDC-CRT | 155 | – | LDC | 68.4, mean | 67% | – | 60% (PFS) | – | ||||||||||||
| Helfenstein et al., 2019 (13) | Retrosp | 2008–2015 | Def/Adj | A. HDC-CRT | 127 | 40.6 | HDC | 69–72/60–66 | Cum. cis dose >200 mg/m2 on OS, P=0.10 | Cum cis dose >200 mg/m2 on PFS, P=0.97 | ||||||||||
| B. LDC-CRT | 187 | 40.6 | LDC | 69–72/60–66 | ||||||||||||||||
| Bauml et al., 2019 (14) | Retrosp | 2000–2014 | Def | A. HDC-CRT | 2200 | – | HDC | – | – | – | P=0.44 | – | – | – | ||||||
| B. LDC-CRT | 701 | – | LDC | – | – | – | – | – | – | |||||||||||
| Szturz et al., 2017 (15) | Retrosp | – | Def/Adj | A. HDC-CRT | 31 studies | – | HDC | 66–70/60–66 | – | – | No diff in OS in Def/Adj setting | Unable to merge data from studies | ||||||||
| B. LDC-CRT | 17 studies | – | LDC | 66–70/60–66 | – | – | ||||||||||||||
| Tsan et al., 2012 (16) | Prosp PIII, OC | 2008–2010 | Adj | A. HDC-CRT | 26 | 12 | HDC | 66 | 79% (1-yr) | – | P=0.98 | – | – | – | ||||||
| B. LDC-CRT | 24 | 12 | LDC | 66 | 72% (1-yr) | – | – | – | – | |||||||||||
| Noronha et al., 2018 (17) | Prosp PIII | 2013–2017 | Def/Adj | A. HDC-CRT | 150 | 22 | HDC | 60 or 70 | 53% | – | P=0.48 | 48% (2-yr PFS) |
– | P=0.21 | ||||||
| B. LDC-CRT | 150 | 22 | LDC | 60 or 70 | 53% | – | 55% (2-yr PFS) |
– | ||||||||||||
Chemo, chemotherapy; RT, radiotherapy; OS, overall survival; DFS, disease-free survival; PFS, progression-free survival; Cis, cisplatin; CRT, chemoradiation; Incl pd, inclusion period; Tx, treatment; f/u, follow-up; 1’, primary; Diff, difference; Retrosp, retrospective; Prosp, prospective; PII/III, phase II/III; Def, definitive; Adj, adjuvant; LRT, locoregional treatment; ICT, induction chemotherapy; HDC, high dose cisplatin (80–100 mg/m2 3-weekly, 2–3 cycles); Cis-5FU, cisplatin-5-fluorouracil (Cisplatin 75–100 mg/m2 bolus then 5-fluorouracil 1 g continuous infusion for 2–3 cycles); LDC, low dose cisplatin (30–50 mg/m2 weekly, 6–9 cycles); OP, oropharyngeal cancer; NPC, nasopharyngeal cancer; OC, oral cavity squamous cell cancer.
Table 8. References for studies on cisplatin–based chemoradiotherapy regimen (continued).
| CIS-CRT | Study | LRC | DC | Response | |||||||||
|---|---|---|---|---|---|---|---|---|---|---|---|---|---|
| Author | Arms | 2-yr LRC | Diff in LRC | 3-yr DC | 5-yr DC | Diff in DC | Overall resp | Diff in resp | |||||
| HDC vs. RT | Pignon et al. (1) | CRT vs. LRT | CRT improves LRC, P=0.04 | ICT improves DC, P=0.001 | – | – | |||||||
| ICT vs. LRT | – | – | |||||||||||
| Adelstein et al. (2) | A. RT alone | – | – | – | – | – | 27.4% (CR) | C>A, P=0.002; A vs. B, P=0.07 | |||||
| B. CRT | – | – | – | – | – | 40.2% (CR) | |||||||
| C. Split CRT | – | – | – | – | – | 49.4% (CR) | |||||||
| Cooper et al. (5) | A. RT alone | 72% | B>C, P=0.01 | 77%, ns | P=0.46 | – | – | ||||||
| B. CRT | 82% | 80%, ns | – | – | |||||||||
| Bernier et al. (6) | A. RT alone | 69%, 5-yr LRC | B>A, P=0.007 | – | 75% | P=0.61 | – | – | |||||
| B. CRT | 88%, 5-yr LRC | – | 79% | – | – | ||||||||
| LDC vs. RT | Bachaud et al. (9) | A. RT alone | 59% | B>A, P=0.05 | 81% (2-yr) | 49% | None reported | – | – | ||||
| B. CRT | 84% | 73% (2-yr) | 58% | – | – | ||||||||
| Sharma et al. (10) | A. RT alone | 53%, overall | P=0.26 | 97%, overall | – | P=0.05 | 67% (CR) | B>A, P=0.04 | |||||
| B. CRT | 66%, overall | 90%, overall | – | 81% (CR) | |||||||||
| Ghosh-Laskar et al. (11) |
A. RT alone | 32%, 5-yr LRC | B>A, P=0.01 | – | – | None reported | – | – | |||||
| B. CRT | 49%, 5-yr LRC | – | – | – | – | ||||||||
| HDC vs. LDC | Lee et al. (12) | A. HDC-CRT | – | – | – | – | – | 92% | P=0.81 | ||||
| B. LDC-CRT | – | – | – | – | – | 91% | |||||||
| Helfenstein et al. (13) | A. HDC-CRT | – | – | – | – | – | – | – | |||||
| B. LDC-CRT | – | – | – | – | – | – | – | ||||||
| Bauml et al. (14) | A. HDC-CRT | – | – | – | – | – | – | – | |||||
| B. LDC-CRT | – | – | – | – | – | – | – | ||||||
| Szturz et al. (15) | A. HDC-CRT | Unable to merge data | Unable to merge data | 80.0% | No diff | ||||||||
| B. LDC-CRT | 89.0% | ||||||||||||
| Tsan et al. (16) | A. HDC-CRT | 71% (1-yr) | P=0.81 | – | – | – | – | – | |||||
| B. LDC-CRT | 60% (1-yr) | – | – | – | – | – | |||||||
| Noronha et al. (17) | A. HDC-CRT | 73% | A>B, P=0.014 | – | – | – | – | – | |||||
| B. LDC-CRT | 59% | – | – | – | – | – | |||||||
Cis, cisplatin; CRT, chemoradiation; LRC, locoregional control; DC, distant control; Diff, difference; Resp, response; HDC, high dose cisplatin (80–100 mg/m2 3-weekly, 2–3 cycles); LDC, low dose cisplatin (30–50 mg/m2 weekly, 6–9 cycles); RT, radiotherapy; LRT, locoregional treatment; CR, complete response; ns, not specified.
Table 9. References for studies on cisplatin–based chemoradiotherapy regimen (continued).
| CIS-CRT | Study | Severe acute toxicity (grade 3–5) | |||||||||||||||||
|---|---|---|---|---|---|---|---|---|---|---|---|---|---|---|---|---|---|---|---|
| Author | Arms | Pts (no.) | N/V | Mucositis | Dysphagia | Leukopenia | Neutropenia | Tbcp | Anemia | Infection | Renal | Neuro | Skin | Oto–toxic | Total toxic deaths | All | Diff in acute toxicity | ||
| HDC vs. RT | Pignon et al. (1) | CRT vs. LRT | – | – | – | – | – | – | – | – | – | – | – | – | – | – | – | Not assessed | |
| ICT vs. LRT | – | – | – | – | – | – | – | – | – | – | – | – | – | – | – | ||||
| Adelstein et al. (2) | A. RT alone | 98 | 6% | 33% | 1% | – | 0 | 0 | – | 1% | – | 13% | – | 2 | 52% | B>A, P<0.0001 | |||
| B. CRT | 95 | 16% | 45% | 42% | – | 3% | 18% | – | 8% | – | 7% | – | 4 | 89% | B>C, P=0.02 | ||||
| C. Split CRT | 94 | 9% | 47% | 31% | – | 3% | 19% | – | 0 | – | 2% | – | 2 | 77% | C>A, P<0.001 | ||||
| Cooper et al. (5) | A. RT alone | 210 | 0 | 18% | 15% | 0 | 0 | 0 | 0 | 0 | 10% | – | 0 | 34% | B>A, P<0.001 | ||||
| B. CRT | 206 | 19% | 30% | 24% | 38% (hematologic) | 3% | 6% | 2% | 5% | 7% | – | 4 | 77% | ||||||
| Bernier et al. (6) | A. RT alone | 167 | – | 21% | 12% | – | – | – | – | – | – | – | 1% | – | 1 | – | B>A, P=001 | ||
| B. CRT | 167 | 12% | 41% | 10% | 16% | 13% | – | – | – | – | – | 2% | – | 1 | – | ||||
| LDC vs. RT | Bachaud et al. (9) | A. RT alone | 44 | – | – | – | – | – | – | – | – | – | – | – | – | 0 | 18% | None reported | |
| B. CRT | 39 | – | – | – | – | – | – | – | – | – | – | – | – | 0 | 41% | ||||
| Sharma et al. (10) | A. RT alone | 76 | – | – | – | – | – | – | – | – | – | – | – | – | 0 | 20% | B>A, P=0.015 | ||
| B. CRT | 77 | – | – | – | – | – | – | – | – | – | – | – | – | 0 | 40% | ||||
| Ghosh-Laskar et al. (11) |
A. RT alone | 57 | – | 21% | – | – | – | – | – | – | – | – | 26% | – | 0 | – | None reported | ||
| B. CRT | 65 | – | 35% | – | – | – | – | – | – | – | – | 23% | – | 2 | – | ||||
| HDC vs. LDC | Lee et al. (12) | A. HDC-CRT | – | – | – | – | – | – | – | – | – | – | – | – | – | – | – | – | |
| B. LDC-CRT | – | – | – | – | – | – | – | – | – | – | – | – | – | – | – | – | |||
| Helfenstein et al. (13) | A. HDC-CRT | 127 | – | – | – | – | – | – | – | – | 33% | – | – | – | – | – | A>B, P=0.02 | ||
| B. LDC-CRT | 187 | – | – | – | – | – | – | – | – | 21% | – | – | – | – | – | ||||
| Bauml et al. (14) | A. HDC-CRT | 2200 | HDC: higher rate of AKI (HR 1.72, P<0.001), neutropenia (HR 2.21, P=0.005), dehydration (HR 1.15, P=0.04), hearing loss (HR 1.34, P=0.004) | ||||||||||||||||
| B. LDC-CRT | 701 | ||||||||||||||||||
| Szturz et al. (15) | A. HDC-CRT | 25,6 studies | 16, 10% | 42, 37% | 26, 20% | 19, 19% | 18, 14% | 4, 2% | 8, 6% | 5, 11% | 5, 3% | 2, 5% | 11, 6% | 3, 2% | 3, 2% | – | Bold = sig diff | ||
| B. LDC-CRT | 14,3 studies | 3, 16% | 25, 51% | 8, 54% | 1, 12% | 5, 9% | 1, 2% | 4, 3% | 8, NA% | 1, 2% | 1, NA% | 14, 12% | NA, 2% | 2, 1% | – | ||||
| Tsan et al. (16) | A. HDC-CRT | 26 | 12% | 39% | 54% | 0 | 0 | 0 | 4% | – | – | 8% | – | – | 81% | B>A, P=0.02 | |||
| B. LDC-CRT | 24 | 21% | 75% | 54% | 13% | 4% | 0 | 4% | – | – | – | 8% | – | – | 92% | ||||
| Noronha et al. (17) | A. HDC-CRT | 149 | 7% | 18% | 39% | 16% | 13% | 2% | 5% | 34% | 0% | 0% | 8% | 13% | 10 | 85% | A>B, P=0.006 | ||
| B. LDC-CRT | 148 | 1% | 17% | 42% | 3% | 1% | 3% | 2% | 21% | 0% | 0% | 7% | 5% | 5 | 72% | ||||
Cis, cisplatin; CRT, chemoradiation; Pts, patients; N/V, nausea or vomiting; Tbcp, thrombocytopenia; Neuro, neurological; Diff, difference; HDC, high dose cisplatin (80–100 mg/m2 3-weekly, 2–3 cycles); LDC, low dose cisplatin (30–50 mg/m2 weekly, 6–9 cycles); RT, radiotherapy; LRT, locoregional treatment; AKI, acute kidney injury; HR, hazard ratio.
Szturz et al. in a meta-analysis of 59 prospective studies with over 5,200 locally advanced HNC patients found no significant difference in OS was observed between HDC- and LDC-CRT. In the definitive setting, LDC had greater compliance (88% vs. 71%, P=0.0017) and less toxicity such as myelosuppression (leukopenia P=0.0083, neutropenia P=0.0024), severe nephrotoxicity (P=0.01) and severe nausea and/or vomiting (P<0.0001) compared to HDC (15).
Our findings are consistent with those of Szturz et al.; LDC appears to be equivalent to HDC in terms of OS. Although in our study we controlled for adverse events such as hospitalizations and risk factors such as comorbidities to create matched pairs, we are aware that in the early years of this analysis many patients were given LDC specifically because they were felt to be unable to tolerate HDC. Thus, we suspect that there remained a bias that favored HDC despite our attempts to correct with match pairing. This may explain the non-significant decrease in CSS with LDC.
As shown in Tables 7-9, the majority of publications appear to reveal greater cisplatin-related toxicity with HDC than LDC. This warrants future study.
Non-cisplatin agents for chemoradiation
Non-platinum agents such as cetuximab (IgG1 monoclonal antibody against epidermal growth factor receptor) and other platinum agents such as carboplatin (second generation platinum drug) have been investigated (Tables 10-12). Two randomized phase III trials by Gillison et al. (RTOG 1016) and Mehanna et al. (De-ESCALATE) examined the outcome of cetuximab (400 mg/m2 loading dose then seven weekly 250 mg/m2 doses) versus HDC given concomitantly with RT (70 Gy in standard fractions over six weeks) used to treat patients with HPV-positive oropharyngeal cancer; both trials failed to demonstrate non-inferiority of cetuximab over cisplatin (19,20). RTOG 1016 showed that cetuximab neither met the non-inferiority criteria for OS (P=0.51) nor improved acute (P=0.16) or late (P=0.19) severe toxicity profile of cisplatin while exhibiting inferior 5-year progression-free survival (67.3% vs. 78.4%, P=0.0002). De-ESCALATE study also showed that cetuximab did not reduce overall severe toxicity (P=0.98) while showing worse 2-year OS (89.4% vs. 97.5%, P=0.001) and 2-year recurrence (16.1% vs. 6.0%, P=0.001) compared to cisplatin. Our non-cisplatin cohort included patients who received weekly cetuximab and those who received modified regimen of crossover to cetuximab, but we did not directly compare cisplatin- with cetuximab-based CRT in our retrospective review of a heterogeneous patient population. Although we showed that patients who received non-cisplatin regimen had no difference in OS with those who received cisplatin, this may be the result of including other platinum-based regimen in our non-cisplatin cohort. It appears safe to assume that cetuximab is neither less toxic nor equally as effective as cisplatin, which thus cannot be replaced in treating HPV-positive oropharyngeal cancer.
Table 10. References for studies on non–cisplatin chemoradiotherapy regimen.
| Study | Chemo | RT | OS | DFS | ||||||||||||||
|---|---|---|---|---|---|---|---|---|---|---|---|---|---|---|---|---|---|---|
| Author, year | Design | Incl pd | Tx | Arms | Pts (no.) | Median f/u (mo.) | Regimen | Dose to 1’ (Gy) | 3-yr OS | 5-yr OS | Diff in OS | 3-yr DFS | 5-yr DFS | Diff in DFS | ||||
| Bonner et al., 2006 (19) | Prosp PIII | 1992–2002 | Def | A. RT alone | 213 | 54 | – | 70–76.8 | 45% | 32% | B>A, P=0.03 | 31% (PFS) | – | B>A, P=0.04 | ||||
| B. Cetux-CRT | 211 | 54 | Cetux | 70–76.8 | 55% | 40% | 42% (PFS) | – | ||||||||||
| Gillison et al. (RTOG 1016), 2019 (20) | Prosp PIII, HPV-OP | 2011–2014 | Def | A. HDC-CRT | 406 | 54 | HDC | 70 | 90% | 85% | A>B, P=0.016 | 82% | 78% | A>B, P=0.0002 | ||||
| B. Cetux-CRT | 399 | 54 | Cetux | 70 | 87% | 78% | 72% | 67% | ||||||||||
| Mehanna et al. (DeESCALATE), 2019 (21) | Prosp PIII, HPV-OP | 2012–2016 | Def | A. HDC-CRT | 166 | 25.9 | HDC | 70 | 98% (2-yr) | – | A>B, P=0.0012 | – | – | – | ||||
| B. Cetux-CRT | 168 | 25.9 | Cetux | 70 | 89% (2-yr) | – | – | – | – | |||||||||
| Shapiro et al., 2014 (22) | Retrosp | 2002–2008 | Def | A. HDC-CRT | 259 | 53.1 | HDC | 70 | – | 87% (4-yr) | A>C, P<0.0001 | – | – | – | ||||
| B. Carbo-CRT | 52 | 53.1 | Carbo-5-FU | 70 | – | 70% (4-yr) | B>C, P=0.002 | – | – | – | ||||||||
| C. Cetux-CRT | 49 | 53.1 | Cetux | 70 | – | 41% (4-yr) | A vs. B, P=0.35 | – | – | – | ||||||||
| Denis et al., 2004 (23) | Prosp PIII, OP | 1994–1997 | Def | A. RT alone | 113 | 66 | – | 70 | – | 16% | B>A, P=0.05 | – | 15% | B>A, P=0.01 | ||||
| B. Carbo-CRT | 109 | 66 | Carbo-5FU | 70 | – | 22% | – | 27% | ||||||||||
| Tao et al. (REACH), ABSTRACT only (24) | Prosp PIII | Ongoing | Def | A. HDC-CRT | – | – | HDC | 70 | – | – | – | – | – | – | ||||
| B. Cetux/Ave–RT | – | – | Cetux-Ave | 70 | – | – | – | – | – | – | ||||||||
Chemo, chemotherapy; RT, radiotherapy; OS, overall survival; DFS, disease–free survival; PFS, progression–free survival; CIS, cisplatin; CRT, chemoradiation; Incl pd, inclusion period; Tx, treatment; Pts, patients; f/u, follow-up; 1’, primary; Diff, difference; Prosp PIII, prospective phase III; Retrosp, retrospective; Def, definitive; HDC, high-dose cisplatin (80–100 mg/m2 3-weekly, 2–3 cycles); Carbo-5FU: carboplatin-5-Fluorouracil (carboplatin 70 mg/m2 and 5-fluorouracil 600 mg/m2/day continuous infusion for 4 days, 3 cycles on 21-day interval); Cetux: cetuximab (initial dose 400 mg/m2 during the week before radiotherapy followed by maximum of 7 doses of 250 mg/m2 during radiotherapy); Ave: avelumab (10 mg/kg intravenous infusion over 1 hour every 2 weeks during RT and for 12 months following radiotherapy); HPV, human papilloma virus; OP, oropharyngeal cancer.
Table 11. References for studies on non–cisplatin chemoradiotherapy regimen (continued).
| Study, author | Arms | LRC | DC | Response | ||||||
|---|---|---|---|---|---|---|---|---|---|---|
| 2-yr LRC | Diff in LRC | 3-yr DC | 5-yr DC | Diff in DC | Overall Resp | Diff in Resp | ||||
| Bonner et al. (19) | A. RT alone | 41% | B>A, P=0.005 | 83% | – | None reported | 64% | B>A, P=0.02 | ||
| B. Cetux-CRT | 50% | 84% | – | 74% | ||||||
| Gillison et al. (20) | A. HDC-CRT | 90% (5-yr) | A>B, P=0.0005 | – | – | P=0.09 | – | – | ||
| B. Cetux-CRT | 83% (5-yr) | – | – | – | – | |||||
| Mehanna et al. (21) | A. HDC-CRT | 94% | A>B, P=0.0007 | 97%, ns | – | A>B, P=0.01 | – | – | ||
| B. Cetux-CRT | 84% | 91%, ns | – | – | – | |||||
| Shapiro et al. (22) | A. HDC-CRT | 94% (4-yr) | C>A, P<0.0001 | – | 88% (4-yr) | None reported | – | – | ||
| B. Carbo-CRT | 90% (4-yr) | – | 82% (4-yr) | – | – | |||||
| C. Cetux-CRT | 60 (4-yr) | – | 71% (4-yr) | – | – | |||||
| Denis et al. (23) | A. RT alone | 25% (5-yr) | B>A, P=0.002 | 83%, ns | – | None reported | – | – | ||
| B. Carbo-CRT | 48% (5-yr) | 82%, ns | – | – | – | |||||
| Tao et al., Abstract only (24) | A. HDC-CRT | – | – | – | – | – | – | – | ||
| B. Cetux/Ave-RT | – | – | – | – | – | – | – | |||
LRC, locoregional control; DC, distant control; Cis, cisplatin; CRT, chemoradiation; Diff, difference; Resp, response; RT, radiotherapy; Cetux, cetuximab; Carbo, carboplatin; HDC, high dose cisplatin; Cetux/Ave, cetuximab or avelumab.
Table 12. References for studies on non-cisplatin chemoradiotherapy regimen (continued).
| Study, author | Arms | Severe acute toxicity (grade 3–5) | |||||||||||||||
|---|---|---|---|---|---|---|---|---|---|---|---|---|---|---|---|---|---|
| Pts (no.) | N/V | Mucositis | Dysphagia | Leukopenia | Neutropenia | Tbcp | Anemia | Infection | Renal | Neuro | Skin | Ototoxic | Total toxic deaths | All | Diff in acute toxicity | ||
| Bonner et al. (19) | A. RT alone | 212 | 6% | 52% | 30% | – | – | – | 6% | 1% | – | – | 1% | – | – | – | No sig diff |
| B. Cetux-CRT | 208 | 4% | 56% | 26% | – | – | – | 1% | 1% | – | – | 17% | – | – | – | ||
| Gillison et al. (20) | A. HDC-CRT | 398 | 19% | 42% | 37% | 12% | 15% | – | 11% | – | 3% | – | 8% | 3% | 6 | 82% | P=0.16 |
| B. Cetux-CRT | 394 | 8% | 46% | 32% | 0% | 1% | – | 0% | – | 0% | – | 12% | 0% | 6 | 77% | ||
| Mehanna et al. (21) | A. HDC-CRT | 162 | – | – | – | 12% (hematologic) | 12% | 7% | 6% | 4% | 2% | – | – | P=0.49 | |||
| B. Cetux-CRT | 165 | – | – | – | 1% (hematologic) | 13% | 0% | 10% | 30% | 2% | – | – | |||||
| Shapiro et al. (22) | A. HDC-CRT | No data on acute toxicity. Late toxicity was highest with 5FU/carboplatin (25%) vs. cisplatin (8%) vs. cetuximab (7.7%). | B>A, P=0.05; B>C, P=0.02 | ||||||||||||||
| B. Carbo-CRT | |||||||||||||||||
| C. Cetux-CRT | |||||||||||||||||
| Denis et al. (23) | A. RT alone | No data on acute toxicity. Late toxicity no significant difference between arms | |||||||||||||||
| B. Carbo-CRT | |||||||||||||||||
| Tao et al., Abstract only (24) | A. HDC-CRT | – | – | – | – | – | – | – | – | – | – | – | – | – | – | – | – |
| B. Cetux/Ave-RT | – | – | – | – | – | – | – | – | – | – | – | – | – | – | – | – | |
Cis, cisplatin; CRT, chemoradiation; Pts, patients; N/V, nausea or vomiting; Tbcp, thrombocytopenia; Neuro, neurological; Diff, difference; RT, radiotherapy; Cetux, cetuximab; HDC, high dose cisplatin; Carbo, carboplatin; Cetux/Ave, cetuximab or avelumab; 5FU, 5-fluorouracil.
There is an unmet need for an alternative CRT regimen for patients who cannot tolerate or risk the sequelae of severe toxicity with cisplatin. Prospective studies on alternative chemotherapy schedules and agents as well as immune checkpoint inhibitors (23) are warranted.
Conclusions
Survivals in our cohort were similar regardless of use of ICT, LDC, or non-cisplatin regimens. In the absence of a clear survival benefit, we only use ICT on clinical trial or as a temporizing maneuver for a patient trying to quit smoking. Patients unable to tolerate HDC should know that their survival may not be significantly impacted.
Supplementary
The article’s supplementary files as
Acknowledgments
The authors thank Adam Oberkircher PA and Kelsey Smith PA for their tireless efforts to provide excellent care of these patients.
Funding: This work was supported by the National Cancer Institute Cancer Center Support Grant (P30CA016056). Funding source had no role in study design, data collection, data analysis, data interpretation, or writing of the report.
Ethical Statement: The authors are accountable for all aspects of the work in ensuring that questions related to the accuracy or integrity of any part of the work are appropriately investigated and resolved. The study was conducted in accordance with the Declaration of Helsinki (as revised in 2013). The study was approved by the institutional review board of Roswell Park Comprehensive Cancer Center (EDR-103707) and individual consent for this retrospective analysis was waived.
Footnotes
Provenance and Peer Review: This article was commissioned by the Guest Editor (Dr. Mukund Seshadri) for the series “Head and Neck Cancers – Disease Biology, Diagnostics, Prevention and Management” published in Annals of Translational Medicine. The article has undergone external peer review.
Reporting Checklist: The authors have completed the STROBE reporting checklist. Available at http://dx.doi.org/10.21037/atm-20-5032
Data Sharing Statement: Available at http://dx.doi.org/10.21037/atm-20-5032
Conflicts of Interest: All authors have completed the ICMJE uniform disclosure form. (available at http://dx.doi.org/10.21037/atm-20-5032). The series “Head and Neck Cancers – Disease Biology, Diagnostics, Prevention and Management” was commissioned by the editorial office without any funding or sponsorship. The authors have no other conflicts of interest to declare.
References
- 1.Pignon JP, le Maître A, Maillard E, et al. Meta-analysis of chemotherapy in head and neck cancer (MACH-NC): an update on 93 randomised trials and 17,346 patients. Radiother Oncol 2009;92:4-14. 10.1016/j.radonc.2009.04.014 [DOI] [PubMed] [Google Scholar]
- 2.Adelstein DJ, Li Y, Adams GL, et al. An intergroup phase III comparison of standard radiation therapy and two schedules of concurrent chemoradiotherapy in patients with unresectable squamous cell head and neck cancer. J Clin Oncol 2003;21:92-8. 10.1200/JCO.2003.01.008 [DOI] [PubMed] [Google Scholar]
- 3.Forastiere AA, Goepfert H, Maor M, et al. Concurrent chemotherapy and radiotherapy for organ preservation in advanced laryngeal cancer. N Engl J Med 2003;349:2091-8. 10.1056/NEJMoa031317 [DOI] [PubMed] [Google Scholar]
- 4.Forastiere AA, Zhang Q, Weber RS, et al. Long-term results of RTOG 91-11: a comparison of three nonsurgical treatment strategies to preserve the larynx in patients with locally advanced larynx cancer. J Clin Oncol 2013;31:845-52. 10.1200/JCO.2012.43.6097 [DOI] [PMC free article] [PubMed] [Google Scholar]
- 5.Cooper JS, Pajak TF, Forastiere AA, et al. Postoperative concurrent radiotherapy and chemotherapy for high-risk squamous-cell carcinoma of the head and neck. N Engl J Med 2004;350:1937-44. 10.1056/NEJMoa032646 [DOI] [PubMed] [Google Scholar]
- 6.Bernier J, Domenge C, Ozsahin M, et al. Postoperative irradiation with or without concomitant chemotherapy for locally advanced head and neck cancer. N Engl J Med 2004;350:1945-52. 10.1056/NEJMoa032641 [DOI] [PubMed] [Google Scholar]
- 7.Cooper JS, Zhang Q, Pajak TF, et al. Long-term follow-up of the RTOG 9501/intergroup phase III trial: postoperative concurrent radiation therapy and chemotherapy in high-risk squamous cell carcinoma of the head and neck. Int J Radiat Oncol Biol Phys 2012;84:1198-205. 10.1016/j.ijrobp.2012.05.008 [DOI] [PMC free article] [PubMed] [Google Scholar]
- 8.de Castro G, Snitcovsky IM, Gebrim EM, et al. High-dose cisplatin concurrent to conventionally delivered radiotherapy is associated with unacceptable toxicity in unresectable, non-metastatic stage IV head and neck squamous cell carcinoma. Eur Arch Otorhinolaryngol 2007;264:1475-82. 10.1007/s00405-007-0395-9 [DOI] [PubMed] [Google Scholar]
- 9.Bachaud JM, Cohen-Jonathan E, Alzieu C, et al. Combined postoperative radiotherapy and weekly cisplatin infusion for locally advanced head and neck carcinoma: final report of a randomized trial. Int J Radiat Oncol Biol Phys 1996;36:999-1004. 10.1016/S0360-3016(96)00430-0 [DOI] [PubMed] [Google Scholar]
- 10.Sharma A, Mohanti BK, Thakar A, et al. Concomitant chemoradiation versus radical radiotherapy in advanced squamous cell carcinoma of oropharynx and nasopharynx using weekly cisplatin: a phase II randomized trial. Ann Oncol 2010;21:2272-7. 10.1093/annonc/mdq219 [DOI] [PubMed] [Google Scholar]
- 11.Ghosh-Laskar S, Kalyani N, Gupta T, et al. Conventional radiotherapy versus concurrent chemoradiotherapy versus accelerated radiotherapy in locoregionally advanced carcinoma of head and neck: Results of a prospective randomized trial. Head Neck 2016;38:202-7. 10.1002/hed.23865 [DOI] [PubMed] [Google Scholar]
- 12.Lee SY, Choi YS, Song IC, et al. Comparison of standard-dose 3-weekly cisplatin and low-dose weekly cisplatin for concurrent chemoradiation of patients with locally advanced head and neck squamous cell cancer: A multicenter retrospective analysis. Medicine (Baltimore) 2018;97:e10778. 10.1097/MD.0000000000010778 [DOI] [PMC free article] [PubMed] [Google Scholar]
- 13.Helfenstein S, Riesterer O, Meier UR, et al. 3-weekly or weekly cisplatin concurrently with radiotherapy for patients with squamous cell carcinoma of the head and neck – a multicentre, retrospective analysis. Radiat Oncol 2019;14:32. 10.1186/s13014-019-1235-y [DOI] [PMC free article] [PubMed] [Google Scholar]
- 14.Bauml JM, Vinnakota R, Anna Park YH, et al. Cisplatin every 3 weeks versus weekly with definitive concurrent radiotherapy for squamous cell carcinoma of the head and neck. J Natl Cancer Inst 2019;111:490-7. 10.1093/jnci/djy133 [DOI] [PMC free article] [PubMed] [Google Scholar]
- 15.Szturz P, Wouters K, Kiyota N, et al. Low-Dose vs. High-Dose Cisplatin: Lessons Learned From 59 Chemoradiotherapy Trials in Head and Neck Cancer. Front Oncol 2019;9:86. 10.3389/fonc.2019.00086 [DOI] [PMC free article] [PubMed] [Google Scholar]
- 16.Tsan DL, Lin CY, Kang CJ, et al. The comparison between weekly and three-weekly cisplatin delivered concurrently with radiotherapy for patients with postoperative high-risk squamous cell carcinoma of the oral cavity. Radiat Oncol 2012;7:215. 10.1186/1748-717X-7-215 [DOI] [PMC free article] [PubMed] [Google Scholar]
- 17.Noronha V, Joshi A, Patil VM, et al. Once-a-Week Versus Once-Every-3-Weeks Cisplatin Chemoradiation for Locally Advanced Head and Neck Cancer: A Phase III Randomized Noninferiority Trial. J Clin Oncol 2018;36:1064-72. 10.1200/JCO.2017.74.9457 [DOI] [PubMed] [Google Scholar]
- 18.Kunieda F, Kiyota N, Tahara M, et al. Randomized phase II/III trial of post-operative chemoradiotherapy comparing 3-weekly cisplatin with weekly cisplatin in high-risk patients with squamous cell carcinoma of head and neck: Japan Clinical Oncology Group Study (JCOG1008). Jpn J Clin Oncol 2014;44:770-4. 10.1093/jjco/hyu067 [DOI] [PubMed] [Google Scholar]
- 19.Bonner JA, Harari PM, Giralt J, et al. Radiotherapy plus cetuximab for squamous-cell carcinoma of the head and neck. N Engl J Med 2006;354:567-78. 10.1056/NEJMoa053422 [DOI] [PubMed] [Google Scholar]
- 20.Gillison ML, Trotti AM, Harris J, et al. Radiotherapy plus cetuximab or cisplatin in human papillomavirus-positive oropharyngeal cancer (NRG Oncology RTOG 1016): a randomised, multicentre, non-inferiority trial. Lancet 2019;393:40-50. 10.1016/S0140-6736(18)32779-X [DOI] [PMC free article] [PubMed] [Google Scholar]
- 21.Mehanna H, Robinson M, Hartley A, et al. Radiotherapy plus cisplatin or cetuximab in low-risk human papillomavirus-positive oropharyngeal cancer (De-ESCALaTE HPV): an open-label randomised controlled phase 3 trial. Lancet 2019;393:51-60. 10.1016/S0140-6736(18)32752-1 [DOI] [PMC free article] [PubMed] [Google Scholar]
- 22.Shapiro LQ, Sherman EJ, Riaz N, et al. Efficacy of concurrent cetuximab vs. 5-fluorouracil/carboplatin or high-dose cisplatin with intensity-modulated radiation therapy (IMRT) for locally-advanced head and neck cancer (LAHNSCC). Oral Oncol 2014;50:947-55. 10.1016/j.oraloncology.2014.07.001 [DOI] [PMC free article] [PubMed] [Google Scholar]
- 23.Denis F, Garaud P, Bardet E, et al. Final results of the 94-01 French Head and Neck Oncology and Radiotherapy Group randomized trial comparing radiotherapy alone with concomitant radiochemotherapy in advanced-stage oropharynx carcinoma. J Clin Oncol 2004;22:69-76. 10.1200/JCO.2004.08.021 [DOI] [PubMed] [Google Scholar]
- 24.Tao Y, Auperin A, Sun XS, et al. Avelumab-cetuximab-radiotherapy (RT) versus standards of care (SoC) in locally advanced squamous cell carcinoma of the head and neck (SCCHN): safety phase of the randomized trial GORTEC 2017-01 (REACH). J Clin Oncol 2018;36:6076. 10.1200/JCO.2018.36.15_suppl.6076 [DOI] [PubMed] [Google Scholar]
- 25.Wolf GT, Fisher SG, Hong WK, et al. Induction chemotherapy plus radiation compared with surgery plus radiation in patients with advanced laryngeal cancer. N Engl J Med 1991;324:1685-90. 10.1056/NEJM199106133242402 [DOI] [PubMed] [Google Scholar]
- 26.Lefebvre JL, Chevalier D, Luboinski B, et al. Larynx preservation in pyriform sinus cancer: preliminary results of a European Organization for Research and Treatment of Cancer phase III trial. EORTC Head and Neck Cancer Cooperative Group. J Natl Cancer Inst 1996;88:890-9. 10.1093/jnci/88.13.890 [DOI] [PubMed] [Google Scholar]
- 27.Haddad R, O’Neill A, Rabinowits G, et al. Induction chemotherapy followed by concurrent chemoradiotherapy (sequential chemoradiotherapy) versus concurrent chemoradiotherapy alone in locally advanced head and neck cancer (PARADIGM): A randomised phase 3 trial. Lancet Oncol 2013;14:257-64. 10.1016/S1470-2045(13)70011-1 [DOI] [PubMed] [Google Scholar]
- 28.Cohen EE, Karrison TG, Kocherginsky M, et al. Phase III randomized trial of induction chemotherapy in patients with N2 or N3 locally advanced head and neck cancer. J Clin Oncol 2014;32:2735-43. 10.1200/JCO.2013.54.6309 [DOI] [PMC free article] [PubMed] [Google Scholar]
- 29.Austin PC. Optimal caliper widths for propensity-score matching when estimating differences in means and differences in proportions in observational studies. Pharm Stat 2011;10:150-61. 10.1002/pst.433 [DOI] [PMC free article] [PubMed] [Google Scholar]
- 30.Ghi MG, Paccagnella A, Ferrari D, et al. Concomitant chemoradiation (CRT) or cetuximab/RT (CET/RT) versus induction docetaxel/ cisplatin/5-fluorouracil (TPF) followed by CRT or CET/RT in patients with locally advanced squamous cell carcinoma of head and neck (LASCCHN). A randomized phase III factorial study (NCT01086826). J Clin Oncol 2014;32:6004. 10.1200/jco.2014.32.15_suppl.6004 [DOI] [Google Scholar]
- 31.Stokes WA, Amini A, Jones BL, et al. Survival impact of induction chemotherapy in advanced head and neck cancer: a national cancer database analysis. Head Neck 2017;39:1113-21. 10.1002/hed.24739 [DOI] [PubMed] [Google Scholar]
- 32.Chen JH, Yen YC, Liu SH, et al. Outcomes of Induction Chemotherapy for Head and Neck Cancer Patients: A Combined Study of Two National Cohorts in Taiwan. Medicine (Baltimore) 2016;95:e2845. 10.1097/MD.0000000000002845 [DOI] [PMC free article] [PubMed] [Google Scholar]
- 33.Ock CY, Keam B, Lim Y, et al. Effect of induction chemotherapy on survival in locally advanced head and neck squamous cell carcinoma treated with concurrent chemoradiotherapy: single center experience. Head Neck 2016;38:277-84. 10.1002/hed.23891 [DOI] [PubMed] [Google Scholar]
- 34.Merlano M. (2009). Induction Chemotherapy Followed by Cetuximab Plus Definitive Radiotherapy Versus Radiation Plus Cisplatin (INTERCEPTOR). Identification No. NCT00999700. Available online: https://clinicaltrials.gov/ct2/show/NCT00999700
- 35.Yang Q, Cao SM, Guo L, et al. Induction chemotherapy followed by concurrent chemoradiotherapy versus concurrent chemoradiotherapy alone in locoregionally advanced nasopharyngeal carcinoma: long-term results of a phase III multicentre randomised controlled trial. Eur J Cancer 2019;119:87-96. 10.1016/j.ejca.2019.07.007 [DOI] [PubMed] [Google Scholar]
- 36.Zhang Y, Chen L, Hu GQ, et al. Gemcitabine and cisplatin induction chemotherapy in nasopharyngeal carcinoma. N Engl J Med 2019;381:1124-35. 10.1056/NEJMoa1905287 [DOI] [PubMed] [Google Scholar]
- 37.Platek AJ, Jayaprakash V, Merzianu M, et al. Smoking cessation is associated with improved survival in oropharynx cancer treated by chemoradiation. Laryngoscope 2016;126:2733-8. 10.1002/lary.26083 [DOI] [PMC free article] [PubMed] [Google Scholar]
- 38.DeGraaff LH, Platek AJ, Iovoli AJ, et al. The effect of time between diagnosis and initiation of treatment on outcomes in patients with head and neck squamous cell carcinoma. Oral Oncol 2019;96:148-52. 10.1016/j.oraloncology.2019.07.021 [DOI] [PMC free article] [PubMed] [Google Scholar]
Associated Data
This section collects any data citations, data availability statements, or supplementary materials included in this article.
Supplementary Materials
The article’s supplementary files as