Abstract
A colorimetric indicator displacement assay (IDA) amenable to high-throughput experimentation was developed to determine the percentage of cis- and trans-alkenes. Using 96-well plates two steps are performed: a reaction plate for dihydroxylation of the alkenes followed by an IDA screening plate consisting of an indicator and a boronic acid. The dihydroxylation generates either erythro or threo vicinal diols from cis- or trans-alkenes depending upon their syn- or anti-addition mechanisms. Threo diols preferentially associate with the boronic acid due to the creation of more stable boronate esters, thus displacing the indicator to a greater extent. The generality of the protocol was demonstrated using seven sets of cis- and trans-alkenes. Further, blind mixtures of cis- and trans-alkenes were made resulting in an average error of ±2% in the percentage of cis- or trans-alkenes, and implementing E2 and Wittig reactions gave errors of ±3%. Furthermore, we developed variants of the IDA that alter the color changes to optimize the response to the human eye.
Keywords: high-throughput screening, host-guest systems, alkene stereochemistry, dihydroxylation, colorimetric assays
Graphical Abstract
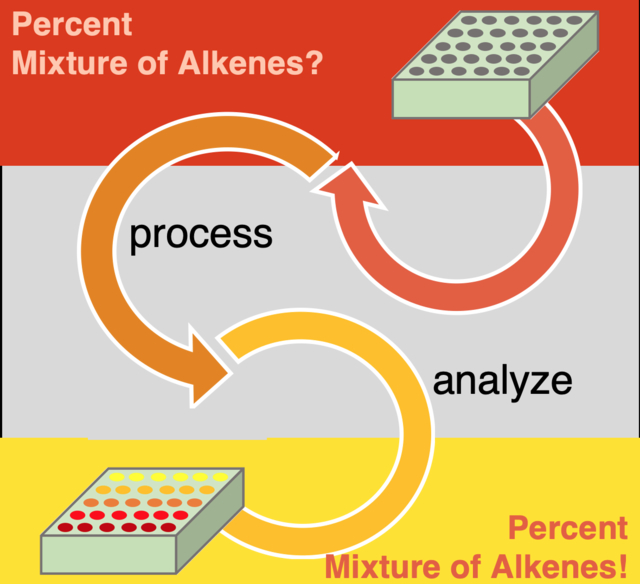
A high-throughput protocol was developed using a colorimetric indicator displacement assay (IDA) that quantifies the percent cis- and trans-alkenes present within mixtures of varying provenance to an accuracy of 2–3%. Within a series of 96-well plates, our protocol dihydroxylates alkenes, and the resulting diols used in an IDA which takes advantage of a catechol-containing indicator and a boronic acid to determine the amount of threo and/or erythro vicinal diols present. Color-tuning the IDA to suit one’s eye is also demonstrated.
Optical methods for the rapid screening of enantiomeric excess (ee),1 and in some cases diastereomeric ratio (dr),2 of stereocenters generated by point-chirality have come to the forefront of high-throughput reaction screening procedures. These optical assays have the goal of lowering the dependence on serial high-performance liquid chromatography (HPLC) and/or nuclear magnetic resonance (NMR) spectroscopy analyses when examining reactions in parallel. However, no optical methods have yet been created for alkene stereochemistry determination. The most common approach to determine alkene stereochemistry is to use 1H-NMR coupling constants or known chemical shifts.3 In other instances, some form of chromatography can be utilized when reference samples are available.4 In rare cases, reaction-based methods have been reported. For example, Brown and Moerikofer5 were able to differentiate between cis- and trans-alkenes by their rate of hydroboration. In a related endeavor, Li and colleagues6 exploited m-chloroperoxybenzoic acid (m-CPBA) to epoxidize unsaturated lipids to identify the location of an olefin, but the method was unable to differentiate stereochemistry.
Osmium tetroxide (OsO4) is a widely used reagent to dihydroxylate alkenes generating vicinal-diols.7 Under Upjohn conditions, catalytic amounts of OsO4 can be used to transform alkenes into their respective diols via syn-addition.8 The alkene first undergoes a [3+2] cycloaddition with OsO4 to form an osmate ester, which is readily hydrolyzed in aqueous systems, commonly yielding the vicinal-diol in nearly quantitative yields.9 In contrast, epoxidation of alkenes using m-CPBA followed by ring opening results in the opposite stereochemistry (i.e. anti-addition).10 Thus, by choice of oxidant one can control which diasteromeric diol is created.
While a few host-guest complexes with alkenes as guests have been reported,11 we postulated that dihydroxylation of an alkene would be an attractive in-situ derivatization technique to convert an alkene to a functionality, i.e. a vicinal-diol, that is more amenable to molecular recognition than an alkene. For example, vicinal-diols are well-known to reversibly bind with boronic acids to generate boronate esters, and many groups have used this equilibrium to create chemosensors for carbohydrates.12
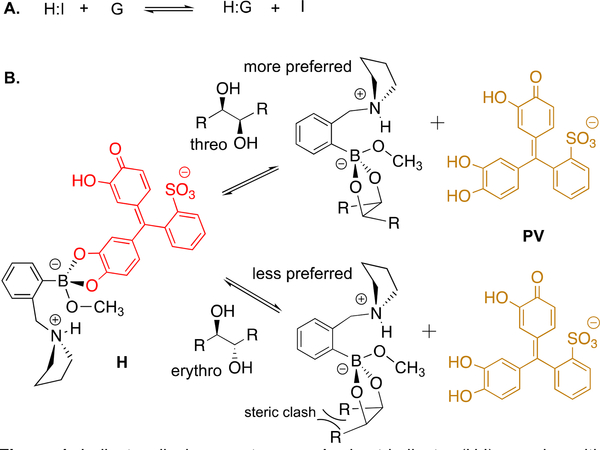
Previously, our group used the equilibrium between diols and boronic acids to create colorimetric assays that report the ee of chiral diols and α−hydroxycarboxylic acids.13 Using a chiral boronic acid host, these studies exploited an indicator displacement assay (IDA) to generate different colors for the enantiomeric diols. An IDA uses a colorimetric or fluorescent probe, often a pH indicator (I), that has a different optical signal when bound to a host (H) than when free in solution.14 As shown in Figure 1A, addition of a guest (G) leads to displacement of the indicator, whose optical signal in turn changes.
Figure 1.
Indicator displacement assay. A. host-indicator (H:I) complex with guest (G) equilibria. B. representative threo and erythro diol IDA using pyrocatechol violet (PV) as the indicator and 2-pyrrolidinylmethyl-phenylboronic acid (H) as the host.
We sought to exploit the dihydroxylation of alkenes using OsO4 or m-CPBA and an IDA to determine the percentage of cis- or trans-alkenes in unknown mixtures or from various reactions. Using 2-pyrrolidinylmethyl-phenylboronic acid as the host (H) and pyrocatechol violet as the indicator (PV), the resulting 1,2-diols would displace the indicator from the host-indicator complex thereby imparting color changes. Critical to our design was the hypothesis that the diastereomeric diols generated in a stereospecific fashion from the cis- and trans-alkenes would have different affinities for H. Dihydroxylation of a cis-alkene using OsO4 results in an erythro diol, which was anticipated to not favor the host-guest complexation due to steric interactions when the R-groups are cis to each other in the cyclic boronate ester (Figure 1B). In contrast, when using OsO4 a trans-alkene would give a threo diol, which places the R-groups trans to one another in the formation of the boronate ester. Thus, trans-alkenes were anticipated to have larger affinities of their corresponding diols than cis-alkenes, thereby leading to greater displacement of the indicator from the host and in turn larger color changes (Figure 1B). The use of m-CPBA as the oxidant was anticipated to result in the opposite response to diols derived from cis- and trans-alkenes.
Prior to developing the IDA protocol depicted in Figure 1, we turned to 11B NMR spectroscopy to verify that H preferentially binds with threo diols when in competition with erythro diols. Using d,l and meso-2,3-butanediol as the guests and H (2:1 guest:H, 40 mM H, MeOH-d4), the H boronate center has a chemical shift of 8.07 ppm. When meso-butanediol (erythro) was introduced to H a new boronate ester resonance emerged downfield at 10.95 ppm, however, the resonance at 8.07 ppm was the dominate peak (Figure S1). In contrast, upon addition of d,l-butanediol (threo) to H the formation of the boronate ester shifted downfield to 10.44 ppm with no remaining peak at 8.07 ppm (Figure S1). When both d,l- and meso-butanediol were allowed to compete for H a chemical shift at 10.44 ppm was found, with no signals at 10.95 or 8.07 ppm for the erythro-diol:H complex and H, respectively. Additional studies using G3TH and G3ER (Table 1) (1:1 guest:H, 40 mM H, 1:1 MeOH-d4/MeCN-d3) further supported that H preferentially binds with threo-diols in the presence of erythro-diols (Figure S2). These studies support our hypothesis that due to the steric interactions shown in Figure 1B, threo-diols have a higher affinity for H compared to erythro-diols.
Table 1.
The binding constants, KH:G, determined through UV-Vis titration and Os-reaction scheme for the threo and erythro diols.
| Set | trans-alkene | cis-alkene | threo diol | erythro diol |
|---|---|---|---|---|
| 1: R1, R2 = CH3 | G1T | G1C | G1TH | G1ER |
| KH:G[a] | — | — | 0.348 | 0.057 |
| 2: R1, R2 = Ph | G2T | G2C | G2TH | G2ER |
| KH:G[a] | — | — | 11.1 | [b] |
| 3: R1 = (CH2)7CH3 R2 = (CH2)7COOCH3 |
G3T | G3C | G3TH | G3ER |
| KH:G[a] | — | — | 1.38 | [b] |
| 4: R1, R2 = (CH2)2CH3 | G4T | G4C | G4TH | G4ER |
| KH:G[a] | — | — | 1.10 | 0.16 |
| 5: R1 = CH3 R2 = (CH2)2CH3 |
G5T | G5C | G5TH | G5ER |
| KH:G[a] | — | — | 2.64[c] | 0.29[c] |
| 6: R1, R2 = CH(CH3)2 | G6T | G6C | G6TH | G6ER |
| KH:G[a] | — | — | 3.72 | [b] |
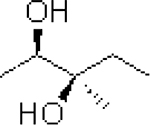
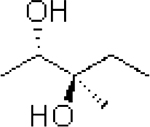
| 7: |  |
 |
 |
 |
| G7T | G7C | G7TH | G7ER | |
| KH:G[a] | — | — | 1.41[c] | 0.41 [c] |
 | ||||
103 M−1
negligible measurement
binding constants determined using the 96-well plate, see supplementary information.
The indicator chosen for the IDA was pyrocatechol violet (PV) based upon our previous work for determining the ee of chiral diols.15 To optimize the IDA protocol for the diols derived from alkenes, solvent conditions were first screened. A solvent system of methanol and acetonitrile (1:1, pH 8.4 buffered with para-toluenesulfonic acid and Hünig’s base) yielded the largest shift in absorbance spectra of PV upon binding with H (Figure S3). The slightly alkaline pH value for the IDA was selected based upon the pKa values for ortho-amino substituted boronic acids in analogous protic solvents because binding is known to be enhanced by pHs at or above the pKa values.16 Using these conditions, a UV-Vis spectrophotometric titration of PV with H was implemented to determine the binding constant (KH:PV = 17.1 × 10³ M−1, Figure S4) and the optimal concentration of the host and indicator for a subsequent IDA (Figure 2). The concentrations of PV (0.15 mM) and H (0.4mM) were chosen because the indicator is approximately 90% saturated with host, and thus would give a large dynamic range in the reversal of the signal upon addition of diols generated from alkenes.
Figure 2.
A. UV-Vis titration of host, H, into indicator PV (0.15 mM). The inset shows the change in absorbance at 520 nm with the addition of H. [Ht] is the host total concentration. B. Representative IDA UV-Vis titration using G2TH. C. Representative IDA UV-Vis titration using G2ER. D. The difference in absorbance at 520 nm with the addition of G2TH and G2ER, blue represents G2ER, orange represents G2TH. [Gt], total guest concentration. KH:G2ER, binding constant for host H is negligible and KH:G2TH, binding constant with H is 11.1 (103 M−1). All IDA’s were analyzed in methanol and acetonitrile (v/v = 1:1, 25 °C, pH 8.4 buffered with 10 mM para-toluenesulfonic acid and Hünig’s base).
To test the generality of the anticipated preference for threo diols, seven sets of isomeric alkenes (Table 1) were subjected to OsO4, under Upjohn conditions, as a synthetic route to generate both threo and erythro diols. Trans-alkenes (or E) give threo diols whereas cis-alkenes (or Z) lead to erythro diols. Using these diols, UV-Vis titration studies were conducted using H and PV to determine their binding constants using fitting procedures appropriate for IDAs (Figure 2).17 The erythro diols G2ER, G3ER, and G6ER gave minimal signal changes in the IDA, and hence their binding constants were negligible. While G1ER and G4ER did give signals that were amenable to measuring binding with H, the binding constants were approximately seven times smaller than the respective threo diol counterparts. Importantly, as revealed by examination of the binding constants in Table 1, the threo diol consistently has a stronger affinity to H compared to the erythro diol for each starting alkene set, further confirming our design hypothesis.
As a specific example, the UV-Vis spectrophotometric titrations using G2TH and G2ER shown in Figures 2B and 2C reveal the preferential binding of G2TH. Figure 2D shows the dramatic difference in the two IDA isotherms (analogous plots for the other diol sets are shown in the Supplementary Information Figures S5-S10). Further, one visually notices the solution turn from red to yellow as G2TH displaces the indicator from the host. In contrast, for G2ER no visible color change occurs (look ahead to Figure 4).
Figure 4.
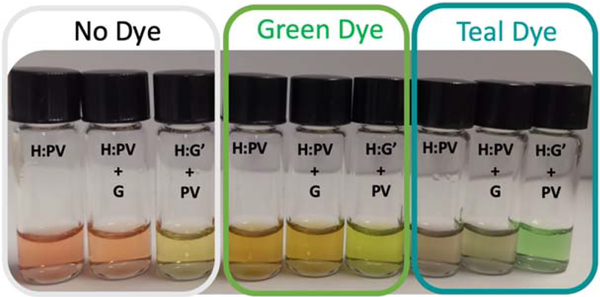
Colorimetric IDA Preference. No dye: No inert dye was added, Green Wilton food coloring: 25 μL of green dye was added, and teal dye: where 25 μL of each dye was added. H:PV host-indicator complex, H:G’ is the host-threo diol complex. While G is representative of the erythro diol.
To prepare for the two-step protocol that would involve oxidation using OsO4 or m-CPBA (assuming near quantitative yields9,10) in reactions plates followed by IDAs in screening plates, we set out to determine the concentrations for the different diol sets that would give the largest differences in colors. For example, using the G2TH/G2ER set, the absorbances were determined at 520 nm for different concentrations (Figure S16). The optimal concentration for this diol set was determined to be 10 mM, translating to 10 mM for the G2T/G2C set. For other alkene sets, different concentrations were used (Figures S17-S22).
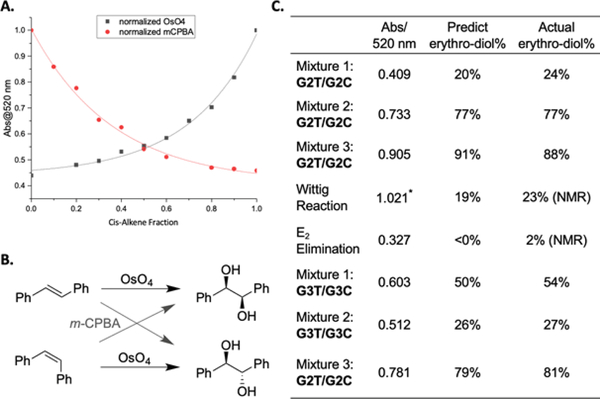
For demonstration purposes we focused our testing of the two-step protocol on only the G2T/G2C and G3T/G3C sets. G3 is a fatty acid ester and is therefore of particular interest for lipid analysis. All of the analyses were conducted in triplicates. Prior to the analysis of unknowns and reactions, calibration curves were generated using varying mixtures of each set of alkenes, ranging from 0:100 cis-alkene/trans-alkene to 100:0 cis-alkene/trans-alkene in increments of 10. For each alkene, the calibration curves were not linear, but instead had a distinct curvature (Figure 3A and Supplementary Information Figure S12). At high percentages of threo diols, as created from OsO4 with trans-alkenes, the dynamic range of the IDA was large, while changes in the percentages of threo diol in an excess of erythro diol showed small optical changes. This is as expected, because the erythro diol does not displace the indicator, and not until there is a large enough fraction of threo diol in the mixture (above ~0.5) does a significant optical response occur.
Figure 3.
A. Representative IDA UV-vis plate reader calibration curves (520 nm) from screening plates consisting of G2T and G2C at 10 mM using OsO4 (black) or m-CPBA (red). B. Comparison of the different stereospecifities of OsO4 and m-CPBA. C. First column: The UV-vis plate reader data at 520 nm of the G2T/G2C blinds and Wittig and E2 reactions, as well as G3T/G3C blinds. Second column: The predicted % trans-alkene written as % erythro-diol from oxidation with OsO4 using the black calibration curve in part A. Third column: The actual percent G2T, written again as % erythro-diol, for the blinds and the Wittig and E2 reactions (determined by 1H-NMR spectroscopy). See Figure S12 for the relevant titration curve for G3T/G3C. *See Figure S24 for relevant calibration curve.
To explore the diastereoselectivity of the two-step protocol the dihydroxylation of G2T and G2C was carried out using m-CPBA followed by ring opening using KOH (Figure 3A, red line). As would be expected from the opposing stereospecificity of OsO4 and m-CPBA oxidations, the two calibration curves are mirror images across a vertical line at 0.5 fraction of erythro diol. Thus, to generate a large enough percentage of threo diols for a significant optical response, the proper oxidant needs to be chosen based upon the stereochemistry of the alkene.
We next developed a two-step protocol using two 96 well-plates. We chose OsO4 as the oxidant and G2T/G2C and G3T/G3C as the alkenes (10 and 30 mM respectively). After OsO4 oxidation, the wells of the reaction plate were quenched with sodium bisulfite and the solutions transferred to and filtered through silica containing 96-well fritted plates to purify the Os-products from NaHSO3 other byproducts. The solvent was removed using a Genevac, and the residues were re-dissolved and transferred to the screening plate containing H and PV. A blank sample that lacked only the presence of an alkene was subjected to the procedural protocol to serve as a control sample. The control sample confirmed our procedures lacked an absorbance representative of an alkene in the IDA. Furthermore, the control verified our procedures properly removed byproducts during the silica purification steps, showing the absence of residual Os-products. The absorbance of each sample was measured at 520 nm in a UV-Vis plate reader and could be correlated to the percentage of trans alkene using the calibration curve in Figure 3A (black line).
Three “blind” mixtures of G2T/G2C, as well as synthetically derived mixtures of G2T/G2C from a Wittig and E2 reaction were analyzed. The blind mixtures were made by one of the authors and analyzed by a different author without prior knowledge of the percentage of G2T. The percentages of G2T from the Wittig and E2 reaction mixtures were verified via 1H-NMR spectroscopy (see the Supplementary Information). The calibration curve predicted the G2T content in the unknowns to be 20%, 77%, and 91% erythro-diol, respectively (Figure 3C), with an average absolute error of ±2% from the actual values. Additionally, the Wittig and E2 reaction mixtures were predicted to have 19% and ~0% G2T. When verified via 1H-NMR spectroscopy the absolute error for the reaction mixtures was ±3%. As further verification of the two-step protocol, three blind mixtures of G3T and G3C were generated and taken through the two-step protocol. These were analyzed and determined to be 50%, 26%, and 79% G3T with an absolute error of ±2% from the actual values (Figure 3C).
We also set out to change the visual color of the solutions containing the host-indicator complex and the liberated free indicator. This allows one to create several different sets of color pairings that may be better suited for one’s eye (Figure 4) such that a quick inspection of the color would indicate the predominate alkene stereochemistry within a mixture. Mixing fluorescent indicators have previously been found to optimize sensitivities to pH changes.18 It is well known that each human has a slightly different ability to distinguish colors.19 As shown in Figure 4, without an inert food color dye the host-indicator complex (H:PV) is red. Addition of a green dye (Wilton food colorings for cakes and icings) makes the solutions orange and addition of a teal dye gives a grey solution. Upon addition of an erythro diol (H:PV + G2ER) the solutions retain their original colors. However, upon addition of the threo diol (H:PV + G2TH) the solutions turn from burnt red to yellow, orange to lime green, and gray to bright green, respectively (Figure 4). The different colorimetric responses were accomplished with no additional synthesis and can be tuned to alter the appearance of the IDA to best suit one’s eye. Interestingly, for the authors, most felt the teal background dye gave the most obvious response to the erythro diol, but for others, different colors were optimal.
In conclusion, we have reported the first optical approach for determining the percentage of cis- and trans-alkenes that is amenable to a high-throughput workflow. We successfully used two synthetic techniques to dihydroxylate alkenes, with opposite stereospecificity, in 96-well plates. The resulting diastereomeric 1,2-diols were analyzed using an IDA via UV-Vis spectroscopy in 96-well plates to determine the percent trans or cis alkene. We were successful at determining the percentage of blind mixtures of alkenes, as well as two reactions as unknowns, with an average error consistently less than ±3%. Further, we explored the general utility of an IDA to impart different colors for the alkenes with no additional synthetic effort. This study gives chemists another tool to determine the percentage of cis- and trans-alkenes, one that is amenable to a high throughput experimentation workflow because of the use of parallel analysis in plates instead of the use of serial NMR spectroscopy or chromatography.
Supplementary Material
Acknowledgements
We would like to thank the Brodbelt research group, University of Texas at Austin, for inspiring our group to tackle this challenge. For this project, S.A.V. was funded primarily through the NSF Graduate Research Fellowship Program: DGE-1610403. Additionally, we would like to thank and recognize the University of Texas at Austin’s Mass Spectrometry Facility for their help and the NMR facilities for Bruker AVANCE III 500: NIH Grant Number 1 S10 OD021508-01. This project was primarily funded through the NSF GOALI Grant Number: 1665040. Further, E.V.A. recognizes support from the Welch Regents Chair (1-0046). We would like to acknowledge the Department of Employment and Learning of Northern Ireland and China Scholarship Council. The authors would like to recognize Queen’s University Belfast and Professor P. Nockemann for their contributions with this collaboration.
Footnotes
Supporting information for this article is given via a link at the end of the document.
References:
- [1].Herrera BT; Pilicer SL; Anslyn EV; Joyce LA; Wolf CJ Am. Chem. Soc. 2018, 140, 10385–10401. [DOI] [PubMed] [Google Scholar]
- [2] a).Herrera BT; Moor SR; McVeigh M; Roesner EK Marini F; Anslyn EV J. Am. Chem. Soc. 2019, 141, 11151–11160. [DOI] [PMC free article] [PubMed] [Google Scholar]; b) De los Santos ZA; MacAvaney S; Russell K; Wolf C Angew. Chem. Int. Ed. 2020, 59, 2440–2448. [DOI] [PubMed] [Google Scholar]
- [3] a).Chi Y; Peelen TJ Org. Lett. 2005, 7, 3469–3472. [DOI] [PubMed] [Google Scholar]; b) Iwaniuk DP; Wolf CJ Org. Chem. 2010, 75, 6724–6727. [DOI] [PubMed] [Google Scholar]; c) Shundo A; Labuta J; Hill JP; Ishihara S; Ariga KJ Am. Chem. Soc. 2009, 131, 9494–9495. [DOI] [PubMed] [Google Scholar]; d) Brittain WDG; Chapin BM; Zhai W; Lynch VM; Buckley BR; Anslyn EV; Fossey JS Org. Biomol. Chem. 2016, 14, 10778–10782. [DOI] [PMC free article] [PubMed] [Google Scholar]
- [4] a).Ebinger K; Weller HN J. Chromatogr. A 2013, 1272, 150–154. [DOI] [PubMed] [Google Scholar]; b) Joshi N; Dhamarlapati B; Pillai A; Paulose J; Tan J; Blue LE; Tedrow J; Farrell BJ Chromatogr. A 2018, 1538, 108–111. [DOI] [PubMed] [Google Scholar]
- [5].Brown HC; Moerikofer AW J. Amer. Chem. Soc. 1962, 85, 2063–2065. [Google Scholar]
- [6].Feng Y; Chen B; Yu Q; Li L Anal. Chem. 2019, 91, 1791–1795. [DOI] [PMC free article] [PubMed] [Google Scholar]
- [7] a).Sharpless KB; Akashi KJ Am. Chem. Soc. 1976, 98, 1986–1987; [Google Scholar]; b) Lemieux-Johnson Oxidation: Pappo R; Allen DS Jr.; Lemieux RU; Johnson WS J. Org. Chem. 1956, 21, 478–479; [Google Scholar]; c) Cha JK; Kim N-S Chem. Rev. 1995, 95, 1761–1795; [Google Scholar]; d) Francais A; Bedel O; Haudrechy A Tetrahedron 2008, 64, 2495–2524.; [Google Scholar]; e) Eames J; Mitchell H; Nelson A; O’Brien P; Warren S; Wyatt PJ Chem. Soc. Perkin Trans. 1 1999, 1095–1104. [Google Scholar]
- [8] a).Milas NA; Sussman SJ Am. Chem. Soc. 1936, 58,1302–1304. [Google Scholar]; b) VanRheenen V; Kelly RC; Cha DY Terahedron Lett. 1976, 17, 1973–1976. [Google Scholar]
- [9].Pidun U; Boehme C; Frenking G Angew. Chem. Int. Ed. Engl. 1996, 35, 2817–2820. [Google Scholar]
- [10] a).Schwartz NN; Blumbergs JH J. Org. Chem. 1964, 29, 1976–1979. [Google Scholar]; b) Ruano GJL; Fajardo C; Fraile A; Martín RM; J. Org. Chem. 2005, 70, 4300–4305. [DOI] [PubMed] [Google Scholar]
- [11] a).Esser B; Schnorr JM; Swager TM; Angew. Chem. Int. Ed. 2012, 51, 5752–5756. [DOI] [PubMed] [Google Scholar]; b) Fong D; Luo SX; Andre RS; Swager TM ACS Cent. Sci. 2020, 6, 507–512. [DOI] [PMC free article] [PubMed] [Google Scholar]; c) Pow RW; Xuan W; Long DL; Bell NL; Cronin L Chem. Sci. 2020, 11, 2388–2393. [DOI] [PMC free article] [PubMed] [Google Scholar]
- [12] a).Springsteen G; Wang B Tet. 2002, 58, 5291–5300. [Google Scholar]; b) Sun X; Chapin BM; Metola P; Collins B; Wang B; James TD; Anslyn EV Nat. Chem. 2019, 11, 769–778. [DOI] [PMC free article] [PubMed] [Google Scholar]; c) Suzuki Y; Ikeda A; Ohno K; Fujihara T; Sugaya T; Ishihara KJ Org. Chem. 2020, 85, 9680–9693. [DOI] [PubMed] [Google Scholar]; d) Bull SD; Davidson MG; van den Elsen JNH; Fossey JS; Jenkins TA; Jiang YB; Kubo Y; Marken F; Sakurai K; Zhao J; James TD Acc. Chem. Res. 2013, 46, 312–326. [DOI] [PubMed] [Google Scholar]; e) Zhai W; Sun X; James TD; Fossey JS Chem. Asian. J. 2015, 10, 1836–1848. [DOI] [PubMed] [Google Scholar]
- [13] a).Zhu L; Zhong Z; Anslyn EV J. Am. Chem. Soc. 2005, 127, 4260–4269. [DOI] [PubMed] [Google Scholar]; b) Shabbir SH; Clinton RJ; Anslyn EV Proc. Natl. Acad. Sci. 2009, 106, 10487–10492. [DOI] [PMC free article] [PubMed] [Google Scholar]
- [14] a).Dsouza RN; Pischel U; Nau WM Chem. Rev. 2011, 111, 7941–7980. [DOI] [PubMed] [Google Scholar]; b) Santos-Figueroa LE; Moragues ME; Climent E; Agostini A; Martínez-Máñez R; Sancenón F Chem. Soc. Rev. 2013, 42, 3489–3613. [DOI] [PubMed] [Google Scholar]
- [15] a).Zhu L; Zhong Z; Anslyn EV J. Am. Chem. Soc. 2005, 127, 4260–4269. [DOI] [PubMed] [Google Scholar]; b) Shabbir SH; Clinton RJ; Anslyn EV Proc. Natl. Acad. Sci. 2009, 106, 10487–10492. [DOI] [PMC free article] [PubMed] [Google Scholar]
- [16].Sun X; Chapin BM; Metola P; Collins B; Wang B; James TD; Anslyn EV Nat. Chem. 2019, 11, 768–778. [DOI] [PMC free article] [PubMed] [Google Scholar]
- [17].Connors KA (1987) Binding Constants, The Measurement of Molecular Complex Stability (Wiley, New York: ). pp. 141–168. [Google Scholar]
- [18].Gabor G; Walt DR Anal. Chem. 1991, 63, 793–796. [Google Scholar]
- [19] a).Neitz J; Neitz M; Jacobs GH Vis. Res. 1993, 33, 117–122. [DOI] [PubMed] [Google Scholar]; b) Endler JA Biol. J. Linn. Soc. 1990, 41, 315–352. [Google Scholar]
Associated Data
This section collects any data citations, data availability statements, or supplementary materials included in this article.


