Abstract
Long non‐coding RNA (lncRNA) is an important regulatory factor in the development of lung adenocarcinoma, which is related to the control of autophagy. LncRNA can also be used as a biomarker of prognosis in patients with lung adenocarcinoma. Therefore, it is important to determine the prognostic value of autophagy‐related lncRNA in lung adenocarcinoma. In this study, autophagy‐related mRNAs‐lncRNAs were screened from lung adenocarcinoma and a co‐expression network of autophagy‐related mRNAs‐lncRNAs was constructed by using The Cancer Genome Atlas (TCGA). The univariate and multivariate Cox proportional hazard analyses were used to evaluate the prognostic value of the autophagy‐related lncRNAs and finally obtained a survival model composed of 11 autophagy‐related lncRNAs. Through Kaplan‐Meier analysis, univariate and multivariate Cox regression analysis and time‐dependent receiver operating characteristic (ROC) curve analysis, it was further verified that the survival model was a new independent prognostic factor for patients with lung adenocarcinoma. In addition, based on the survival model, gene set enrichment analysis (GSEA) was used to illustrate the function of genes in low‐risk and high‐risk groups. These 11 lncRNAs were GAS6‐AS1, AC106047.1, AC010980.2, AL034397.3, NKILA, AL606489.1, HLA‐DQB1‐AS1, LINC01116, LINC01806, FAM83A‐AS1 and AC090559.1. The hazard ratio (HR) of the risk score was 1.256 (1.196‐1.320) (P < .001) in univariate Cox regression analysis and 1.215 (1.149‐1.286) (P < .001) in multivariate Cox regression analysis. And the AUC value of the risk score was 0.809. The 11 autophagy‐related lncRNA survival models had important predictive value for the prognosis of lung adenocarcinoma and may become clinical autophagy‐related therapeutic targets.
Keywords: autophagy, long non‐coding RNA (lncRNA), lung adenocarcinoma (LUAD), survival, The Cancer Genome Atlas (TCGA)
1. INTRODUCTION
Lung cancer is the cancer with the highest morbidity and mortality among cancers. 1 Lung adenocarcinoma (LUAD) is the most common pathological subtype of lung cancer, accounting for 45% of all lung cancer. 2 Despite the continuous progress in the technology of cancer diagnosis and treatment, the mortality rate of lung cancer remains high. One reason is that some patients are diagnosed with advanced lung cancer, and the other is that the existing guided staging system is not accurate in predicting the prognosis of lung cancer; as a result, some patients with early lung cancer did not receive adjuvant therapy after operation, which led to the recurrence or metastasis of lung cancer. 3 , 4 Therefore, it is necessary to update the staging system of the existing guidelines.
Autophagy is a highly conservative physiological process, which maintains the stability of the intracellular environment through the lysosome degradation system. 5 , 6 Autophagy plays an important role in many physiological processes, such as immune response, inflammation and tumorigenesis. 7 , 8 In the past few decades, there have been more and more studies on autophagy in LUAD. 9 , 10 Therefore, it is very important to establish an autophagy‐related gene set to predict the prognosis of LUAD.
Long non‐coding RNA (lncRNA) is a series of nucleotides with a length of more than 200 bp and does not have the ability to encode proteins. 11 LncRNA is involved in many steps in the process of cancer occurrence and development, so it may be used as a biomarker to predict the prognosis of cancer patients. 12 , 13 , 14 In addition, more and more studies have shown that in many cancers, lncRNA can promote the occurrence and development of tumours. 15 , 16 , 17 Therefore, it is very important to screen the autophagy lncRNA related to the prognosis of LUAD.
In this study, a data set of gene expression in LUAD from The Cancer Genome Atlas (TCGA) was analysed and autophagy‐related lncRNA was screened out. The autophagy‐related lncRNA signature was identified to predict the survival prognosis of LUAD patients.
2. METHODS AND MATERIALS
2.1. LUAD patient data
The clinical data and gene expression data of patients with LUAD were collected from TCGA database (https://cancergenome.nih.gov/). Among them, the gene expression data used the data that had been normalized. In this study, the data of 954 patients with LUAD were analysed. Excluding patients with duplicated and missing clinical information, a total of 316 patient data were used for follow‐up analysis.
2.2. Screening of autophagy‐related lncRNA in LUAD
A list of genes related to autophagy was obtained from the Human Autophagy Database (http://www.autophagy.lu/). A total of 210 autophagy‐related genes were obtained from the LUAD gene expression data. Finally, 1651 autophagy‐related lncRNAs were screened by constructing autophagy‐related mRNA‐lncRNA co‐expression network according to the following criteria: |Correlation Coefficient| > 0.4 and P < .001. 18 We used Pearson correlation analysis to perform the above analysis by limma R package.
2.3. Identification of autophagy‐related lncRNA prognostic signatures for LUAD
In order to identify the autophagy‐related lncRNA associated with survival, we conducted a univariate Cox proportional hazard analysis and Kaplan‐Meier analysis, and P < .01 was considered to be statistically significant. Then, the survival R package was used for multivariate Cox proportional hazard analysis, the optimal prognostic risk model was established, and the risk score was calculated by the following formula.
The LUAD patients were divided into two groups by the median risk score: high‐risk group and low‐risk group. We performed Kaplan‐Meier survival analysis to estimate the survival difference between the two groups by using the survival R packages.
2.4. ROC curve plotting and independent prognostic analysis
Univariate and multivariate Cox analyses were performed to evaluate relationship of survival prognosis with clinical factors and risk score by using the survival R package. In order to estimate the predictive accuracy for survival time by different clinical factors and risk score, time‐dependent receiver operating characteristic (ROC) curves were plotted by using the survivalROC R package.
2.5. Construction and calibration of nomogram
The R package rms was used to construct nomogram which contained risk scores and clinical factors such as age, gender and stage. The nomogram can be used to predict the probable 3‐year and 5‐year survival of LUAD patients. The R package survival was utilized to plot calibration curve of nomogram. The calibration curve can intuitively demonstrate prediction ability of nomogram.
2.6. Statistical analysis
We used R software (version 3.6.2) to perform all statistical analyses. The Sankey diagram and Cytoscape software were used to visualize prognostic autophagy‐associated lncRNA‐mRNA co‐expression network. The functional annotation was performed by using gene set enrichment analysis (GSEA, https://www.gsea‐msigdb.org/gsea/index.jsp). GSEA is an important gene annotation tool, 19 which can analyse and annotate the whole genetic data, thus avoiding the omission of key information. The P < .05 was considered to be statistically significant.
3. RESULTS
3.1. Autophagy‐related lncRNA with significant prognostic value in LUAD
Through the construction of autophagy‐related mRNA and lncRNA co‐expression network, a total of 1651 autophagy‐related lncRNAs were obtained. Among them, Cox proportional hazards analysis and Kaplan‐Meier analysis demonstrated that 33 autophagy‐related lncRNAs were significantly associated with the survival of LUAD patients from the TCGA (P < .01), including 23 lncRNAs with low risk (hazard ratio (HR)<1) and 10 lncRNAs with high risk (hazard ratio (HR)>1) (Table 1). Furthermore, multivariate Cox analysis screened 11 lncRNAs from the above 33 autophagy‐related lncRNAs with prognostic significance, and the names of 11 lncRNAs were GAS6‐AS1, AC106047.1, AC010980.2, AL034397.3, NKILA, AL606489.1, HLA‐DQB1‐AS1, LINC01116, LINC01806, FAM83A‐AS1 and AC090559.1 (Table 2). We used these 11 lncRNAs to establish the optimal prognostic risk model and established a prognostic visual co‐expression network of autophagy‐related lncRNA‐mRNA (Figure 1). According to the risk score formula, based on calculated median risk score, LUAD patients were divided into two groups: high‐risk group and low‐risk group. Meanwhile, according to the expression of 11 different lncRNAs, based on the calculated median expression, LUAD patients were divided into two groups: high expression group and low expression group. Kaplan‐Meier survival analysis showed that the overall survival (OS) of the high‐risk group was worse than that of the low‐risk group, indicating that risk score could predict the prognosis (Figure 2A). Similarly, the overall survival (OS) of the high expression group with high‐risk lncRNA was worse than that of the group with low expression (Figure 2B‐L). The risk score and the relevant survival statuses of LUAD patients were visualized by risk curve and scatterplot (Figure 3A,B), which demonstrated that the mortality occurrence depended on the risk score. The heatmap of these 11 autophagy‐related lncRNAs demonstrated that AC010980.2, NKILA, AL606489.1, LINC01116 and FAM83A‐AS1 were up‐regulated in the high‐risk group, while GAS6‐AS1, AC106047.1, AL034397.3, HLA‐DQB1‐AS1, LINC01806 and AC090559.1 were highly expressed in the low‐risk group (Figure 3C).
TABLE 1.
LncRNA univariate Cox regression analyses and KM analysis of OS in lung adenocarcinoma patients
| lncRNA | KM analysis | Univariate Cox regression analyses | |||
|---|---|---|---|---|---|
| KM P‐value | HR | HR 95 low | HR 95 high | P‐value | |
| GAS6‐AS1 | .0002 | 0.7767 | 0.6512 | 0.9265 | .0050 |
| UGDH‐AS1 | .0008 | 0.5991 | 0.4357 | 0.8236 | .0016 |
| MMP2‐AS1 | .0066 | 0.7832 | 0.6514 | 0.9418 | .0094 |
| AC106047.1 | .0057 | 0.6982 | 0.5362 | 0.9091 | .0076 |
| AC010980.2 | .0004 | 1.2306 | 1.0620 | 1.4260 | .0058 |
| AC099850.3 | .0092 | 1.0337 | 1.0112 | 1.0568 | .0031 |
| AC245595.1 | .0002 | 1.3306 | 1.1858 | 1.4931 | .0000 |
| AC021016.2 | .0035 | 0.6311 | 0.4617 | 0.8626 | .0039 |
| CARD8‐AS1 | .0095 | 0.8285 | 0.7184 | 0.9555 | .0097 |
| RPARP‐AS1 | .0030 | 0.8386 | 0.7471 | 0.9414 | .0028 |
| AC090559.1 | .0002 | 0.7948 | 0.6840 | 0.9235 | .0027 |
| AL034397.3 | .0002 | 0.7526 | 0.6220 | 0.9106 | .0035 |
| AC011477.2 | .0001 | 0.8287 | 0.7350 | 0.9344 | .0022 |
| AL691432.2 | .0002 | 0.8315 | 0.7520 | 0.9195 | .0003 |
| CRNDE | .0005 | 0.9521 | 0.9249 | 0.9801 | .0009 |
| AC008764.2 | .0073 | 0.8452 | 0.7602 | 0.9397 | .0019 |
| NKILA | .0054 | 1.1095 | 1.0578 | 1.1638 | .0000 |
| VIM‐AS1 | .0009 | 0.8167 | 0.7263 | 0.9184 | .0007 |
| AC019069.1 | .0021 | 1.2033 | 1.0699 | 1.3533 | .0020 |
| ITGB1‐DT | .0007 | 1.0427 | 1.0132 | 1.0730 | .0043 |
| AL161785.1 | .0011 | 0.8964 | 0.8316 | 0.9663 | .0043 |
| MGC32805 | .0088 | 0.8193 | 0.7092 | 0.9465 | .0068 |
| AL606489.1 | .0037 | 1.2531 | 1.1198 | 1.4024 | .0001 |
| AL137003.1 | .0023 | 0.7441 | 0.5978 | 0.9263 | .0082 |
| AC006449.6 | .0077 | 0.7465 | 0.6010 | 0.9271 | .0082 |
| AL365203.2 | .0002 | 1.2307 | 1.1373 | 1.3318 | .0000 |
| HLA‐DQB1‐AS1 | .0029 | 0.9243 | 0.8881 | 0.9621 | .0001 |
| LINC01116 | .0069 | 1.1063 | 1.0718 | 1.1419 | .0000 |
| LINC01806 | .0057 | 0.8766 | 0.7987 | 0.9620 | .0055 |
| LINC00324 | .0022 | 0.7842 | 0.6580 | 0.9346 | .0066 |
| FAM83A‐AS1 | .0004 | 1.0469 | 1.0279 | 1.0661 | .0000 |
| AC087752.3 | .0005 | 0.6885 | 0.5256 | 0.9020 | .0068 |
| AL035587.1 | .0044 | 0.6665 | 0.5015 | 0.8856 | .0052 |
TABLE 2.
LncRNA multivariate Cox regression analyses of OS in lung adenocarcinoma patients
| lncRNA | Coef | HR | P‐value | PH P‐value |
|---|---|---|---|---|
| GAS6‐AS1 | −0.141 | 0.868 | .000 | .311 |
| AC106047.1 | −0.280 | 0.756 | .003 | .209 |
| AC010980.2 | 0.181 | 1.199 | .006 | .113 |
| AL034397.3 | −0.186 | 0.830 | .008 | .024 |
| NKILA | 0.080 | 1.083 | .005 | .276 |
| AL606489.1 | 0.167 | 1.182 | .000 | .517 |
| HLA‐DQB1‐AS1 | −0.043 | 0.958 | .000 | .395 |
| LINC01116 | 0.061 | 1.063 | .000 | .989 |
| LINC01806 | −0.167 | 0.846 | .006 | .617 |
| FAM83A‐AS1 | 0.031 | 1.031 | .000 | .127 |
| AC090559.1 | −0.142 | 0.868 | .003 | .338 |
Global PH P‐value was .105; thus, the Cox regression model can be used to construct the predictive model.
FIGURE 1.
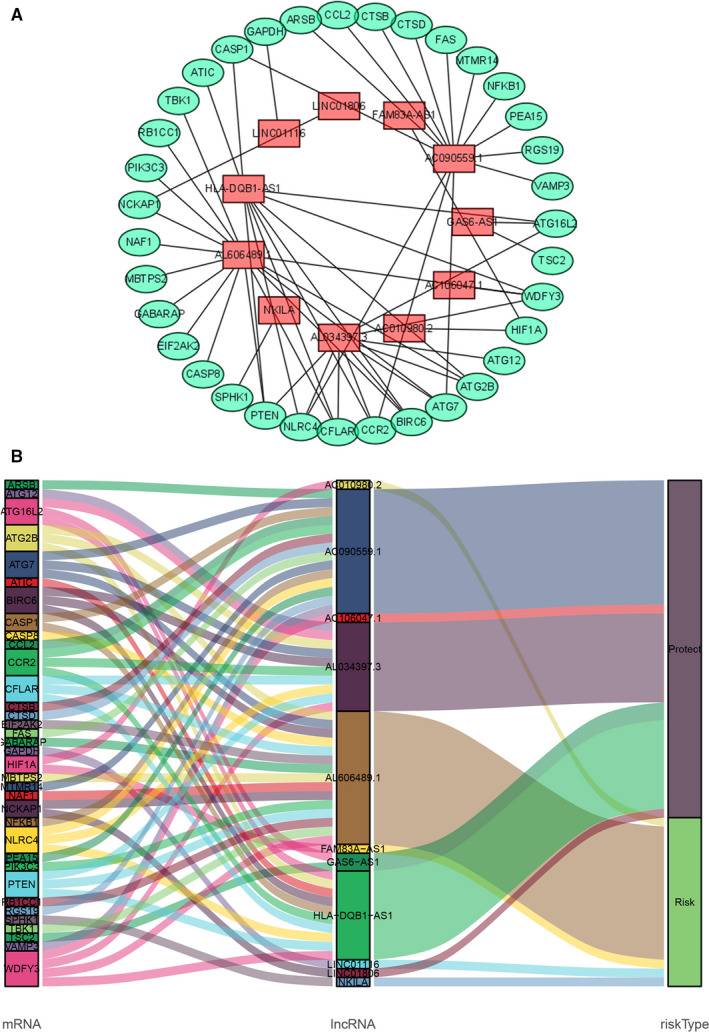
Screening of prognostic autophagy‐related lncRNA in LUAD. A, A prognostic co‐expression network of the 11 autophagy‐related lncRNAs‐mRNAs. B, The Sankey diagram of the relationship between lncRNA and mRNA
FIGURE 2.
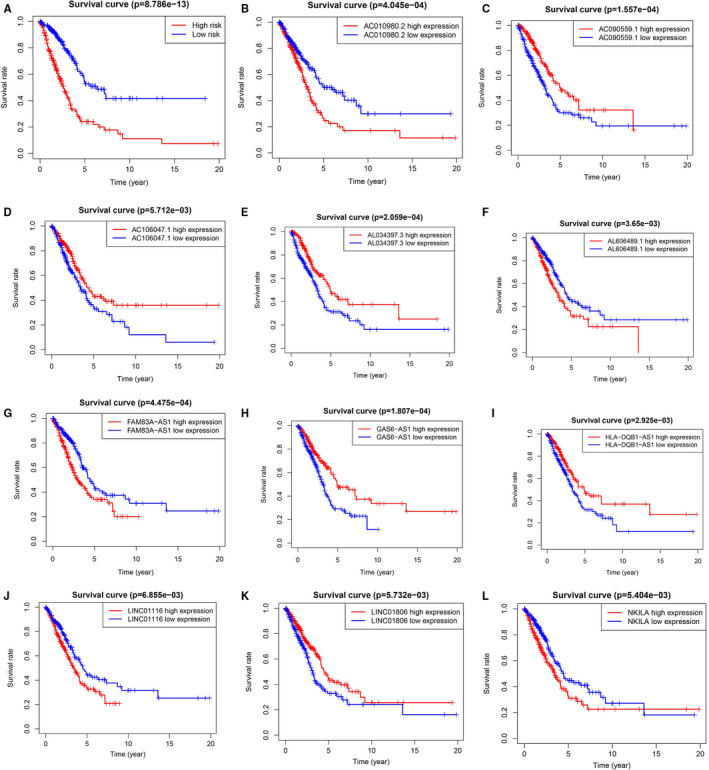
Survival curve of patients with LUAD in different groups
FIGURE 3.
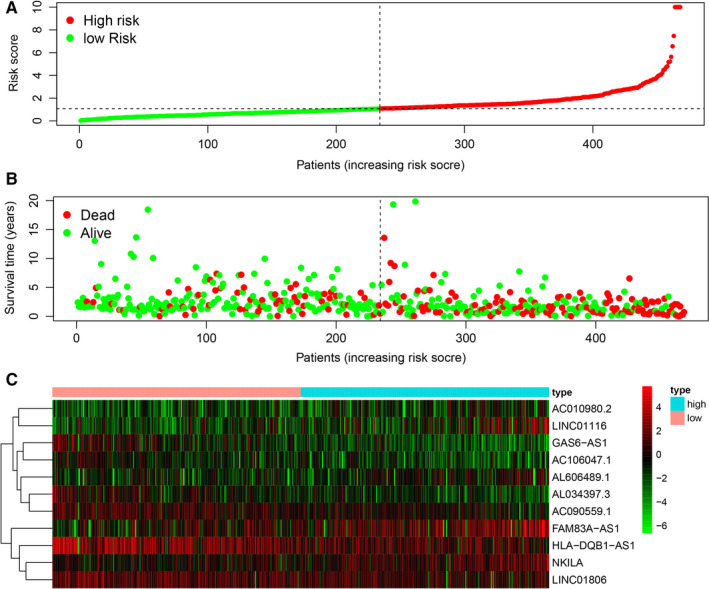
The survival model of the 11 autophagy‐related lncRNAs with prognostic value. A, The risk curve based on the risk score of each sample. B, The scatterplot based on the survival status of each sample. The green and red dots represent survival and death. C, The heatmap displayed the expression levels of autophagy‐related lncRNA in the high‐risk and low‐risk groups
3.2. Evaluation of the survival model for LUAD patients
In order to evaluate whether the above 11 autophagy‐related lncRNA survival models were independent prognostic factors of LUAD, univariate and multivariate Cox regression analyses were performed. The hazard ratio (HR) of the risk score was 1.256 (95% CI 1.196‐1.320) (P < .001) in univariate Cox regression analysis (Figure 4A) and 1.215 (95% CI 1.149‐1.286) (P < .001) in multivariate Cox regression analysis (Figure 4B). Therefore, the 11 autophagy‐related lncRNAs were independent prognostic factors for LUAD. The area under the ROC curve of risk score (AUC) was calculated to evaluate the sensitivity and specificity of risk score in predicting the prognosis of patients with LUAD. The AUC value of the risk score was 0.809, which was higher than that of other clinical factors (Figure 4C), indicating that 11 autophagy‐related lncRNAs were quite reliable for the prognostic risk model of LUAD. A nomogram plot was performed to predict 3‐year and 5‐year survival in LUAD patients by using age, gender, stage and risk score (Figure 5). The calibration curve showed the good prediction ability of nomogram, and the C‐index of nomogram was 0.746 (Figure 6).
FIGURE 4.
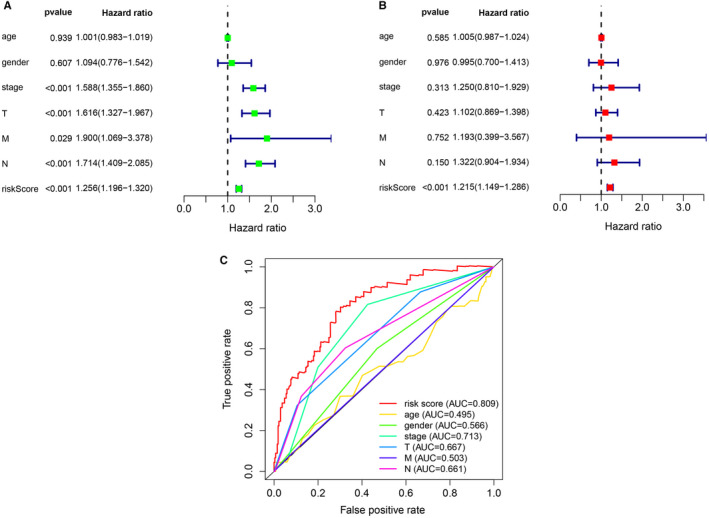
Assessment of the prognostic survival model of the 11 autophagy‐related lncRNAs in LUAD. A, The results of univariate Cox regression analysis of risk score and clinical factors. B, The results of multivariate Cox regression analysis of risk score and clinical factors. C, The AUC for risk score and clinical factors and the ROC curves. Clinical factors: age, gender, stage, T (tumour size), N (lymph node metastasis) and M (distant metastasis)
FIGURE 5.
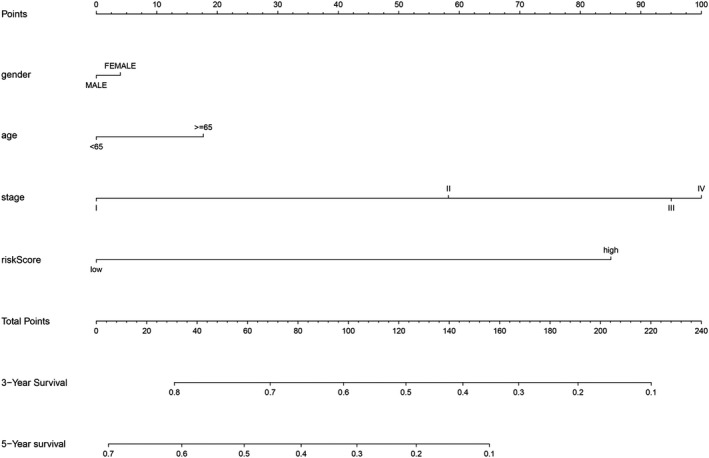
The nomogram of risk score and clinical factors
FIGURE 6.
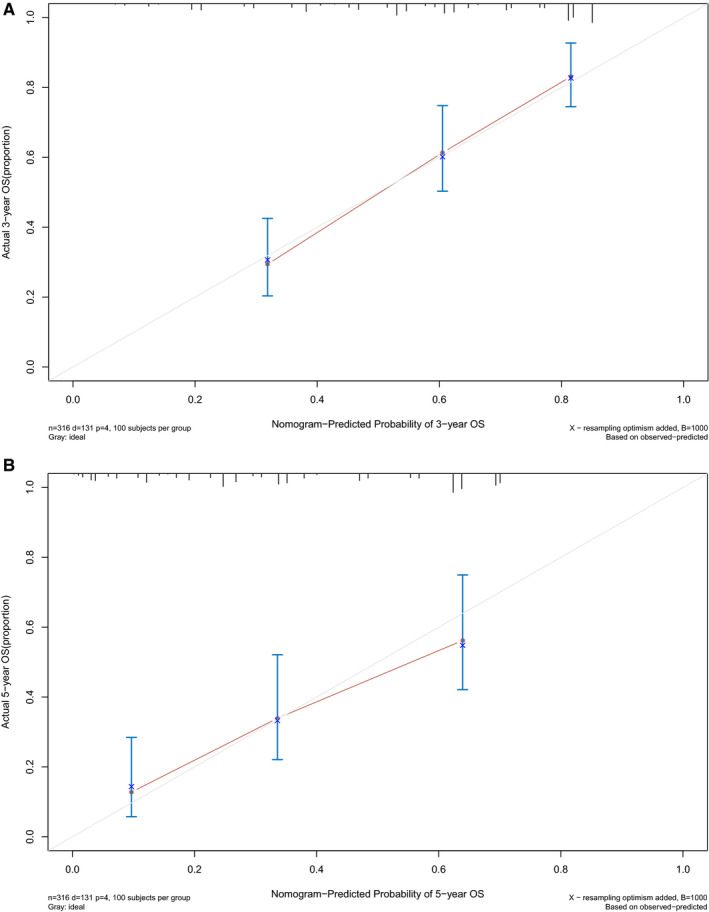
The calibration curve of nomogram. A, The 3‐year OS calibration curve. B, The 5‐year OS calibration curve. The closer the red solid line is to the grey solid line, the closer the nomogram prediction probability is to the actual probability
3.3. GSEA enrichment
GSEA showed that there were different gene expression patterns between high‐risk group and low‐risk group. In the high‐risk group, the expression of genes related to cell cycle and mismatch repair was higher, while in the low‐risk group, the expression of genes related to cell cycle mismatch repair was lower (Figure 7).
FIGURE 7.
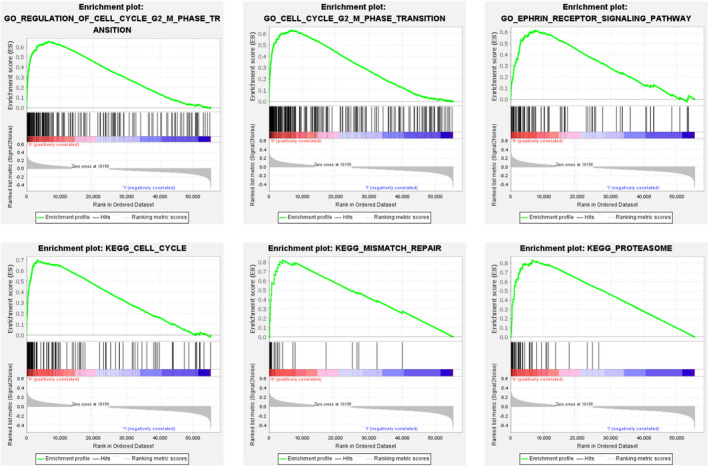
Gene Ontology (GO) and KEGG analyses of the 11 autophagy‐related lncRNAs by GSEA
4. DISCUSSION
In the field of cancer treatment, the treatment of LUAD tends to be individualized and accurate. 20 , 21 However, according to the current guidelines for cancer diagnosis and treatment, it is difficult to apply individualized and accurate treatment. According to clinical experience, some patients with early LUAD will still have tumour recurrence and metastasis after surgical treatment, and there are some patients with lung cancer whose primary focus is very small but have distal metastasis. This seems to indicate that the current cancer treatment guidelines do not fully guide the diagnosis and treatment of cancer. In recent years, with the continuous development of sequencing technology, the concepts of molecular diagnosis and molecular therapy have been deeply rooted in the hearts of the people. 22 The use of biomarkers for cancer diagnosis and prognosis prediction has gradually become a trend. 20 Autophagy plays a key role in the occurrence and development of LUAD. Therefore, it is necessary to use autophagy‐related gene set to predict the prognosis of LUAD. Non‐coding RNA plays a key role in the occurrence and development of cancer, so it is of clinical significance to use autophagy‐related non‐coding RNA to predict the prognosis of LUAD. To our knowledge, this study is the first to use autophagy‐associated lncRNA to predict the prognosis of LUAD.
According to the results of the ROC curve, the AUC of the risk score established by 11 autophagy‐related lncRNAs was 0.809, while the AUC of the staging index of the guidelines was only 0.713. This result showed that the risk score established by these 11 autophagy‐related lncRNAs was superior to the current guidelines for predicting prognosis. More interestingly, the AUC of M stage in TNM staging in the current guidelines was only 0.503, which indicated that the prediction of prognosis of distal metastasis in the guidelines may not be accurate. In GSEA, the differential genes of high‐risk group and low‐risk group were enriched in regulation of cell cycle G2 M phase transition, cell cycle G2 M phase transition, ephrin receptor signalling pathway, cell cycle, mismatch repair and proteasome. The results showed that there was a difference in gene expression between the high‐risk group and the low‐risk group, and the risk scores of 11 autophagy‐related lncRNAs were associated with the occurrence and development of LUAD. On the whole, the risk score we established was a quite reliable indicator for predicting the prognosis of LUAD.
So far, the focus of accurate genomic medicine was to find accurate and specific predictors of survival and prognosis from large medical data with clinical results. Therefore, in recent years, there were some studies aimed at using bioinformatics analysis to explore the prognostic factors related to autophagy. 23 , 24 , 25 In the past year, three prognostic risk models of autophagy‐related genes in LUAD were established based on TCGA database and using different screening criteria and statistical methods. 26 , 27 , 28 At the same time, because of the important role of lncRNA in autophagy, the role of lncRNA related to autophagy in cancer had attracted more attention. Recently, autophagy‐related lncRNA prognostic risk models have been established for several cancers, including breast cancer. Therefore, we conducted this study and found a new 11 lncRNA prognostic risk models associated with autophagy, which may help clinicians to make individual and effective treatment decisions.
However, our research also has the following two limitations. First of all, we used traditional statistical analysis methods to establish and evaluate the prognostic risk models of 11 autophagy‐related lncRNAs. Although these methods have been applied and verified in many studies, more advanced methods and technologies are needed to improve our further research in the future. Secondly, in order to further verify our bioinformatics prediction results, 11 lncRNAs related to autophagy need to be further studied, including functional experiments and molecular mechanisms.
5. CONCLUSION
In conclusion, we identified a novel autophagy‐related survival model consisting of 11 lncRNAs (GAS6‐AS1, AC106047.1, AC010980.2, AL034397.3, NKILA, AL606489.1, HLA‐DQB1‐AS1, LINC01116, LINC01806, FAM83A‐AS1, and AC090559.1) in LUAD. In the future, these 11 autophagy‐related lncRNAs may become new targets for the treatment of LUAD and provide a more individualized and accurate prognostic monitoring tool.
CONFLICT OF INTEREST
The authors declare that they have no competing interests.
AUTHOR CONTRIBUTIONS
Liwei Wu: Formal analysis (lead); Methodology (lead); Writing‐original draft (lead). Zilu Wen: Supervision (equal); Writing‐original draft (equal). Yanzheng Song: Funding acquisition (equal); Writing‐review & editing (equal). Lin Wang: Funding acquisition (equal); Writing‐review & editing (equal).
ETHICAL APPROVAL
Not applicable.
ACKNOWLEDGMENTS
Not applicable.
Wu L, Wen Z, Song Y, Wang L. A novel autophagy‐related lncRNA survival model for lung adenocarcinoma. J Cell Mol Med. 2021;25:5681–5690. 10.1111/jcmm.16582
Funding information
This research was supported by a grant from the Thirteen‐Fifth Mega‐Scientific Project on ‘prevention and treatment of AIDS, viral hepatitis and other infectious diseases’ (grant no. 2017ZX10201301‐003‐002)
Contributor Information
Yanzheng Song, Email: yanzhengsong@163.com.
Lin Wang, Email: wlxxs2011@163.com.
DATA AVAILABILITY STATEMENT
All data used in this study were acquired from The Cancer Genome Atlas (TCGA) portal.
REFERENCES
- 1. Hirsch FR, Scagliotti GV, Mulshine JL, et al. Lung cancer: current therapies and new targeted treatments. Lancet (London, England). 2017;389(10066):299‐311. [DOI] [PubMed] [Google Scholar]
- 2. Raez LE, Cardona AF, Santos ES, et al. The burden of lung cancer in Latin‐America and challenges in the access to genomic profiling, immunotherapy and targeted treatments. Lung cancer (Amsterdam, Netherlands). 2018;119:7‐13. [DOI] [PubMed] [Google Scholar]
- 3. Oskarsdottir GN, Halldorsson H, Sigurdsson MI, et al. Lobectomy for non‐small cell lung carcinoma: a nationwide study of short‐ and long‐term survival. Acta oncologica (Stockholm, Sweden). 2017;56(7):936‐942. [DOI] [PubMed] [Google Scholar]
- 4. Nieder C, Mehta MP, Geinitz H, et al. Prognostic and predictive factors in patients with brain metastases from solid tumors: a review of published nomograms. Crit Rev Oncol/Hematol. 2018;126:13‐18. [DOI] [PubMed] [Google Scholar]
- 5. Monkkonen T, Debnath J. Inflammatory signaling cascades and autophagy in cancer. Autophagy. 2018;14(2):190‐198. [DOI] [PMC free article] [PubMed] [Google Scholar]
- 6. Dower CM, Wills CA, Frisch SM, et al. Mechanisms and context underlying the role of autophagy in cancer metastasis. Autophagy. 2018;14(7):1110‐1128. [DOI] [PMC free article] [PubMed] [Google Scholar]
- 7. Deretic V, Levine B. Autophagy balances inflammation in innate immunity. Autophagy. 2018;14(2):243‐251. [DOI] [PMC free article] [PubMed] [Google Scholar]
- 8. Zhang J, Wang P, Wan L, et al. The emergence of noncoding RNAs as Heracles in autophagy. Autophagy. 2017;13(6):1004‐1024. [DOI] [PMC free article] [PubMed] [Google Scholar]
- 9. Rezaei S, Mahjoubin‐Tehran M, Aghaee‐Bakhtiari SH, et al. Autophagy‐related MicroRNAs in chronic lung diseases and lung cancer. Crit Rev Oncol/Hematol. 2020;153:103063. [DOI] [PubMed] [Google Scholar]
- 10. Liu G, Pei F, Yang F, et al. Role of Autophagy and Apoptosis in Non‐Small‐Cell Lung Cancer. Int J Mol Sci. 2017;18(2):367. [DOI] [PMC free article] [PubMed] [Google Scholar]
- 11. Xu B, Mei J, Ji W, et al. LncRNA SNHG3, a potential oncogene in human cancers. Cancer Cell Int. 2020;20(1):536. [DOI] [PMC free article] [PubMed] [Google Scholar]
- 12. Ye R, Tang R, Gan S, et al. New insights into long non‐coding RNAs in non‐small cell lung cancer. Biomed Pharmacother. 2020;131:110775. [DOI] [PubMed] [Google Scholar]
- 13. Liu H, Han L, Liu Z, et al. Long noncoding RNA MNX1‐AS1 contributes to lung cancer progression through the miR‐527/BRF2 pathway. J Cell Physiol. 2019;234(8):13843‐13850. [DOI] [PubMed] [Google Scholar]
- 14. Yang J, Qiu Q, Qian X, et al. Long noncoding RNA LCAT1 functions as a ceRNA to regulate RAC1 function by sponging miR‐4715‐5p in lung cancer. Mol Cancer. 2019;18(1):171. [DOI] [PMC free article] [PubMed] [Google Scholar]
- 15. Pan L, Xiao X, Zhao Y, et al. The functional roles of long noncoding RNA DANCR in human cancers. J Cancer. 2020;11(23):6970‐6981. [DOI] [PMC free article] [PubMed] [Google Scholar]
- 16. Wang Y, Gong W, Zhou S, et al. Long noncoding RNA PRRG4‐4 promotes viability, cell cycle, migration, and invasion in lung cancer cells. DNA Cell Biol. 2018;37(12):953‐966. [DOI] [PubMed] [Google Scholar]
- 17. Yu S, Yang D, Ye Y, et al. Long noncoding RNA actin filament‐associated protein 1 antisense RNA 1 promotes malignant phenotype through binding with lysine‐specific demethylase 1 and repressing HMG box‐containing protein 1 in non‐small‐cell lung cancer. Cancer Sci. 2019;110(7):2211‐2225. [DOI] [PMC free article] [PubMed] [Google Scholar]
- 18. Schober P, Boer C, Schwarte LA. Correlation coefficients: appropriate use and interpretation. Anest Analg. 2018;126(5):1763‐1768. [DOI] [PubMed] [Google Scholar]
- 19. Subramanian A, Tamayo P, Mootha VK, et al. Gene set enrichment analysis: a knowledge‐based approach for interpreting genome‐wide expression profiles. Proc Natl Acad Sci USA. 2005;102(43):15545‐15550. [DOI] [PMC free article] [PubMed] [Google Scholar]
- 20. Magalhães M, Alvarez‐Lorenzo C, Concheiro A, et al. RNAi‐based therapeutics for lung cancer: biomarkers, microRNAs, and nanocarriers. Expert Opin Drug Deliv. 2018;15(10):965‐982. [DOI] [PubMed] [Google Scholar]
- 21. Speth JM, Penke LR, Bazzill JD, et al. Alveolar macrophage secretion of vesicular SOCS3 represents a platform for lung cancer therapeutics. JCI Insight. 2019;4(20):e131340. [DOI] [PMC free article] [PubMed] [Google Scholar]
- 22. Kato T, Jin CS, Ujiie H, et al. Nanoparticle targeted folate receptor 1‐enhanced photodynamic therapy for lung cancer. Lung Cancer (Amsterdam, Netherlands). 2017;113:59‐68. [DOI] [PubMed] [Google Scholar]
- 23. Gu X, Chen X, Zhu L, et al. Development of an autophagy score signature for predicting overall survival in papillary renal cell carcinoma. Dis Markers. 2020;2020:8867019. [DOI] [PMC free article] [PubMed] [Google Scholar]
- 24. Ren Z, Zhang L, Ding W, et al. Development and validation of a novel survival model for head and neck squamous cell carcinoma based on autophagy‐related genes. Genomics. 2021;113(1):1166‐1175. [DOI] [PubMed] [Google Scholar]
- 25. Wei X, Wang W, Wang H, et al. Identification of an independent autophagy‐gene prognostic index for papillary renal cell carcinoma. Transl Androl Urol. 2020;9(5):1945‐1956. [DOI] [PMC free article] [PubMed] [Google Scholar]
- 26. Zhang F, Xie S, Zhang Z, et al. A novel risk model based on autophagy pathway related genes for survival prediction in lung adenocarcinoma. Med Sci Monit. 2020;26:e924710. [DOI] [PMC free article] [PubMed] [Google Scholar]
- 27. Wang X, Yao S, Xiao Z, et al. Development and validation of a survival model for lung adenocarcinoma based on autophagy‐associated genes. J Transl Med. 2020;18(1):149. [DOI] [PMC free article] [PubMed] [Google Scholar]
- 28. Liu Y, Wu L, Ao H, et al. Prognostic implications of autophagy‐associated gene signatures in non‐small cell lung cancer. Aging. 2019;11(23):11440‐11462. [DOI] [PMC free article] [PubMed] [Google Scholar]
Associated Data
This section collects any data citations, data availability statements, or supplementary materials included in this article.
Data Availability Statement
All data used in this study were acquired from The Cancer Genome Atlas (TCGA) portal.


