Abstract
Alternative polarization of macrophages regulates multiple biological processes. While M1‐polarized macrophages generally mediate rapid immune responses, M2‐polarized macrophages induce chronic and mild immune responses. In either case, polyunsaturated fatty acid (PUFA)‐derived lipid mediators act as both products and regulators of macrophages. Prostaglandin E3 (PGE3) is an eicosanoid derived from eicosapentaenoic acid, which is converted by cyclooxygenase, followed by prostaglandin E synthase successively. We found that PGE3 played an anti‐inflammatory role by inhibiting LPS and interferon‐γ‐induced M1 polarization and promoting interleukin‐4‐mediated M2 polarization (M2a). Further, we found that although PGE3 had no direct effect on the growth of prostate cancer cells in vitro, PGE3 could inhibit prostate cancer in vivo in a nude mouse model of neoplasia. Notably, we found that PGE3 significantly inhibited prostate cancer cell growth in a cancer cell‐macrophage co‐culture system. Experimental results showed that PGE3 inhibited the polarization of tumour‐associated M2 macrophages (TAM), consequently producing indirect anti‐tumour activity. Mechanistically, we identified that PGE3 regulated the expression and activation of protein kinase A, which is critical for macrophage polarization. In summary, this study indicates that PGE3 can selectively promote M2a polarization, while inhibiting M1 and TAM polarization, thus exerting an anti‐inflammatory effect and anti‐tumour effect in prostate cancer.
Keywords: macrophage polarization, prostaglandin E3, protein kinase A, tumour‐associated macrophage
1. INTRODUCTION
Macrophages can be activated in response to diverse stimuli and have distinct functional subsets resulting from distinct phenotypic polarization. 1 According to the type‐1/type‐2 cell polarization theory, 2 , 3 phenotypically polarized macrophages are defined as one of two primary activation states, named as classically activated (M1) and alternatively activated (M2) macrophages. Classical M1 macrophages, which can be induced by lipopolysaccharide (LPS) and interferon (IFN)‐γ, exert pro‐inflammatory functions by secreting inflammatory factors. In anti‐infective immunity, M1 macrophages participate in the recognition and clearance of pathogens and can further activate cellular immunity. In the early stages of tumour development, M1 macrophages can also help activate immune surveillance to clear mutated cells. However, acute inflammation associated with M1 macrophages can also cause severe inflammatory damage, including organ failure induced by cytokine storms and accumulation of mutations through repeated injury. M2‐polarized macrophages can be divided into the following subtypes: M2a, M2b, M2c and M2d. Although these M2 subtypes share some markers (eg CD206), their activation and functions are different. M2a macrophages, which are induced by interleukin (IL)‐4 and/or IL‐13, are the most widely studied M2 subtype and attenuate the immune response by secreting IL‐10, transforming growth factor beta (TGF‐β), and C‐C motif chemokine ligand 17 (CCL17). The functions of M2b and M2c macrophages are similar to those of M2a macrophages but have distinct routes of polarization. M2d macrophages are also known as tumour‐associated macrophages (TAM) and reside in tumour microenvironments. Monocytes can be stimulated by secreted factors (eg chemokines, cytokines and growth factors) from cancer and non‐malignant cells in the tumour microenvironment to adopt a TAM phenotype. When activated, TAMs exhibit pro‐tumorigenic effects.
Prostaglandins (PGs) are a group of diverse polyunsaturated fatty acid‐derived bioactive lipids synthesized by cyclooxygenase (COX). In the synthesis of PGE2, arachidonic acid (AA) is first converted to prostaglandin H2 by the enzymes COX‐1 and COX‐2, and then cell‐specific prostaglandin synthases convert prostaglandin H2 into various prostaglandins, including PGI2, PGF2α, PGD2 and PGE2. Prostaglandins E2 and E3 (PGE2 and PGE3) have received the most attention for their roles in modulating inflammation. 4 , 5 , 6 PGE2 has been well‐characterized and is known to play important roles in the regulation and activity of T lymphocytes. 7 , 8 , 9 It primarily acts through four G protein‐coupled receptor subtypes of EP receptors, EP1, EP2, EP3 and EP4. 10 , 11 In addition, recent studies indicated that PGE2 can promote M2 polarization of macrophages in vivo through the EP4 receptor and its downstream cyclic AMP (cAMP)‐protein kinase A (PKA) pathway, which activates cAMP‐responsive element‐binding protein (CREB) and Kruppel‐like factor 4. 12 PGE2 and PGE3 share the same metabolic pathway and have high structural similarity. However, unlike AA‐derived PGE2, eicosapentaenoic acid (EPA)‐derived PGE3 has not been widely studied. PGE3 is widely presumed to be anti‐inflammatory and anti‐neoplastic. It is thought that PGE3 can antagonize PGE2 to yield anti‐tumour or anti‐inflammatory effects, but there is a lack of supporting evidence. 13 Moreover, there are few reports of PGE3 modulation of macrophage phenotypes. Existing studies suggest that PGE3 shares the same EP receptors with PGE2, although with different potencies. 10 , 14 , 15 Based on these studies, we investigated whether PGE3 could engage this pathway to alternatively activate macrophages.
We explored the role of PGE3 in macrophage polarization and found that PGE3 selectively promoted M2a polarization, while inhibiting M1 and TAM polarization. Therefore, it exerted an inhibitory effect on prostate cancer inflammation. This process depended on PGE3‐induced up‐regulation of the PKA pathway.
2. MATERIALS AND METHODS
2.1. Cell culture
The human prostate cancer cell lines PC3 (ATCC, Cat. #: CRL1435), 22RV1 (ATCC, Cat. #: CRL2505;), and LNCaP (ATCC, Cat. #: CBP61040); human monocytic leukaemia cell line THP‐1 (ATCC, Cat. #: TIB‐202); and mouse fibroblast cell line L929 (ATCC, Cat. #: CCL‐1) were purchased from the Shanghai Institute of Cell Biology, Chinese Academy of Sciences (Shanghai, China). The PC3, 22RV1 and LNCaP cells were cultured in RPMI 1640 medium (Gibco) supplemented with 10% (v/v) foetal bovine serum (FBS, Gibco) at 37°C in an atmosphere of 5% CO2. THP‐1 cells were grown in RPMI 1640 medium supplemented with 10% FBS, 1% glutamine (Thermo Fisher Scientific) and 0.2 μmol/L β‐mercaptoethanol (Sigma‐Aldrich) at 37°C and 5% CO2.
2.2. Macrophage polarization
Polarization of THP‐1 cells into M0, M1, and M2 macrophages was performed as previously described. 16 Briefly, THP‐1 cells were differentiated into M0 macrophages by incubation with 100 nmol/L phorbol12‐myristate 13‐acetate (PMA) for 24 hours (Sigma‐Aldrich). Once the cells were adherent, they were transferred to PMA‐free media for 24 hours (M0). These cells were then polarized to M1‐like macrophages by incubation with 100 ng/mL LPS (Sigma‐Aldrich) and 20 ng/mL IFN‐γ (R&D Systems) for 72 hours or M2a‐like macrophages by incubation with 20 ng/mL IL‐4 (R&D Systems) for 72 hours. At the same time, the cells were treated with or without PGE3 (100 nmol/L, Cayman Chemical).
Bone marrow‐derived macrophage (BED) isolation and cultivation were performed as described by the Cold Spring Harbor Protocols. 17 Briefly, femur and tibia bones were collected from 6‐ to 8‐week‐old C57BL6/J mice, and then bone marrow cells were flushed out using phosphate‐buffered saline (PBS) supplemented with 2% heat‐inactivated FBS. After the red blood cells were lysed with red blood cell lysis buffer, the cells were cultured in BMDM growth medium for 7 days, followed by analysis of the purity of the cell population. BMDM growth medium contains 30% supernatant of L929 cells, which provides macrophage colony‐stimulating factor. To induce macrophage polarization, the cells were stimulated with LPS (100 ng/mL) and IFN‐γ (20 ng/mL) for M1 or IL‐4 (20 ng/mL) for M2a activation.
2.3. Co‐culture and differentiation of TAMs and conditioned medium preparation
To obtain M0 macrophages, THP‐1 cells were seeded at a density of 1 × 10⁵ cells per well in a six‐well culture plate and treated with 100 nmol/L PMA for 24 hours as previously described. Next, M0 cells in the six‐well plates were co‐cultured with PC3 cells that had been left to attach to the cell culture inserts for 12 hours before co‐culture. The cells were co‐cultured in RPMI 1640 supplemented with 10% FBS for 7 days and treated with or without PGE3 (100 nmol/L). The medium was replaced every 2 days. After 7 days, the medium was collected as the conditioned medium (CM‐control).
2.4. RNA extraction and quantitative real‐time PCR (qPCR)
Total RNA was extracted using TRIzol (Cat#15596026, Invitrogen) according to the manufacturer's protocol. Reverse transcription was performed according to the manufacturer's protocol with the Prime Script® RT reagent Kit with gDNA Eraser (Cat#PR047A, Takara). Real‐time PCR was performed on a CFX96 Real‐Time System (Bio‐Rad Laboratories) using SYBR Green PCR master mix (Applied Biosystems) and the respective primer pairs for each gene (sequences presented in Table 1). All experiments were performed in triplicate, and data were normalized against beta‐actin. The relative mRNA expression of various genes is presented as the fold‐change, which was determined using the 2‐ΔΔCT method as previously described. 18
TABLE 1.
Primers for quantitative real‐time PCR
| Gene | Primer | Organisms |
|---|---|---|
| Sequence (5’‐3’) | ||
| Arg‐1 |
RE: TGGCTTGCGAGACGTAGAC FW: GCTCAGGTGAATCGGCCTTTT |
Mouse |
| Fizz‐1 |
RE: GGTCCCAGTGCATATGGATGAGACC FW: CACCTCTTCACTCGAGGGACAGTTG |
Mouse |
| IL‐10 |
RE: CGGTTAGCAGTATGTTGTCCAGC FW: CGGGAAGACAATAACTGCACCC |
Mouse |
| iNOS |
RE: CTGATGGCAGACTACAAAGACG FW: TGGCGGAGAGCATTTTTGAC |
Mouse |
| TNFα |
RE: GCTACGACGTGGGCTACAG FW: CCCTCACACTCAGATCATCTTCT |
Mouse |
| IL‐6 |
RE: TTGGTCCTTAGCCACTCCTCC FW: TAGTCCTTCCTACCCCAATTTCC |
Mouse |
| GAPDH |
RE: TGTAGACCATGTAGTTGAGGTCA FW: AGGTCGGTGTGAACGGATTTG |
Mouse |
| CD204 |
RE: TCCACTGAGAGGGATGAGAACT FW: TTCACTATCACAGGAGGACAC |
Human |
| CD163 |
RE: AGCCATTATTACACACGTTCC FW: TTTTGTCACCAGTTCTCTTGGA |
Human |
| TGFβ |
RE: GAACCCGTTGATGTCCACTT FW: CACGTGGAGCTGTACCAGAA |
Human |
| IL‐10 |
RE: GTGGGTGCAGCTGTTCTCAGACT FW: AAAAGAAGGCATGCACAGCTCAG |
Human |
| CCL17 |
RE: CCCTGCACAGTTACAAAAACGA FW: GAGCCATTCCCCTTAGAAAGCT |
Human |
| CD206 |
RE: CTACTGTTATGTCGCTGGCAAA FW: GGATGGAAGCAAAGTGGATTAG |
Human |
| iNOS |
RE: CACGGCCTTGCTCTTGTTTT FW: GTGATGCCCCAAGCTGAGA |
Human |
| TNFα |
RE: GGCCAGAGGGCTGATTAGAGA FW: CTTCTGCCTGCTGCACTTTG |
Human |
| CXCL3 |
RE: GTGGCTATGACTTCGGTTTGG FW: TGCCAGTGCTTGCAGACACT |
Human |
| IL‐6 |
RE: TCTGAGGTGCCCATGCTACATTT FW: GCTGCAGGACATGACAACTCATC |
Human |
| CXCL9 |
RE: GTCCCTTGGTTGGTGCT FW: CATCTTGCTGGTTCTGATTGGA |
Human |
| CCR7 |
RE: GTAATCGTCCGTGACCTCATCTT FW: GCTGGTGGTGGCTCTCCTT |
Human |
| GAPDH |
RE: GCCAGTAGAGGCAGGGATGATGTTC FW: CCATGTTCGTCATGGGTGTGAACCA |
Human |
| EP1 |
RE: ACAGGCCGAAGAAGACCAT FW: CCATGTTCGTCATGGGTGTGAACCA |
Human |
| EP2 |
RE: CGAGACGCGGCGCTAATAGA FW: CGAGACGCGACAGTGGCTTCC |
Human |
| EP3 |
RE: ATGGCTCTGGCGATGAACAACGAG FW: CGGGGCTACGGAGGGGATGC |
Human |
| EP4 |
RE: AGCCCTATCGGAAGGGTTGA FW: CCTTCGACGCACAATGCTTG |
Human |
2.5. Flow cytometry
Cells were detached using 0.05% trypsin (Gibco) and re‐suspended in PBS. Cell suspensions were then stained with anti‐CD206 or CCR7 monoclonal antibodies for 30 minutes at 4°C after FcγRII/III blocking. Flow staining buffers and antibodies were purchased from different companies, with detailed information listed in Table 2. Isotype‐matched controls were included in all experiments. Stained cells were analysed on an Attune NxT flow cytometer (Thermo Fisher Scientific).
TABLE 2.
Antibodies for flow cytometry analysis
| Antibody | Company | Catalog | Organisms |
|---|---|---|---|
| APC anti‐human CD206 | BioLegend | 321110 | Human |
| PE iNOS Antibody (4E5) | Novus | NBP2‐22119 | Human |
| PE anti‐mouse CD206 | BioLegend | 141705 | Mouse |
| APC ANTI‐MOUSE NOS2 (CXNFT) | eBioscience | 17‐5920‐80 | Mouse |
| FITC ANTI‐MOUSE CD11B (M1/70) | eBioscience | 11‐0112‐81 | Mouse |
2.6. Tumour transplantation in nude mice
Nude mice (BABL/c) were inoculated with a mixture of cells and Matrigel (BD Matrigel™ Basement Membrane Matrix, Cat#354248, BD Biosciences) on both sides of the back at 5 weeks of age. All procedures were approved by the ethics committee of Jiangnan University (protocol number: JN.NO20191030b048130[289]). The PC3 xenograft model was selected. PC3 cells were cultured to a density of 80% (logarithmic growth phase), and cell passage experiments were performed. Nude mice were transplanted with 1 × 10⁷ cells/mL in serum‐free RPMI 1640, and then mixed with an equal volume of Matrigel, which had been thawed on ice overnight. Vaccination was performed as soon as possible after mixing (30 minutes). Each nude mouse was inoculated with 50 μL of cell and Matrigel mixture subcutaneously on the back on each of the left and right sides, and tumour growth was regularly observed thereafter. Successfully transplanted nude mice (uniform tumour size) were divided into control and PGE3 groups with 6 mice in each group. In the PGE3 group, 1 μmol/L PGE3 (diluted in 50 μL saline) was injected next to the tumour, whereas the control group was injected with the same volume of saline near the tumour at the same time point. All treatments were performed every 3 days. Four weeks later, nude mice were sacrificed by cervical dislocation. Tumour tissues were removed and weighed, and then embedded into optimal cutting temperature (OCT) compound, cut into 8‐µm‐thick sections. Immunofluorescent staining was performed with rabbit anti‐CD68 (Cat. #: 2808‐1‐AP, Proteintech) and mouse anti‐CD206 (Cat. #: 60143‐1‐Ig, Proteintech) antibodies. All primary antibodies were incubated with the sections at 4°C overnight, followed by anti‐rabbit IgG (Cat. #: ab150077, Abcam) and anti‐mouse IgG (Cat. #: SA00006‐3, Proteintech) secondary antibodies. All sections were then incubated with DAPI. Images were captured using an inverted fluorescence microscope (Nikon ECLIPSE Ti‐S), and the total number and positively stained cells were calculated with ImageJ software (NIH).
2.7. Acute inflammation model
All procedures were approved by the ethics committee of Jiangnan University (protocol number: JN. No20191115c1081230[306]). After 1 week of adaptation, 6‐ to 8‐week‐old C57BL6/J mice were divided into 3 different groups (6 in each group) and injected intraperitoneally with saline, LPS (5 mg/kg), or LPS + PGE3 (5 mg/kg + 1 μmol/L). After 24 hours, blood was collected retroorbitally and the mice were sacrificed. Mouse peritoneal macrophages (MPMs) were obtained from peritoneal lavages with PBS for further analysis.
2.8. Enzyme‐linked immunosorbent assay (ELISA)
Sandwich ELISAs were performed to detect cytokines in the serum and MPMs of LPS‐stimulated mice. ELISA kits for IL‐6 and IFN‐ γ were obtained from R&D Systems. The serum was directly used for ELISAs in 96‐well plates without dilution. MRMs were diluted to 1 × 10⁷ cells/mL in PBS, sonicated, and centrifuged; the supernatant was used for ELISA. All procedures were performed according to the manufacturer's protocol. Cytokine concentrations were calculated using to standard curves.
2.9. Phagocytosis assay
The phagocytosis is detected by Flow cytometry. PC3 cells were detached using 0.05% trypsin (Gibco) and washed with PBS three times. Cells were re‐suspended to 1 × 10⁷ cells/mL in PBS, stained with CFSE (Cat. #: HY‐D0938, Med Chem Express). Supernatant of TAM was replaced with CFSE‐stained PC3 cell suspension, and the co‐culture was incubated for 30 minutes. After discarding supernatant, cells were detached, washed three times with PBS, stained with anti‐CD206 antibody. CFSE and CD206 double‐positive cell population was analysed by Flow cytometry.
The phagocytosis is detected by Neutral red solution. After discarding supernatant, TAM cells (in 96‐well plate) would be washed with PBS three times. The cells were then incubated with 0.1% neutral red solution (Cat. #: R22255, Shanghai yuanye Bio‐Technology) for 20 minutes, after which the media were removed carefully and the cells were washed with PBS five times. Then, the cells were solubilized in 0.2 mL solution (50% ethanol, 49% water and 1% acetic acid). Optical absorbance was measured at 540 nm 4 hours later.
2.10. Proliferation assay
3‐(4,5‐Dimethylthiazol‐2‐yl)‐2,5‐diphenyltetrazolium bromide (M2128, Sigma‐Aldrich) was prepared by dissolving 5 mg M2128 in 1 mL PBS. The stock solution was protected from light and stored at −20°C. To evaluate proliferation, PC3 cells (1.5 × 10³ cells) were seeded into 96‐well plates in sextuplicate and allowed to adhere overnight in complete RPMI 1640. The medium was then removed and replaced by FBS‐free medium for 24 hours, after which the cells were cultured in conventional medium, CM‐control with or without PGE3, or CM/PGE3 for 72 hours. At various time points, the medium was removed and replaced by 100 µL FBS‐free medium with 10 µL of prepared MTT solution. The cells were then incubated at 37°C for 4 hours, after which the media were removed carefully and the cells were solubilized in 0.2 mL dimethyl sulphoxide. Optical absorbance was measured at 570 nm using a reference wavelength of 630 nm. Data were calculated as the OD570‐OD630, and cell numbers were reported as percentages compared to the control.
2.11. Western blotting
Protein samples were separated by 10% SDS‐PAGE and then transferred to polyvinylidene difluoride membranes (MA01821, Millipore). The membranes were blocked for 2 hours in 5% skim milk and then incubated with primary antibodies (Table 3) overnight at 4°C. Horseradish peroxidase‐labelled goat anti‐mouse or anti‐rabbit IgG secondary antibodies were used for ECL detection (WBKLS0500, Sigma‐Aldrich).
TABLE 3.
Antibodies for Western blot
| Antibody | Company | Catalog | Organisms |
|---|---|---|---|
| Anti‐h/m/r PKA Cα/β | R&D Systems | MAB5908 | Human |
| Phospho‐PKA C (Thr197) Antibody | Cell Signaling Technology | 4781S | Human |
| PKC Beta Antibody | Proteintech | 12919‐1‐AP | Human |
| Phospho‐PKC (pan) (βII Ser660) Antibody | Cell Signaling Technology | 9371S | Human |
| Akt Antibody | Cell Signaling Technology | 9272 | Human |
| Phospho‐Akt (Ser473) Antibody | Cell Signaling Technology | 9271 | Human |
| β‐tubulin | BosterBio | BM1453 | Human |
| β‐actin | Sigma | A1978 | Human |
| Anti‐COX2 | Abcam | ab1591 | Human |
2.12. Statistics
All data were analysed using GraphPad Prism 6 software. All data are shown as the means ± SD. One‐way analysis of variance was performed to determine the significance among three or more groups followed by the indicated post hoc tests. t test was used to analyse two independent samples. P < .05 was considered as statistically significant.
3. RESULTS
3.1. Prostaglandin E3 suppresses M1 markers and induces M2a marker expression in polarized macrophages
Prostaglandins are potent lipid molecules affecting vital aspects of immunity. 19 We predicted that PGE3 affects the immune microenvironment. We used THP‐1 cells as an in vitro macrophage model. 16 qPCR and flow cytometry were performed to measure the expression of classical M1 and M2a markers. Following polarization, we observed marked up‐regulation of CCR7 in M1 cells and CD163 in M2a cells compared to in M0 cells (Figure 1). Consistent with these findings, iNOS, TNF‐α, CXCL3, IL6, CXCL9 and CCR7 showed significantly higher expression in M1 cells, and CD204, CD163, TGF‐β, IL10, CCL17 and CD206 showed significantly higher expression in M2a cells compared to in M0 cells (Figure 1).
FIGURE 1.
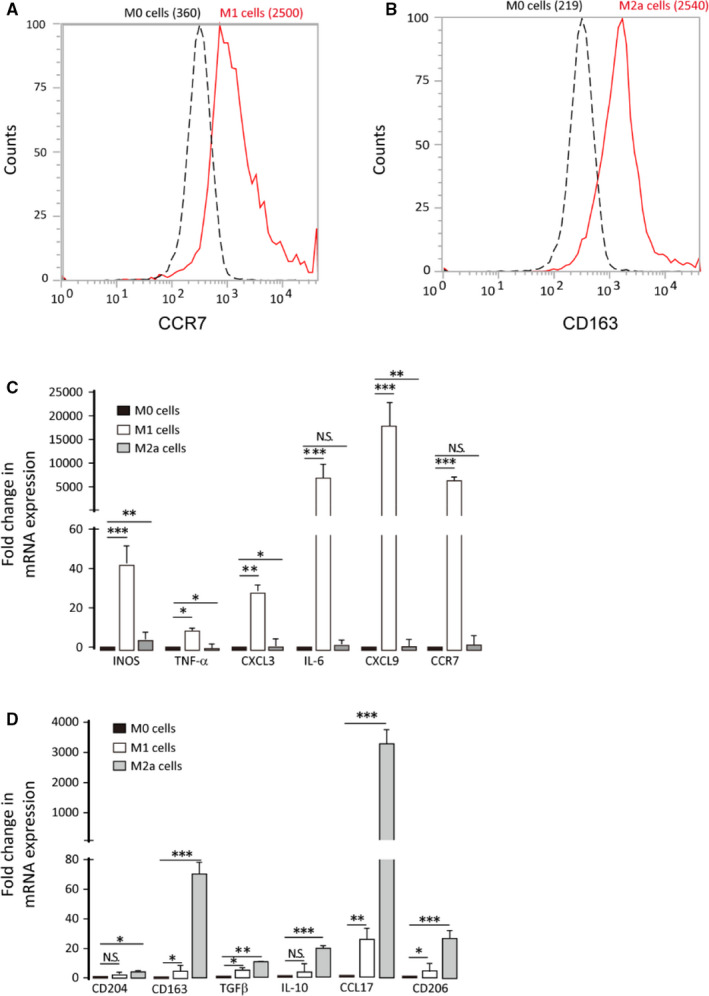
THP1 cells can be polarized to M1/M2a macrophages. M0 cells were obtained by treating THP‐1 cells with PMA for 24 h, followed by incubation in conventional media for 24 h. M0 cells were polarized to M1 or M2a cells using 100 ng/mL LPS and 20 ng/mL IFN‐γ or with 20 ng/mL IL‐4 for 72 h, respectively. A‐B, M1 marker (CCR7) and M2a marker (CD163) expression were analysed by flow cytometry. C‐D, qPCR analysis of M1 (iNOS, TNFα, CXCL3, IL6, CXCL9 and CCR7) and M2a (CD204, CD163, TGFβ, IL10, CCL17 and CD206) markers. Graphs represent means ± SD; *P ≤ .05, **P ≤ .01, ***P ≤ .001
To evaluate potential functions of PGE3 in macrophages, M0 cells were treated with PGE3 (100 nmol/L) during polarization. PGE3 caused down‐regulation of M1 markers and up‐regulation of M2a markers (Figure 2). To confirm these findings, BMDMs were isolated and collected from C57BL/6 mice, as previously described. 20 Most BMDMs (96.7%) were macrophages after culture with 30% L929 cell supernatant for 7 days under our experimental conditions (Figure 3A, B). BMDMs were polarized to M1 or M2a phenotypes by LPS and IFN‐γ or IL‐4 treatment, respectively. Similar to the results in THP‐1 cells, PGE3 up‐regulated M2a markers and down‐regulated M1 markers (Figure 3C‐J). These results suggest that PGE3 preferentially inhibits polarization towards M1 but promotes polarization of M2a macrophages.
FIGURE 2.
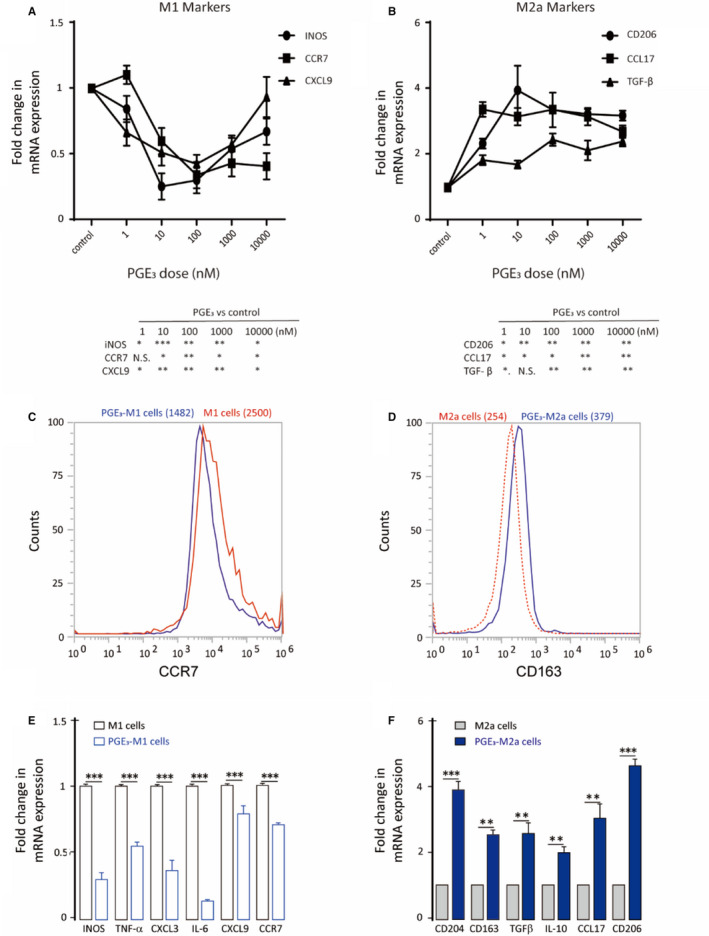
Prostaglandin E3 suppresses M1 and induces M2a marker expression in polarized macrophages. A‐B, Dose–response of M1 and M2a markers after PGE3 treatment (1‐10 000 nmol/L). C, CCR7 protein expression in THP1‐derived M1 macrophages following PGE3 treatment (100 nmol/L). D, CD163 protein expression in THP1‐derived M2a macrophages following PGE3 treatment. E‐F, M1 and M2a marker expression following PGE3 treatment. Graphs represent means ± SD; NS, No significance, *P ≤ .05, **P ≤ .01, ***P ≤ .001
FIGURE 3.
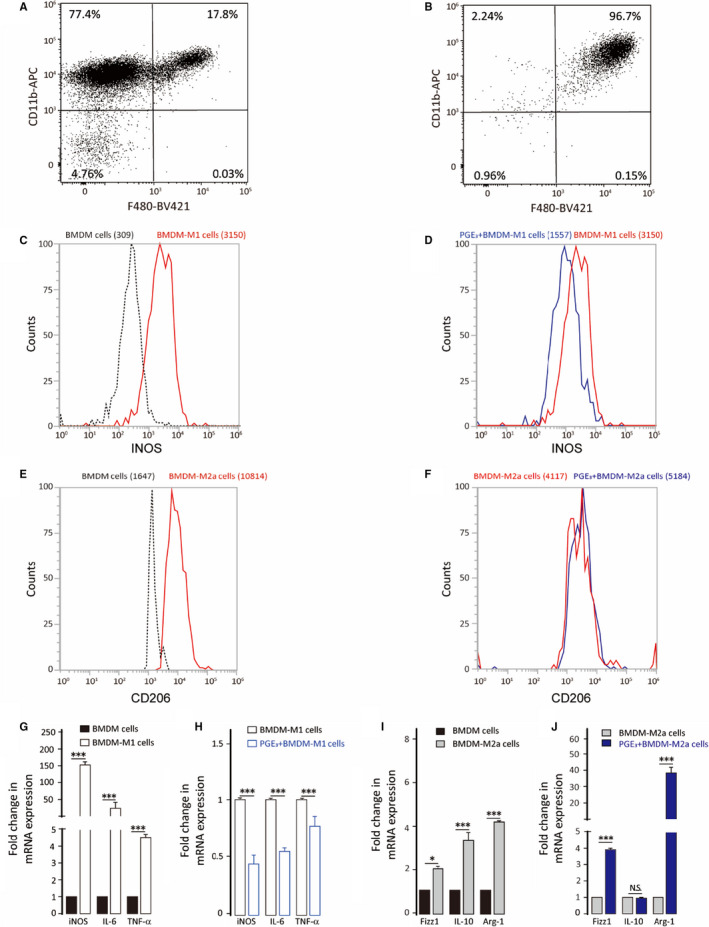
Effect of PGE3 treatment on bone marrow‐derived macrophage polarization. BMDM cells were treated with 100 ng/mL LPS plus 20 ng/mL IFN‐γ or treated with 20 ng/mL IL‐4 for 24 h in the presence or absence of PGE3. A, BMDM cells were cultured in RPMI 1640 medium. B, BMDM cells were cultured in RPMI 1640 medium with 30% L929 cell supernatant. C‐F, M1 marker (iNOS) and M2a marker (CD206) expression were analysed by flow cytometry. G‐H, qPCR analysis of M1 (iNOS, IL6, TNFα) and M2 (Fizz1, Arg‐1, IL10) markers. Graphs represent means ± SD; NS, No significance, *P ≤ .05, ***P ≤ .001
3.2. PGE3 has anti‐inflammatory effects in vivo
We next evaluated the role of PGE3 during acute inflammation in vivo. Mice 6‐8 weeks old were divided into 3 different groups (6 in each group) and injected intraperitoneally with saline, LPS or LPS + PGE3. After 24 hours, PGE3 significantly reduced MPMs with an M1‐like phenotype and increased M2‐like MPMs (Figure 4A). Additionally, PGE3 inhibited inflammatory cytokine secretion in both the serum and MPM cell lysates (Figure 4B). These results indicate that PGE3 can significantly (P < .05) modulate macrophage polarization towards an anti‐inflammatory function.
FIGURE 4.
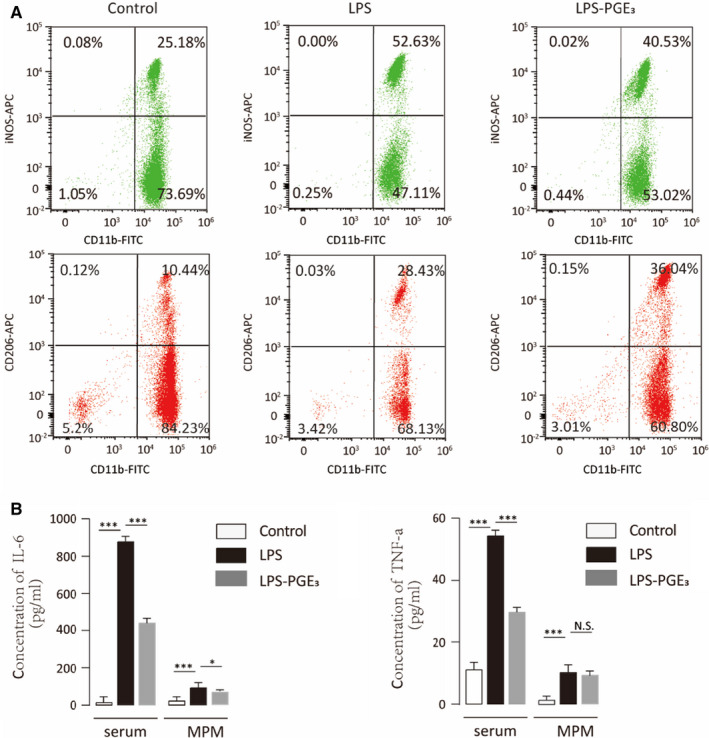
Prostaglandin E3 inhibits inflammation in vivo. C57BL6/J mice were stimulated with LPS to induce acute inflammation. Mice in the control group were injected with saline and those in the LPS‐PGE3 group were injected with LPS and PGE3 together. A, After 24 h, mouse peritoneal macrophages (MPMs) were isolated and analysed by flow cytometry. B, ELISA was performed to determine the concentrations of IL‐6 and TNF‐α in both serum and MPM lysates. Graphs represent means ± SD; NS, No significance, *P ≤ .05, ***P ≤ .001
3.3. Prostaglandin E3 suppresses TAM polarization and enhances the phagocytosis of TAM
TAMs (also known as M2d) reside in the tumour microenvironment promote tumour cell migration and invasion; these cells are a unique subtype of M2 macrophages. 21 Although PGE3 promoted M2a polarization, the role of PGE3 in TAM polarization is unclear. TAMs were induced by co‐culturing THP‐1 cells with PC3 prostate cancer cells. The canonical M2 macrophage marker CD206 was up‐regulated in THP‐1‐derived TAMs (Figure 5A). qPCR also revealed down‐regulation of COX2 and up‐regulation of VEGF and EGF in THP‐1 TAM cells compared to in M0 cells (Figure 5C). In contrast, PGE3 promoted the expression of COX2 and down‐regulated the expression of CD206, VEGF and EGF (Figure 5B, D, and E), suggesting that PGE3 suppresses TAM polarization.
FIGURE 5.
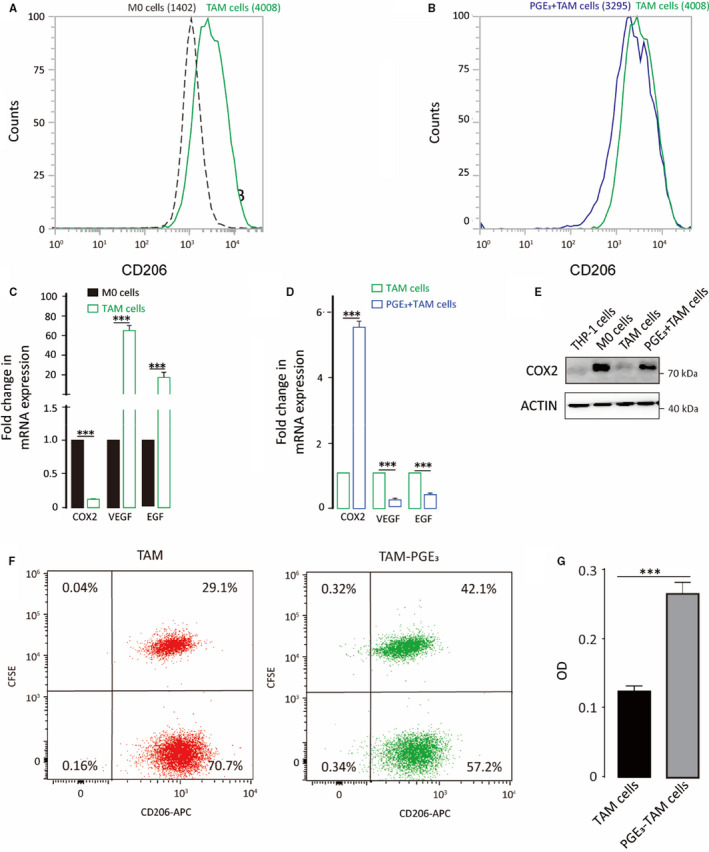
Prostaglandin E3 suppresses TAM polarization and enhances the phagocytosis of TAM. TAMs were derived from THP‐1 cells co‐cultured with PC3 cells. A, CD206 protein expression on macrophages was analysed by flow cytometry. B, CD206 expression in TAMs following PGE3 treatment (100 nmol/L). C‐D, TAM cell markers were detected by qPCR compared to M0 cells, and TAM markers were measured following PGE3 treatment. E, COX2 protein expression following PGE3 treatment. F, Phagocytosis of TAM detected by Flow cytometry. G, Phagocytosis of TAM detected by Neutral red solution. Graphs represent means ± SD; ***P ≤ .001
As inducing phagocytosis of macrophages is a therapeutic strategy in clinic, 22 we also performed the phagocytosis assay to better corroborate the effect of PGE3 on TAM. Results showed that PGE3 treatment enhanced the phagocytosis (Figure 5F and G), suggesting that PGE3 might reduce tumour growth by increasing TAM phagocytosis.
3.4. Prostaglandin E3 suppresses prostate tumour cell proliferation
To investigate the role of PGE3 in tumorigenesis, we performed tumour transplantation experiments and found that PGE3 decreased the weights of transplanted tumours after 1 month of continuous PGE3 injection (Figure 6A). As TAMs always show M2‐like phenotypes, we measured CD68 (a total macrophage marker) and CD206 (an M2‐like macrophage marker) expression in the tumours and observed that both CD68 and CD206 expression can be inhibited by PGE3 (Figure 6B ). These results suggest that PGE3 has antitumorigenic effects by regulating macrophage polarization in vivo. Next, we tested whether PGE3 also inhibits the proliferation of cancer cells in vitro in a co‐culture system with THP‐1 cells. CM with or without PGE3 (CM/PGE3) was collected (Figure 6C) and used in cell proliferation assays (Figure 6D).
FIGURE 6.
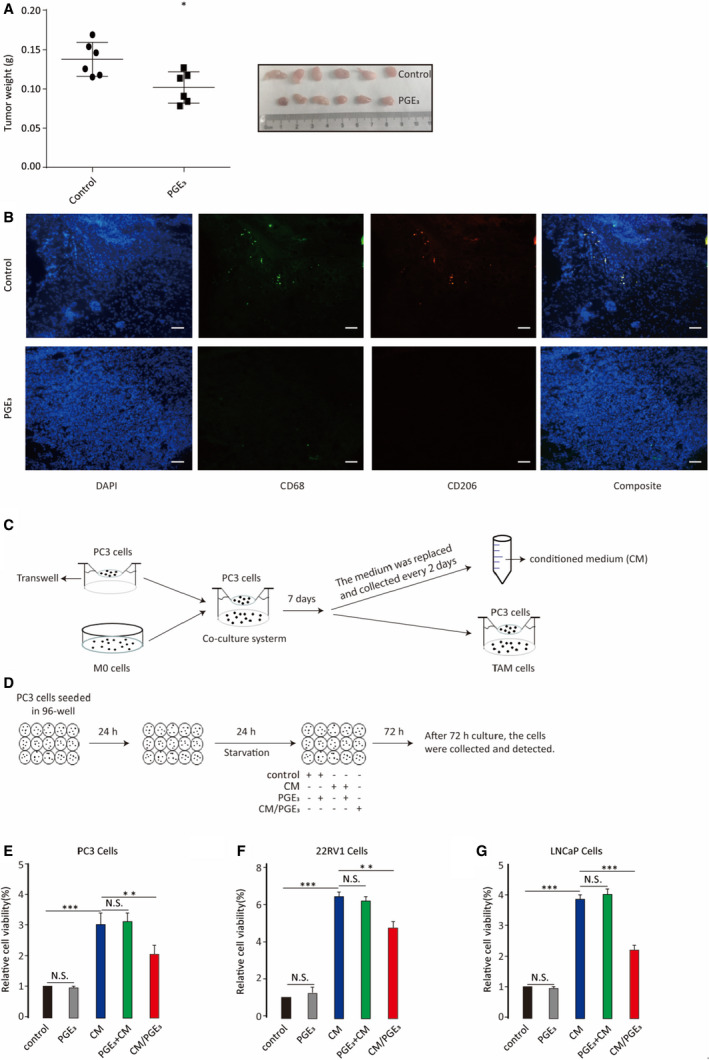
Prostaglandin E3 suppresses prostate tumour growth by down‐regulating TAM polarization. A, Transplanted tumour weights with or without PGE3 treatment. B, Measurement of TAM infiltration by immunofluorescence staining of CD68 and CD206. C, Flow chart of the co‐culture system, differentiation of TAMs, and preparation of conditioned media (CM). PC3 cells were co‐cultured with M0 cells for 7 d to differentiate into TAMs. The co‐culture medium was replaced every 2 d and collected as the CM. During the co‐culture, one group had PGE3 added, with its collected CM defined as CM/PGE3. D, For the proliferation assay, PC3 cells were seeded onto 96‐well plates for 24 h to adhere before stimulation. Media were then removed from PC3 cells and replaced by conventional medium, CM‐control with or without PGE3, and CM‐PGE3, after serum starvation as described previously. After 72 h, the cells were collected and analysed. E‐J, Analysis of proliferation of prostate tumour cells (PC3, 22RV1 and LNCaP cells) treated with CM, CM/PGE3, CM with PGE3 added (PGE3+CM) or PGE3 alone compared to the conventional medium (control). Graphs represent means ± SD; NS, No significance, **P ≤ .01, ***P ≤ .001
We evaluated three prostate cancer cell lines (PC3, 22RV1, and LNCaP) to test our hypothesis. CM significantly promoted the proliferation of prostate tumour cells compared to control, whereas CM/PGE3 was less able to stimulate proliferation. Importantly, addition of PGE3 either into CM or directly onto tumour cells did not inhibit tumour cell proliferation (Figure 6E‐J). These results suggest that PGE3 suppresses tumour cell proliferation by inhibiting TAM polarization. We also analysed the cell cycle in PC3 cells under the above conditions and found that PGE3 reversed the proliferation of TAM on PC3 cells (Figure S1).
3.5. Prostaglandin E3 influences macrophage polarization through the PKA pathway
Normally, prostaglandins affect target cells by activating their cognate receptors EP1, EP2, EP3 or EP4. Expression of EP1, EP2 and EP4 was detectable by RT‐PCR in THP‐1 cells (Figure S2A). EP1 is coupled to Gq/p and induces PKC activation by mobilizing intracellular calcium. EP2 and EP4, however, are coupled with Gs and induce PKA by up‐regulating cAMP. 19 Previous studies showed that EP4 can activate protein kinase B, also known as AKT. 23 We detected the expression of PKA, PKC and AKT and their phosphorylation states by Western blotting. The results are shown in Figure S2B. To determine which EP subtype(s) was (were) involved in the polarization of macrophages, we did a series of experiments using receptor antagonists. Results showed that EP4 mediated the PGE3‐induced macrophage polarization (Figure 7 and Figure S3).
FIGURE 7.
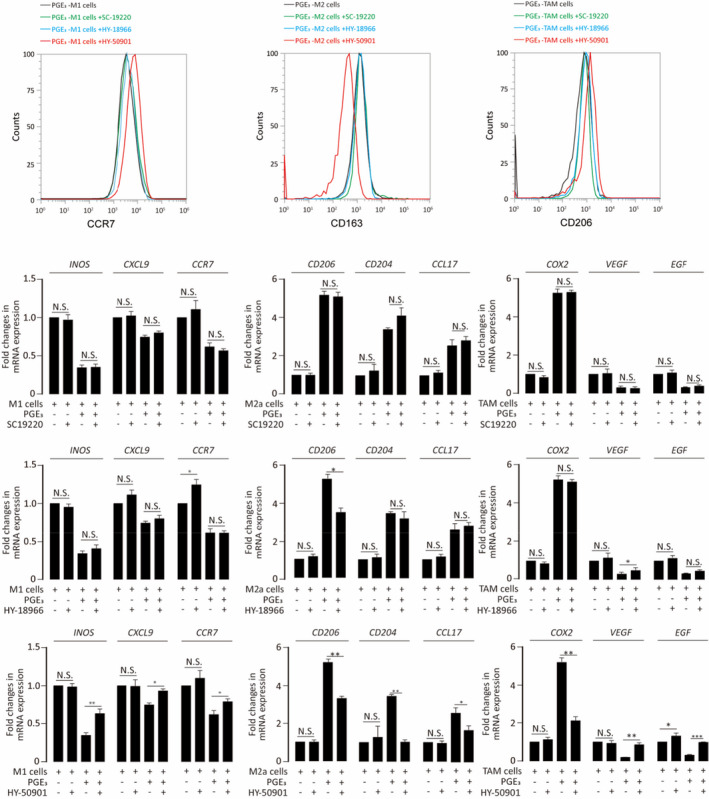
Prostaglandin E3 modulates macrophage polarization via EP receptor. Different EP receptor antagonists were added to examine which was (were) involved in the polarization of macrophages. SC19220 was the antagonist of EP1 receptor. HY‐18966 was the antagonist of EP2 receptor. HY‐50901 was the antagonist of EP4 receptor. Graphs represent means ± SD; NS, No significance, *P ≤ .05, **P ≤ .01
Further analyses showed that both AKT and p‐AKT (Ser473 phosphorylation) did not differ in M0, M2a and TAMs, even when stimulated with PGE3 (Figure 8A, B). PKC‐β and p‐PKC (βII Ser660 phosphorylation) showed low expression in M1 cells, and PGE3 was unable to change their expression; a similar trend was observed in M2a cells. In contrast, PKC levels were slightly increased when TAMs were treated with PGE3, although PKC phosphorylation showed no changes. Interestingly, the expression of both PKA and p‐PKA (Thr197 phosphorylation) was up‐regulated when M1 or M2a cells were treated with PGE3. However, these results were not affected by PGE3 treatment of TAMs (Figure 8A, B).
FIGURE 8.
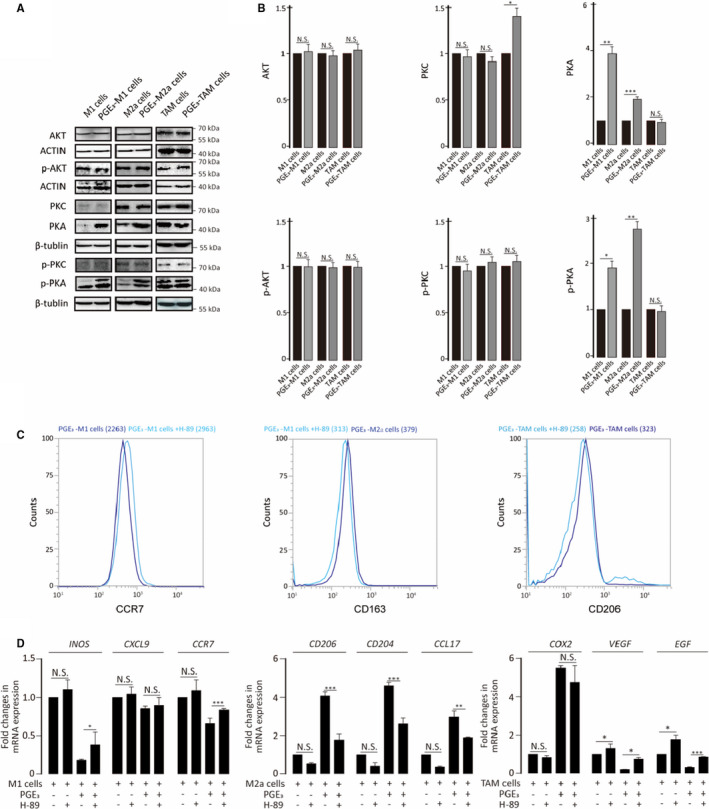
Prostaglandin E3 regulates the expression of PKA. A‐B, Expression of AKT, PKC, PKA and their phosphorylation states in M1, M2a or TAM cells in the presence or absence of PGE3. C, Measurement of M1 (CCR7) or M2a (CD163, CD206) markers after treatment with H‐89 (500 nmol/L) D, Analysis of M1 and M2a markers by qPCR after treatment with H‐89 treatment
As our results showed that PGE3 up‐regulated the expression of PKA in both M1 and M2a cells, we predicted that PGE3 influences macrophage polarization via PKA. To test this mechanism, we added a potent and selective PKA inhibitor (H‐89 dihydrochloride) during macrophage polarization and found that the immunomodulatory effects of PGE3 on macrophages were inhibited by H‐89 dihydrochloride (Figure 8C, D).
4. DISCUSSION
Inflammation is considered as a significant contributor to many human diseases, including cancer. Macrophages are often considered as key components of sites of inflammation and tumour microenvironments. The functions of macrophages are closely related to their polarization. M1‐like macrophages contribute to inflammation 24 , 25 by releasing high levels of pro‐inflammatory cytokines, including TNF‐α and IL‐6. 26 In contrast, M2‐like macrophages can prevent inflammation 27 , 28 and express high levels of mannose receptor (CD206), CD163, 29 IL‐10 and arginase‐1. 30
Prostaglandins are endogenous substance with extensive biological activities, which are derived from C20 polyunsaturated fatty acids. According to the number of double bonds in the fatty acid side chains, the prostaglandins are divided into 1, 2 and 3 series prostaglandins. Prostaglandin‐1, −2 and −3 are derived from dihomo‐γ‐linolenic acid (DHLA), arachidonic acid (AA) and eicosapentaenoic acid (EPA), respectively. 31 , 32 It is reported that the 3‐series prostaglandins tend to have anti‐inflammatory and anti‐tumour effects. 10 , 33 , 34 In our research, we found that Prostaglandin E3, as a classic 3‐series prostaglandins, can regulate the polarization of M1 and M2a macrophages by inhibiting M1 and promoting M2a macrophage polarization, supporting its proposed anti‐inflammatory effects.
Macrophages are a major component of tumour‐infiltrating inflammatory cells, 21 , 35 and TAMs contribute to tumour progression at different levels. 36 Previous studies reported that some anti‐inflammatory and anti‐cancer effects of EPA are mediated by PGE3 production, 13 , 37 but the mechanisms are unclear. Our study revealed that PGE3 acts on macrophages directly rather than on tumour cells in the co‐culture system. This result was confirmed in vivo. These findings suggest that the anti‐tumorigenic effects of EPA are at least partly because of its conversion to PGE3, and that PGE3 exerts its anti‐tumorigenic effects during many stages of tumour development.
Studies have shown that newly formed PGs exert their functions by binding to their receptors 38 ; however, although the receptor for PGE2 is well‐defined, information on the receptor for PGE3 remains limited. Some evidence suggests that PGE3 shares the same EP receptor system with PGE2 but in these molecules, they have different binding affinities and potencies. 10 The cognate receptors EP1, EP2, EP3 and EP4 11 , 33 are coupled to different G proteins and use different second messenger signalling pathways. 39 EP1 is coupled to Gq/p and induces activation of protein kinase C through by mobilizing intracellular calcium, whereas EP2 and EP4 are coupled with Gs proteins and induce the expression of cAMP, leading to PKA regulation. EP3, however, is typically coupled to Gi proteins and inhibits cAMP. Our study showed that all EP receptors, except for EP3, were expressed in THP‐1 cells. Moreover, we founded that only the antagonist of EP4 receptor could stop the polarization by PGE3. We also found that both phosphorylated and total PKA in M1 and M2a macrophages were increased by PGE3. These results suggest that PGE3 activates a signalling pathway through the EP4 receptor.
Macrophage polarization and functions are tightly regulated by several interconnected pathways. 40 Among these, activation of STAT1 and STAT3/STAT6 has been demonstrated to play a crucial role, 41 , 42 , 43 with the downstream effector KLF‐4 promoting M2 macrophage functions. 44 Previous studies have linked the CREB/Kruppel‐like factor 4 pathway to macrophage polarization and reported that PGE2 can promote M2 polarization through a cAMP/PKA/CREB‐dependent pathway. 12 , 45 Thus, PGE3 may influence macrophage polarization via an EP/PKA‐dependent pathway to achieve anti‐inflammatory and anti‐tumorigenic effects. However, the mechanisms underlying TAM polarization remain unclear. Although we did not identify the factor(s) initiating TAM polarization, there was a slight increase in PKA levels in TAM; therefore, additional studies are needed to explore how PKA activation contributes to this polarization. We also found that PGE3, as well as the PKA inhibitor H‐89, can partially blunt TAM polarization. These results suggest that PKA activation influences TAM polarization, but the effect of PGE3 may be multi‐targeted. As the co‐culture system is complex, multiple factors likely influence the differentiation of TAMs, and identifying these factors will be the focus of our future experiments.
Given that prostaglandins are natural ligands of peroxisome proliferator‐activated receptor (PPAR) γ, which plays a crucial role in the development of inflammation 46 , 47 and differentiation of macrophage, 48 we determined the effect of PPAR‐γ activation on macrophage polarization. Our results showed that the activation of PPAR‐γ (induced by Rosiglitazone) had little effect on the polarization of macrophage induced by PGE3 (Figure S4). However, PPAR‐γ may have anti‐inflammation effect by reducing inflammatory factors produced by macrophage.
5. CONCLUSIONS
Our findings reveal a novel mechanism through which eicosanoids can influence tumorigenesis. Specifically, PGE3 can influence the macrophage polarization to resolve inflammation and inhibit prostate tumour growth.
CONFLICT OF INTEREST
The authors declared that they have no conflicts of interest to this work.
AUTHOR CONTRIBUTIONS
Jing Cui: Conceptualization (equal); Data curation (lead); Formal analysis (lead); Investigation (lead); Methodology (lead); Resources (equal); Software (equal); Visualization (equal); Writing‐original draft (lead). Kai Shan: Project administration (lead); Software (supporting); Validation (equal); Writing‐review & editing (equal). qin yang: Methodology (equal); Visualization (equal). Yumin Qi: Formal analysis (equal); Methodology (equal); Resources (equal); Visualization (equal). Hongyan Qu: Software (supporting); Visualization (equal). jiaqi Li: Data curation (equal). Rong Wang: Methodology (supporting). lingling jia: Resources (supporting); Software (supporting). wei chen: Funding acquisition (supporting); Resources (supporting). Ninghan Feng: Conceptualization (equal); Resources (equal); Supervision (equal); Validation (equal); Writing‐review & editing (equal). Yong Q. Chen: Conceptualization (lead); Funding acquisition (lead); Project administration (equal); Validation (equal); Visualization (equal); Writing‐original draft (equal); Writing‐review & editing (lead).
ETHICAL APPROVAL
All procedures were approved by the ethics committee of Jiangnan University (protocol number: JN.NO20191030b048130[289] and JN. No20191115c1081230[306]).
Supporting information
Fig S1‐S4
ACKNOWLEDGEMENTS
This research was supported by the National Key Research and Development Program of China (2017YFD0400200), The National Natural Science Foundation of China Grants No. 31471128 and 31771539, Key Research and Development Program of Jiangsu Province (BE2018624) and National First‐class Discipline Program of Food Science and Technology (JUFSTR20180101). We would like to thank Editage (www.editage.cn) for English language editing.
Cui J, Shan K, Yang Q, et al. Prostaglandin E3 attenuates macrophage‐associated inflammation and prostate tumour growth by modulating polarization. J Cell Mol Med. 2021;25:5586–5601. 10.1111/jcmm.16570
DATA AVAILABILITY STATEMENT
The data used to support this study are available from the corresponding author upon request.
REFERENCES
- 1. Mantovani A, Sica A, Sozzani S, Allavena P, Vecchi A, Locati M. The chemokine system in diverse forms of macrophage activation and polarization. Trends Immunol. 2005;25(12):677‐686. [DOI] [PubMed] [Google Scholar]
- 2. Romagnani S. Th1/Th2 cells. Inflamm Bowel Dis. 1999;5(4):285‐294. [DOI] [PubMed] [Google Scholar]
- 3. Romagnani S. T‐cell subsets (Th1 versus Th2). Ann Allergy Asthma Immunol. 2000;85(1):9‐21. [DOI] [PubMed] [Google Scholar]
- 4. Zeldin D. Epoxygenase pathways of arachidonic acid metabolism. J Biol Chem. 2001;276(39):36059‐36062. [DOI] [PubMed] [Google Scholar]
- 5. Imig JD, Hammock BD. Soluble epoxide hydrolase as a therapeutic target for cardiovascular diseases. Nat Rev Drug Discovery. 2009;8(10):794‐805. [DOI] [PMC free article] [PubMed] [Google Scholar]
- 6. Parente L, Rosa MD. Prostaglandins and inflammation. Pol J Pharmacol Pharm. 1980;31(5):153‐190. [Google Scholar]
- 7. Choudhry MA, Ahmed Z, Sayeed MM. PGE2‐mediated inhibition of T cell p59fyn is independent of cAMP. Am J Physiol Cell Physiol. 1999;277(2):C302‐C309. [DOI] [PubMed] [Google Scholar]
- 8. Garrone P, Galibert L, Rousset F, Fu SM, Banchereau J. Regulatory effects of prostaglandin E2 on the growth and differentiation of human B lymphocytes activated through their CD40 antigen. Journal of Immunology. 1994;152(9):4282‐4290. [PubMed] [Google Scholar]
- 9. Brown DM, Warner GL, Alés‐Martínez J, Scott DW, Phipps RP. Prostaglandin E2 induces apoptosis in immature normal and malignant B lymphocytes. Clin Immunol Immunopathol. 1992;63(3):221‐229. [DOI] [PubMed] [Google Scholar]
- 10. Hawcroft G, Loadman PM, Belluzzi A, Hull MA. Effect of eicosapentaenoic acid on E‐type prostaglandin synthesis and EP4 receptor signaling human colorectal cancer cells 1,2. Neoplasia. 2010;12(8):618‐627. [DOI] [PMC free article] [PubMed] [Google Scholar]
- 11. Masayuki W, Chieko Y, Toshihisa H, et al. Purification and characterization of recombinant human prostacyclin synthase. J Biochem. 2004;135(4):455‐463. [DOI] [PubMed] [Google Scholar]
- 12. Luan B, Yoon Y‐S, Le Lay J, Kaestner KH, Hedrick S, Montminy M. CREB pathway links PGE2 signaling with macrophage polarization. Proc Natl Acad Sci. 2015;112(51):15642‐15647. [DOI] [PMC free article] [PubMed] [Google Scholar]
- 13. Yang P, Cartwright C, Chan D, et al. Anticancer activity of fish oils against human lung cancer is associated with changes in formation of PGE2 and PGE3 and alteration of Akt phosphorylation. Mol Carcinog. 2014;53(7):566‐577. [DOI] [PMC free article] [PubMed] [Google Scholar]
- 14. Wada M, DeLong CJ, Hong YH, et al. Enzymes and receptors of prostaglandin pathways with arachidonic acid‐derived versus eicosapentaenoic acid‐derived substrates and products. J Biol Chem. 2007;282(31):22254‐22266. [DOI] [PubMed] [Google Scholar]
- 15. Funahashi H, Satake M, Hasan S, et al. Opposing Effects of n‐6 and n‐3 polyunsaturated fatty acids on pancreatic cancer growth. Pancreas. 2008;36(4):353‐362. [DOI] [PubMed] [Google Scholar]
- 16. Genin M, Clement F, Fattaccioli A, Raes M, Michiels C. M1 and M2 macrophages derived from THP‐1 cells differentially modulate the response of cancer cells to etoposide. BMC Cancer. 2015;15(1):577. [DOI] [PMC free article] [PubMed] [Google Scholar]
- 17. Weischenfeldt J, Porse B. Bone marrow‐derived macrophages (BMM): isolation and applications. Csh Protoc. 2008;2008(12):pdb.prot5080‐pdb.prot5080. [DOI] [PubMed] [Google Scholar]
- 18. Livak KJ, Schmittgen TD. Analysis of relative gene expression data using real‐time quantitative PCR. Methods. 2002;25(4):402‐408. [DOI] [PubMed] [Google Scholar]
- 19. Harris SG, Padilla J, Koumas L, Ray D, Phipps RP. Prostaglandins as modulators of immunity. Trends Immunol. 2002;23(3):144‐150. [DOI] [PubMed] [Google Scholar]
- 20. Fei F, Lee KM, Mccarry BE, Bowdish DME. Age‐associated metabolic dysregulation in bone marrow‐derived macrophages stimulated with lipopolysaccharide. Sci Rep. 2016;6:22637. [DOI] [PMC free article] [PubMed] [Google Scholar]
- 21. Noy R, Pollard JW. Tumor‐associated macrophages: from mechanisms to therapy. Immunity. 2014;41(1):49‐61. [DOI] [PMC free article] [PubMed] [Google Scholar]
- 22. Chao MP, Alizadeh AA, Tang C, et al. Anti‐CD47 antibody synergizes with rituximab to promote phagocytosis and eradicate non‐Hodgkin lymphoma. Cell. 2010;142(5):699‐713. [DOI] [PMC free article] [PubMed] [Google Scholar]
- 23. Peng X, Li J, Tan S, et al. COX‐1/PGE2/EP4 alleviates mucosal injury by upregulating β‐arr1‐mediated Akt signaling in colitis. Sci Rep. 2017;7(1):1055. [DOI] [PMC free article] [PubMed] [Google Scholar]
- 24. Anne B, Cyrile Anne C, Coralie S, Karine L, Alexandra M, Rudi B. Role of macrophage tissue infiltration in metabolic diseases. Curr Opin Clin Nutr Metab Care. 2005;8(4):347‐354. [DOI] [PubMed] [Google Scholar]
- 25. Odegaard JI, Ricardo‐Gonzalez RR, Red Eagle A, et al. Alternative M2 activation of kupffer cells by PPARδ ameliorates obesity‐induced insulin resistance. Cell Metab. 2008;7(6):496‐507. [DOI] [PMC free article] [PubMed] [Google Scholar]
- 26. Sica A, Mantovani A. Macrophage plasticity and polarization: in vivo veritas. J Clin Invest. 2012;122(3):787‐795. 10.1172/JCI59643 [DOI] [PMC free article] [PubMed] [Google Scholar]
- 27. Odegaard JI, Ricardo‐Gonzalez RR, Goforth MH, et al. Macrophage‐specific PPARγ controls alternative activation and improves insulin resistance. Nature. 2007;447(7148):1116‐1120. [DOI] [PMC free article] [PubMed] [Google Scholar]
- 28. Odegaard JI, Chawla A. Mechanisms of macrophage activation in obesity‐induced insulin resistance. Nat Clin Pract Endocrinol Metab. 2008;4(11):619‐626. [DOI] [PMC free article] [PubMed] [Google Scholar]
- 29. Martinez FO, Helming L, Gordon S. Alternative activation of macrophages: an immunologic functional perspective. Annu Rev Immunol. 2009;27(1):451‐483. [DOI] [PubMed] [Google Scholar]
- 30. Galván‐Peña S, O'Neill LA. Metabolic reprogramming in macrophage polarization. Front Immunol. 2014;5:420. [DOI] [PMC free article] [PubMed] [Google Scholar]
- 31. Noverr MC, Erb‐Downward JR, Huffnagle GB. Production of eicosanoids and other oxylipins by pathogenic eukaryotic microbes. Clin Microbiol Rev. 2003;16(3):517‐533. [DOI] [PMC free article] [PubMed] [Google Scholar]
- 32. Marks, F . Arachidonic acid and companions: an abundant source of biological signals. In: Marks F, Furstenberger G, eds. Prostaglandins, Leukotrienes and Other Eicosanoids: From biogenesis to clinical application. Weinheim:Wiley‐VCH; 1999:1‐40. [Google Scholar]
- 33. Hegde S, Kaushal N, Ravindra KC, et al. Δ12‐prostaglandin J3, an omega‐3 fatty acid‐derived metabolite, selectively ablates leukemia stem cells in mice. Blood. 2011;118(26):6909‐6919. [DOI] [PMC free article] [PubMed] [Google Scholar]
- 34. Fan YY, Davidson LA, Callaway ES, Goldsby JS, Chapkin RS. Differential effects of 2‐ and 3‐series E‐prostaglandins on in vitro expansion of Lgr5+ colonic stem cells. Carcinogenesis. 2014;35(3). [DOI] [PMC free article] [PubMed] [Google Scholar]
- 35. Nielsen SR, Schmid MC. Macrophages as key drivers of cancer progression and metastasis. Mediators Inflamm. 2017;2017:11. [DOI] [PMC free article] [PubMed] [Google Scholar]
- 36. Mantovani A, Marchesi F, Malesci A, Laghi L, Allavena P. Tumour‐associated macrophages as treatment targets in oncology. Nat Rev Cancer Clin Oncol. 2017;14(7):399‐416. [DOI] [PMC free article] [PubMed] [Google Scholar]
- 37. Yang P, Jiang Y, Fischer SM. Prostaglandin E 3 metabolism and cancer. Cancer Lett. 2014;348(1–2):1‐11. [DOI] [PMC free article] [PubMed] [Google Scholar]
- 38. Smith W, Murphy R. The Eicosanoids: Cyclooxygenase, Lipoxygenase, and Epoxygenase Pathways. In: Vance D, Vance J, eds. Biochemistry of Lipids, Lipoproteins and Membranes. Amsterdam: Elsevier; 2002:341‐372. [Google Scholar]
- 39. Breyer RM, Bagdassarian CK, Myers SA, Breyer MD. Prostanoid receptors: subtypes and signaling. Annu Rev Pharmacol Toxicol. 2001;41(41):661‐690. [DOI] [PubMed] [Google Scholar]
- 40. Murray PJ. Macrophage polarization. Annu Rev Physiol. 2016;79(1):541‐566. [DOI] [PubMed] [Google Scholar]
- 41. Hu JCC, Brookings W, Aldridge MC. A case of solid pseudopapillary tumour of the pancreas and malignant mesothelioma. J Gastrointest Cancer. 2007;38(2–4):71‐73. [DOI] [PubMed] [Google Scholar]
- 42. Hong G, Jin D, Chen X. Lipocalin 2 is a regulator of macrophage polarization and NF‐κB/STAT3 pathway activation. Mol Endocrinol. 2014;10:10. [DOI] [PMC free article] [PubMed] [Google Scholar]
- 43. Gong M, Zhuo X, Ma A. STAT6 upregulation Promotes M2 macrophage polarization to suppress atherosclerosis. Med Sci Monit Basic Res. 2017;23:240‐249. [DOI] [PMC free article] [PubMed] [Google Scholar]
- 44. Liao X, Sharma N, Kapadia F, et al. Krüppel‐like factor 4 regulates macrophage polarization. J Clin Invest. 2011;121(7):2736‐2749. [DOI] [PMC free article] [PubMed] [Google Scholar]
- 45. Montero J, Gómez‐Abellán V, Arizcun M, Mulero V, Sepulcre MP. Prostaglandin E2 promotes M2 polarization dsssof macrophages via a cAMP/CREB signaling pathway and deactivates granulocytes in teleost fish. Fish Shellfish Immunol. 2016;55:632‐641. [DOI] [PubMed] [Google Scholar]
- 46. Tontonoz P, Nagy L, Alvarez J, Thomazy VA, Evans RM. PPARgamma promotes monocyte/macrophage differentiation and uptake of oxidized LDL. Cell. 1998;93(2):241‐252. [DOI] [PubMed] [Google Scholar]
- 47. Gervois P, Torra IP, Fruchart JC, Staels B. Regulation of lipid and lipoprotein metabolism by PPAR activators. Clin Chem Lab Med. 2000;38(1):3‐11. [DOI] [PubMed] [Google Scholar]
- 48. Moore KJ, Rosen ED, Fitzgerald ML, et al. The role of PPAR‐gamma in macrophage differentiation and cholesterol uptake. Nat Med. 2001;7(1):41‐47. [DOI] [PubMed] [Google Scholar]
Associated Data
This section collects any data citations, data availability statements, or supplementary materials included in this article.
Supplementary Materials
Fig S1‐S4
Data Availability Statement
The data used to support this study are available from the corresponding author upon request.


