

Abstract
Background
Epidemiological studies and meta-analyses show an association between statin use and a reduced incidence of colorectal cancer (CRC). We have shown that statins act on CRC through bone morphogenetic protein (BMP) signalling, but the exact cellular targets and underlying mechanism of statin action remain elusive. In this study, we set out to assess the influence of statins on global cancer cell signalling by performing an array-based kinase assay using immobilised kinase substrates spanning the entire human kinome.
Methods
CRC cells with or without Lovastatin treatment were used for kinome analysis. Findings on kinome arrays were further confirmed by immunoblotting with activity-specific antibodies. Experiments in different CRC cell lines using immunoblotting, siRNA-mediated knockdown and treatment with specific BMP inhibitor Noggin were performed. The relevance of in vitro findings was confirmed in xenografts and in CRC patients treated with Simvastatin.
Results
Kinome analysis can distinguish between non-specific, toxic effects caused by 10 µM of Lovastatin and specific effects on cell signalling caused by 2 µM Lovastatin. Statins induce upregulation of PTEN activity leading to downregulation of the PI3K/Akt/mTOR signalling. Treatment of cells with the specific BMP inhibitor Noggin as well as PTEN knockdown and transfection of cells with a constitutively active form of AKT abolishes the effect of Lovastatin on mTOR phosphorylation. Experiments in xenografts and in patients treated with Simvastatin confirm statin-mediated BMP pathway activation, activation of PTEN and downregulation of mTOR signalling.
Conclusions
Statins induce BMP-specific activation of PTEN and inhibition of PI3K/Akt/mTOR signalling in CRC.
Subject terms: Colorectal cancer, Translational research, Molecular medicine
Background
Colorectal cancer (CRC) is a major public health problem worldwide. According to the GLOBOCAN 2018 data, CRC is the fourth most diagnosed cancer with nearly 1.8 million new cases and 881,000 deaths in 2018.1 Despite improvements in treatment, advanced disease remains incurable and hopes to achieve reductions in mortality are pinned on nationwide screening programmes aimed at early detection and prevention. Colonoscopy screening is the foundation of CRC prevention, but it does not offer complete protection.2–4
Chemoprevention represents a promising adjuvant strategy.5,6 The use of 3-hydroxy-3-methylglutaryl coenzyme-A reductase inhibitors (statins) in CRC chemoprevention is highly debated. Epidemiological studies and meta-analyses have shown mixed results regarding the effectiveness of statins in reducing CRC incidence.1,7–10
Statins, however, remain attractive candidates for use in chemoprevention as they are generally well tolerated and have proven beneficial effects on cardiovascular outcomes.11–13 Their exact cellular targets and underlying mechanism of action in CRC are largely unknown. Moreover, many in vitro studies have been performed with high, non-physiological drug concentrations raising the question as to whether the changes shown are specific and represent true mechanisms of statin action or are a non-specific result of toxic concentrations of statins on cellular metabolism.14
We have previously shown that statins act on CRC through activation of the bone morphogenetic protein (BMP) signalling pathway.15,16 We have also shown that statin use is associated with a reduced CRC mortality especially in patients whose tumours have intact BMP signalling.17 How statin-dependent activation of BMP signalling influences CRC cells remains unknown.18,19 Kinome profiling using array-based kinase assays has been previously used to comprehensively assess changes in signal transduction in various cell systems, including cancer.20,21
In this study, we assessed the influence of statins on global cell signalling in a hypothesis-free manner. To create a full picture of the activity of different signalling pathways after statin treatment, we performed an array-based kinase assay using immobilised kinase substrates spanning the entire human kinome.22,23 From patterns of substrate phosphorylation, we used established algorithms to deduce global cellular kinase activity in human CRC cells with or without Lovastatin treatment.
We show that statin treatment leads to widespread changes in kinase activity in cancer cells compatible with anti-tumour activity with most pronounced effects on phosphoinositide-3 kinase (PI3K)/AKT/mammalian target of rapamycin (mTOR) signalling. We further confirm these data by a series of in vitro experiments and show that the inhibiting effect of statins on the AKT/mTOR pathway occurs via phosphatase and tensin homologue (PTEN) in a BMP-dependent manner. Finally, experiments in xenografts and in patients with CRC treated with statins confirm that the changes in the BMP pathway and downregulation of phospho-mTOR seen cell lines in vitro also occur in tumours in vivo.
Methods
Cell culture
HCT116, RKO and HT29 colon cancer cell lines were obtained from the American Type Culture Collection. HCT116 SMAD4−/− cells were the kind gift of Dr. B. Vogelstein (Johns Hopkins University, Baltimore, MD, USA). Cells were cultured in Dulbecco’s Modified Eagle Medium (Life Technologies, Breda, the Netherlands) containing 4.5 g/L glucose and L-glutamine, penicillin (50 U/mL) and streptomycin (50 μg/mL) (Life Technologies), and 10% foetal calf serum (Life technologies). Cells were grown in monolayers at 37 °C under a humidified 5% CO2 atmosphere. Lovastatin (M2147, Sigma Aldrich, Zwijndrecht, Netherlands) was dissolved in 100% Ethanol (Sigma-Aldrich) and Noggin-Fc (719-NG, R&D Systems Europe Ltd, Abingdon, UK) was dissolved in sterile phosphate-buffered saline (PBS) and both were stored in 500 μL aliquots at −20 °C until required.
Phosphoproteome determination
Cells were trypsinised on ice, spun down and washed in PBS. Cells were lysed in a non-denaturing complete lysis buffer (20 mmol/L Tris-HCl, pH 7.5, 150 mmol/L NaCl, 1 mmol/L Na2EDTA, 1 mmol/L EGTA, 1% Triton X-100, 2.5 mmol/L sodium pyrophosphate, 1 mmol/L MgCl2, 1 mmol/L beta-glycerophosphate, 1 mmol/L Na3VO4, 1 mmol/L NaF, 1 μg/mL leupeptin, 1 μg/mL aprotinin, 1 mmol/L phenylmethylsulphonyl fluoride) and the volume of the cell lysate was equalised with distilled H2O. Activation mix (10 μL), containing 50% glycerol, 50 μM ATP, 60 mm MgCl2, 0.05% (vol/vol) Brij-35, 0.25 mg/mL bovine serum albumin and 2000 μCi/mL γ-33P-ATP was added to 60 μL cell lysate. The peptide arrays (Pepscan, Lelystad, the Netherlands), containing triplicates of 1024 different kinase substrates (992 substrates, 32 controls), were incubated with the cell lysates for 2 h in a humidified stove at 37 °C plus 2000 μCi/mL 33P-γ-ATP or 33P-α-ATP (control for non-covalent-specific binding).24
Subsequently, the arrays were washed twice with Tris-buffered saline (TBS) with 0.1% Tween-20, twice in 2 mol/L NaCl, twice in demineralised H2O, and then air-dried. The arrays were exposed to a phospho-imaging screen for 72 h and scanned on a phospho-imager (Storm™, Amersham-Biosciences, Uppsala, Sweden).
Analysis of peptide array
Spot density and background were analyzed using Scanalyze (http://rana.lbl.gov/EisenSoftware). Spot intensities were normalised to the 90th percentile (The 5 and 95% intervals of the spot density were calculated for each data set, and all spots were normalised within these boundaries so that the 5 and 95% levels are given the values 0 and 100, respectively). The Spearman correlation coefficient was calculated for each combination of sets and clustering was performed using Johnson hierarchical clustering schemes.25 For each peptide, the average and standard deviation of phosphorylation was determined and plotted in an amplitude-based hierarchical fashion. Background phosphorylation of the array was determined from the exponent describing the amplitude behaviour of the 500 least phosphorylated peptides (which are assumed not to contain phosphorylation derived from a relevant biological signal). Peptides of which the average phosphorylation minus 1.96 times the standard deviation was higher than background were considered to represent true phosphorylation events (p < 0.05). Peptide sets that showed statistically significant changes compared to the background were subsequently subjected to elective Markov analysis (Tables S1A and S1B). Kinase activities in lysates from cells incubated with or without Lovastatin were determined by significant fold change ratios of the combined values of phosphorylated peptides resembling a substrate for kinase activity.
Significance analysis was performed using a minimal modification for the algorithm originally developed for microarray analysis (http://www-stat.stanford.edu/~tibs/SAM/).25
Immunoblotting
Cells at 60–80% confluence from 6-well plates (Greiner, Alphen a/d Rijn, the Netherlands) were washed in ice-cold PBS and scraped into 200 μL of cell lysis buffer (Cell Signaling, Leiden, the Netherlands) containing a protease inhibitor cocktail (MP-Biochemicals, Illkirch, France). Protein concentration was measured using the RC DC protein assay kit (Bio-Rad, CA, USA) according to the manufacturer’s instructions, and the protein concentrations of the samples were equalised accordingly. Samples were diluted in 3× sample buffer (125 mmol/L Tris/HCl, pH 6.8; 4% sodium dodecyl sulfate (SDS); 2% β-mercaptoethanol; 20% glycerol, 1 mg bromophenol blue), sonicated and then heated at 95 °C for 5 min. Fifty micrograms of protein from each sample was loaded onto SDS–polyacrylamide gel electrophoresis and blotted onto polyvinylidene difluoride membrane (Millipore, MA, USA). The blots were either immersed in methanol for 10 s and blocked by air drying for 1 h at room temperature or incubated in blocking buffer (TBST [Tris-buffered saline with 0.05% Tween] with 5% low-fat milk powder) for 1 h. The membranes were subsequently washed 3 × 10 min in TBST before overnight incubation at 4 °C with primary antibody in primary antibody buffer (TBST with 0.2% low-fat milk powder). Blots were washed 3 × 10 min in TBST and incubated for 1 h at room temperature in the appropriate secondary antibody (1:1000) (Dako, Glostrup, Denmark) in blocking buffer. After 3 × 10 min washing in TBST, blots were incubated with Lumi-light (Roche, Woerden, the Netherlands), and chemiluminescence was detected using a VersaDoc imaging system (Bio-Rad).
Antibodies: AKT, p-Akt, p-mTOR, mTOR, p-PTEN, PTEN, p70-S6K, p-Ask1, p-MAPK-p38, p-MAPK-JNK, p-AMPK, and BMP2 were purchased from Cell Signaling Technology, Inc. (Boston, MA, USA); β-Actin from Santa Cruz Biotechnology Inc. (Santa Cruz, CA, USA).
Western blot quantification was calculated using ImageJ (NIH, Bethesda, MD, USA). Mean grey values for each band were measured, subsequently the background was subtracted and the band intensity was corrected using loading controls (Actin, PTEN or mTOR). The experimental control condition value was set to 1. The quantification of the western bots can be found in Supplementary Data.
Luciferase reporter assay
Transcriptional activity of BMP was measured by transfection of BRE-Luciferase. Transfection efficiency was corrected by co-transfection of a CMV promoter-driven Renilla luciferase vector (Promega, Leiden, the Netherlands). Transfections were performed using Lipofectamine 2000 (Invitrogen). Luciferase activity was measured using the Dual-Glo Luciferase Assay System (Promega) on a Luminometer (Berthold Technologies, Bad Wildbad, Germany).
RNA interference
Cells were plated in 12-well plates and treated with small interfering RNA (siRNA) for PTEN or scrambled control siRNA (Cell Signaling, Boston, MA, USA) using DharmaFECT 2 (Dharmacon, Epsom, UK) as described by the manufacturer for 48 h. Immunoblotting was performed for efficiency control.
RNA isolation and cDNA synthesis
For isolation of RNA from cells, we used the RNeasy Kit (Qiagen, Netherlands) according to the manufacturer’s protocol. Complementary DNA was made using the RevertAid M-MµLV Reverse Transcriptase (Fermentas, St-Leon-Rot, Germany) according to the manufacturer’s protocol.
Immunohistochemistry
Formalin-fixed, paraffin-embedded tissue blocks were sectioned (4 μm), deparaffinised, immersed in 0.3% H2O2 in methanol for 30 min and heat treated at 100 °C (pH 6.0) for 20 min. Sections were blocked with TENG-T (10 mmol/L Tris, 5 mmol/L ethylenediaminetetraacetic acid, 0.15 mol/L NaCl, 0.25% gelatine, 0.05% (vol/vol) Tween 20, pH 8.0) for 30 min. Slides were incubated with primary antibodies to pSMAD1,5,8 (1:50), pPTEN (1:50) and to pmTOR (1:50) overnight at 4 °C. The LSAB + System-HRP (Dako) was used to visualise the antibody-binding sites. Peroxidase activity was detected with 3.3-diaminobenzidine tetrahydrochloride (Sigma-Aldrich). Sections were counterstained with haematoxylin (Sigma-Aldrich). All stainings were evaluated by experienced pathologists (L.L.K./H.M.). Finally, the stains were analysed using the ImageJ software.26
Xenograft mouse model
Mice were allocated randomly. Two groups of 8 female NMRI nu/nu mice were injected subcutaneously in the flank with 1 × 10⁶ HCT116 cells or with 5 × 10⁶ HT29 cells in Matrigel (BD Bioscience, Breda, Netherlands). Mice were fed ad libitum with food containing Simvastatin (Arie-Blok-BV, Woerden, Netherlands), thereby receiving 50 mg/kg/day for 3 weeks, initiated when the tumour volume reached 100–200 mm3. Mice were sacrificed using cervical dislocation. After the mice had been sacrificed, the tumours were harvested and embedded into paraffin blocks. Simvastatin was chosen as it is the second most potent statin in our in vitro experiments15 and is licensed for use in humans in the Netherlands, whereas Lovastatin is not.
Selection of patient material
Four patients newly diagnosed with CRC by endoscopy were treated with 40 mg Simvastatin for 21 days after which elective surgery was performed. Biopsies of the tumour taken during initial endoscopy and tumour tissue collected immediately after surgical removal were formalin fixed and embedded in paraffin for further analyses. All patients had no previous history of CRC, had never used any statin or used any nonsteroidal anti-inflammatory drug (NSAID) during diagnosis or within the previous 6 months. The study was approved by the LUMC Medical Ethics Committee.
Statistical analysis
Statistical analysis was performed using two-tailed Student’s t test, and p < .05 was considered statistically significant. Asterisks indicate a significant difference between two groups (*p < 0.05; **p < 0.005). All experiments were done with a minimum of three independent experiments. Data are shown as mean ± SEM.
Results
The clinically relevant concentration of 2 µM of Lovastatin is optimal for analysis of statin-induced signal transduction
It is not well known whether the high concentrations of statins that are often used in vitro studies are relevant and reflect the real changes that occur in vivo. Previous in vitro studies have used doses between 0.1 and 667 µM,27–29 while concentrations between 0.1 and 2 µM have been measured in serum of patients treated with statins.30 Statins seem to have rapid dose-dependent effects on cellular signalling and apoptosis observed within 24 h of treatment, while effects on gene expression were mainly observed after 72 h of treatment.16 However, at higher doses and with longer treatment statins also lead to extensive cell death, which is probably not only due to specific statin-mediated effects but also non-specific toxic effects.
HCT116 cells were treated with different Lovastatin concentrations (0.2, 2 and 10 µM) and cell viability was assessed at various time points. MTT (3-[4,5-dimethylthiazol-2-yl]-2,5 diphenyl tetrazolium bromide) analysis shows no changes in cell viability after 24 h of treatment with 0.2 and 2 µM of Lovastatin, but significant reduction in cell viability is observed after 24 h when a concentration of 10 µM is used. After 48 h of exposure, reduced viability is observed in cells treated with 2 and 10 µM of Lovastatin. After 72 h of treatment, 0.2, 2 and 10 µM of Lovastatin induce significant reduction in viability (Fig. 1).
Fig. 1. HCT116 colon cancer cells were treated with different concentrations of Lovastatin (0, 0.2, 2 and 10 µM) and cell viability was assessed at different time points using MTT assays.

Exposure with 0.2 and 2 µM Lovastatin for 24 h did not lead to a significant reduction in cell viability, but after 48 h 2 µM did show decreased cell viability. Exposure to 10 µM Lovastatin reduced cell viability after 24 h. Student t-tests were performed using the corrected means of the individual experiments (* < 0.05, ** < 0.001, *** < 0.001). Data is presented as mean ± SEM.
We chose to use 24-h exposure to 2 and 10 µM for further analysis to observe and compare the changes in kinome profiles between low- and high-concentration treatments. PepChip analysis after exposure to 10 µM Lovastatin for 24 h leads to chaotic changes in substrate phosphorylation. We see that the phosphorylation of several substrate targets of the same kinase move in different directions. Subsequent pathway analysis did not show any logical changes. Where increased kinase activity would be expected to lead to downstream kinase activation within the same pathway, our samples treated with 10 µM of Lovastatin show no consistent pattern (data not shown, available by request). In contrast, analysis of samples treated with 2 µM of Lovastatin for 24 h show consistent and logical changes described below (Figs. 2 and 3 and Supplementary Table 1). Kinome analysis may therefore represent a novel tool for differentiating between non-specific, toxic effects of an intervention and specific effects on cell signalling. Based on these observations, we used 2 µM of Lovastatin for 24 h for kinome profiling. In this timeframe, molecular processes responsible for statin-induced gene expression changes should be fully operational while minimising secondary knock-on effects due to the gene expression changes themselves.
Fig. 2. Phosphoproteome changes in CRC cells after statin treatment.

a Illustration of PepChip array analysis methodology. PepChip slides contain substrate motifs, which can be phosphorylated by kinases present in biological lysates. The intensity distribution of the resulting phosphorylation contains an aspecific component and a specific component. As illustrated by the depiction of a non-lysate-treated slide, the aspecific component can be described by first sorting substrates according to their intensity and then by the function y = a · ln(x) + b (in which x is the substrate number after amplitude-based sorting and y the resulting spot intensity). The values of a and b can be determined from a slide (including those treated with a biological lysate) by determining the exponent best describing the amplitude behaviour of the 500 least phosphorylated peptides (which are assumed not to contain phosphorylation derived from a relevant biological signal). Peptides of which the average phosphorylation minus 1.96 times the standard deviation is higher than background are considered to represent true phosphorylation events (p < 0.05) and are further analysed. The blue line shows the function describing the aspecific signal on this PepChip. The red circle shows multiple peptides that represent true phosphorylation events. b Representative results from phospho-imager analysis of PepChip arrays incubated with lysate from HCT116 cells treated with vehicle control versus 2 µM Lovastatin for 24 h or vehicle control. c Venn diagram to summarise the changes in phosphorylated substrates in HCT116 cells with and without Lovastatin treatment. Treatment with Lovastatin not only leads to an overall reduction in phosphorylation but also to changes in which substrates are phosphorylated. In HCT116 cells without Lovastatin treatment, 222 substrates are significantly phosphorylated. Lovastatin-treated cells have 150 significantly phosphorylated substrates. Only 40 substrates are phosphorylated in both conditions.
Fig. 3. Signal transduction effects in CRC cells after statin treatment.

a HCT116 cells treated with Lovastatin or vehicle control. Kinase activity was deduced from the pattern of substrate phosphorylation. Using established algorithms, a signal transduction scheme was constructed. The numbers of the individual substrates on the array are shown next to the kinase and correspond to tables S1A and S1B. b HCT116 cells treated with Lovastatin or vehicle control. Immunoblotting was used to validate the kinome analysis. In the array, Lovastatin treatment showed the strongest effect on the PI3K/Akt/mTOR pathway. Immunoblot analysis confirmed the downregulation of AKT, mTOR and its downstream target 70S6K. c Immunoblot for p-PTEN and p-mTOR of HCT116 cells treated with Lovastatin for 0, 6, 12 or 24 h.
Statin treatment inhibits the PI3K/Akt/mTOR pathway
To analyse the actual changes in the phosphoproteome associated with Lovastatin treatment, we first determined the number of significantly phosphorylated substrates for each condition. This is done by calculating the average and standard deviation of the substrate phosphorylation for each peptide in each condition (vehicle control versus 2 µM) (full list of results in Supplementary Tables 1A and 1b) and plotting the values obtained in an amplitude-based hierarchical fashion (Fig. 2a). Whereas lysates of HCT116 cells not treated with Lovastatin phosphorylate a total of 222 peptide substrates, the lysates of the cells treated with 2 μM Lovastatin phosphorylate a total of 150 substrates (Fig. 2b and Table S1B). A Venn diagram was constructed to summarise the changes in the phosphoproteome induced by Lovastatin (Fig. 2c).
Treated and untreated HCT116 cells phosphorylate only 40 common substrates, phosphorylation of the other substrates being unique to either vehicle-treated cells or Lovastatin-treated cells. Using established algorithms, kinase activity was deduced from the pattern of substrate phosphorylation and used to construct provisional signal transduction schemes to detail the effects of Lovastatin on colon cancer cell signal transduction (Fig. 3a). The strongest effect of statin treatment is seen on the PI3K/Akt pathway and its downstream target mTOR. Immunoblotting using phosphorylation-specific antibodies was used to validate the major changes seen with the kinome analysis (Fig. 3b) and confirmed the downregulation of the phosphorylation level of AKT, mTOR and its downstream target 70S6K. Figure 3c shows a time-dependent effect of lovastatin treatment on p-PTEN and p-mTOR levels. Western blot quantification of Figs. 3–5 can be found Supplementary Fig. 1. Supplementary Fig. 2 shows that the effect of Simvastatin on p-mTOR in HCT116 cells is similar to Lovastatin.
Fig. 5. The effects of statin treatment in CRC cells on the AKT/mTOR pathway are BMP dependent.

a HCT116 cells treated with Lovastatin or control and subsequently transfected with BRE-luc to measure BMP transcriptional activity. b Immunoblot for BMP2 of HCT116 cells treated with Lovastatin for 0, 6, 12 or 24 h. c Immunoblots for p-PTEN, p-mTOR and p70S6K of HCT116 cells treated with the BMP ligand inhibitor Noggin prior to treatment with Lovastatin or vehicle control. β-Actin was used as a loading control. Noggin treatment leads to an increase in phosphorylation of PTEN and a slight increase in phosphorylation of mTOR and its downstream target p70S6K. The inhibitory effect of Lovastatin on PTEN and mTOR phosphorylation is abolished by Noggin treatment. d Immunoblots for p-PTEN and p-mTOR in RKO and HT29 cells with or without Lovastatin treatment. β-Actin was used as a loading control.
Statin induced inhibition of the Akt/mTOR pathway is PTEN dependent
Statin treatment strongly downregulates the activity of the PI3K/Akt/mTOR signalling pathway, but in which manner this inhibition occurs could not be easily deduced from the kinome analysis. PTEN, a phosphatase of phosphatidylinositol-(3,4,5)-trisphosphate (PIP3), which functions as a negative regulator of the Akt/PKB signalling pathway, was also one of the proteins altered in phosphorylation upon statin treatment in kinome arrays (Table S1). Phosphorylation of PTEN induces a conformational change inhibiting attachment of the protein to the membrane thereby negatively regulating its function as a phosphatase.31–33 Immunoblot analysis of HCT116 cells shows a clear reduction of the amount of phosphorylated PTEN after treatment with Lovastatin, confirming the kinome data (Fig. 3b). To investigate whether the effect of statins on the mTOR pathway is mediated through PTEN and not by inhibition of mTOR itself, we transiently transfected HCT116 cells with siRNA targeted against PTEN or scrambled control siRNA and subsequently treated the cells with Lovastatin or vehicle control. Transfection with siRNA against PTEN leads to a strong increase in the amount of phosphorylated mTOR and also diminishes the inhibitory effect of statin treatment on mTOR phosphorylation (Fig. 4a).
Fig. 4. Statins act through PTEN to inhibition AKT/mTOR.
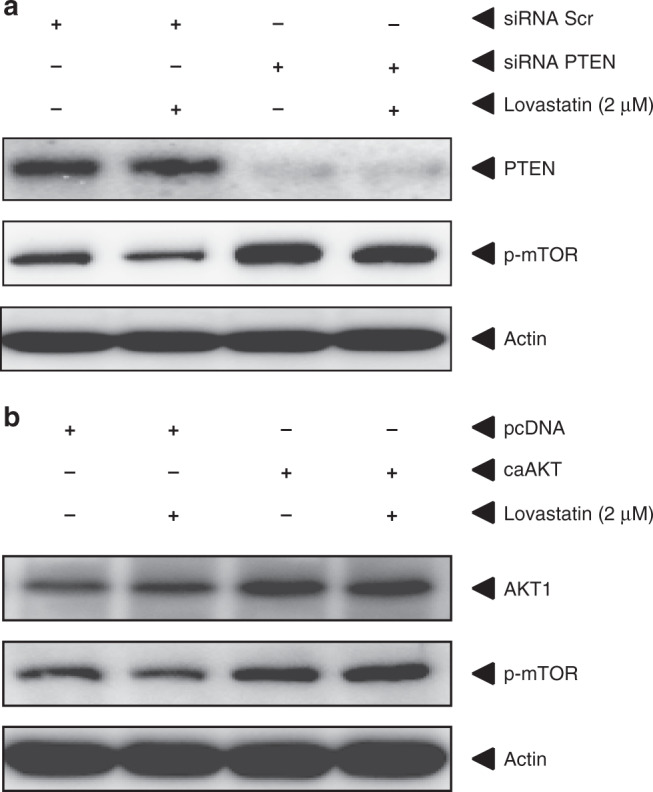
a Immunoblots for PTEN and p-mTOR of HCT116 cells transiently transfected with either siRNA targeted against PTEN or scrambled control siRNA and subsequently treated with Lovastatin or vehicle control. β-Actin was used as a loading control. Transfection with siRNA against PTEN leads to a significant knock-down of PTEN as shown by immunoblotting. siRNA against PTEN not only leads to an increase in phosphorylated mTOR but also diminishes the inhibitory effect of Lovastatin treatment on mTOR phosphorylation. b Immunoblots for AKT and p-mTOR of HCT116 cells transiently transfected with either a constitutive active form of AKT (ca-Akt) or control empty pcDNA and subsequently treated with Lovastatin or vehicle control. β-Actin was used as a loading control. Transfection with ca-Akt leads to an increase in Akt protein and mTOR phosphorylation but abrogates the inhibitory effect of Lovastatin treatment on mTOR phosphorylation.
The activity of AKT, which is directly upstream of mTOR, is controlled by its phosphorylation via PIP3. PTEN converts PIP3 back to PIP2 (phosphatidylinositol 4,5-diphosphate), thereby indirectly reducing AKT activity. To confirm that the inhibition of mTOR signalling is mediated through increasing PTEN activity and mediated via AKT, we transiently transfected HCT116 cells with a constitutively active form of AKT1 (ca-AKT) and subsequently tested the effect of Lovastatin treatment.34 After transfection with ca-AKT, statin treatment no longer results in reduced phosphorylation of mTOR (Fig. 4b), showing that statin treatment works upstream of AKT, most likely via PTEN.
Statin induced inhibition of the Akt/mTOR pathway is BMP dependent
The importance of BMP signalling in CRC has become apparent through the finding of BMPR1a mutations in Juvenile Polyposis and from genome-wide association studies.35,36 A link between BMPR1a and PTEN was discovered in Cowden Syndrome, an inherited hamartomatous polyposis syndrome, where mutations in either of these genes can lead to the same phenotype.37 Studies performed in breast cancer cells revealed that treatment with BMP caused increased levels of PTEN activity.38 Whether this applies to CRC is unknown. We have previously shown that statin treatment leads to an increase in BMP signalling. We confirm this by using the BRE-luc construct to measure BMP transcriptional activity (Fig. 5a). We and others have previously shown that statin can upregulate BMP2 expression.16 Figure 5b shows an increased expression of BMP2 after Lovastatin treatment of HCT116 cells. To investigate whether the effect of statins on PTEN is dependent on BMP signalling, we pre-treated colon cancer cells with the specific BMP inhibitor Noggin39 before treatment with Lovastatin and analysed the effect on the phosphorylation of PTEN and mTOR. As measured by immunoblotting, Noggin not only abolishes the decrease of PTEN phosphorylation induced by Lovastatin treatment but also leads to an upregulation of p-PTEN levels by itself (Fig. 5c). Blocking BMP leads to PTEN phosphorylation, which reduces PTEN activity. To avoid cell line bias, we repeated the essential experiments using two other CRC cell lines treated with Lovastatin. The colon cancer cell line RKO with intact canonical BMP signalling shows a strong reduction of mTOR phosphorylation after statin treatment. In contrast, HT29 shows no effect. HT29 is SMAD4 deficient thereby inactivating canonical BMP signalling. This cell line is also resistant to statin treatment in vitro and in vivo, as we have shown previously (Fig. 5d). To further confirm this, we treated HCT116 cells, which are SMAD4 positive, and HCT 116 SMAD4−/− with Lovastatin and only observed a reduction in p-mTOR in SMAD4-positive cells (Supplementary Fig. 2).
Statin treatment leads to increased BMP signalling and downregulation of mTOR phosphorylation in xenografts
As statins are usually given orally to patients, we performed an in vivo experiment using xenografts of HCT116 cells in nude mice receiving 3 weeks of oral statin treatment before they were sacrificed, and the tumours were analysed. We feel this is an improvement on previous studies, which have used intraperitoneal or intratumoural injection of statins to show effects on xenografts in mice. The effect of statin treatment on tumour size has been reported previously.16 In this study, we were interested whether oral administration of statins would influence mTOR signalling in xenografts. Immunohistochemical analysis of nuclear pSMAD1,5,8 in the xenografts revealed a significant increase in active BMP signalling in HCT116 xenografts (Fig. 6a, b), confirming our previous findings in vitro.15 As shown in Fig. 6a, b, PTEN phosphorylation and mTOR phosphorylation are decreased in HCT116 colon cancer cell xenografts after statin treatment.
Fig. 6. Statin treatment of patients and a xenograft mouse model.

a Immunohistochemistry for phospho-SMAD1,5,8, phospho-PTEN and phospho-mTOR of HCT116 xenografts from mice treated with Simvastatin or from control mice. The original magnification is ×20. b The percentage of cells with nuclear immunostaining for p-SMAD1,5,8-, cytoplasmic immunostaining for phospho-PTEN and cytoplasmic immunostaining for phospho-mTOR relative to all cells per ×20 image field in the HCT116 xenografts. Three images were scored for each xenograft. Error bars represent SEM (n = 8). c Colon cancer patients were treated with Simvastatin 40 mg for 3 weeks. Biopsies were taken prior to Simvastatin treatment and compared to resection material. Immunohistochemistry for phospho-SMAD1,5,8 and phospho-mTOR was performed. The original magnification is ×20. d The percentage of cells with positive nuclear immunostaining for p-SMAD1,5,8, and positive cytoplasmic immunostaining for phospho-mTOR relative to all cells per ×20 image field from the patient tissue samples. Three images were scored for each patient. Student t-tests were performed using the corrected means of the individual experiments (* < 0.05, ** < 0.001, *** < 0.001). Data is presented as mean ± SEM.
Statin treatment leads to reduced pmTOR expression in vivo in humans
Data linking BMP and PTEN is mainly derived from in vitro studies using breast cancer cell lines and in vivo mouse studies in normal tissue or hamartomatous polyps.40,41 We therefore investigated whether treatment with statins would show similar results in vivo in humans. We approached patients newly diagnosed with CRC and treated them with 40 mg Simvastatin orally once daily for 3 consecutive weeks. Biopsies taken at diagnosis (endoscopically) and tissue collected at surgical resection (after 3 weeks) were compared for BMP signalling activity measured by nuclear pSMAD1,5,8 and phospho-mTOR expression. Immunohistochemical analysis of the samples shows that treatment with the clinically relevant dose of 40 mg Simvastatin for 3 weeks leads to a significant decrease in phospho-mTOR expression (Fig. 6c, d). BMP signalling was not significantly increased despite showing a strong trend towards upregulation (Fig. 6c, d). Logistical and tissue handling problems meant that we were only able to perform a small pilot study. These preliminary results, however, suggest that the molecular effects of statins that we observe in vitro in CRC cell lines and in vivo in xenografts are also seen in vivo in humans.
Discussion
Genetic changes and the subsequent alterations in signal transduction pathways are key features of carcinogenesis,42 and new therapeutic strategies targeting these pathways have proved successful in treating CRC but have to be targeted to cancers with a sensitive molecular profile. This paradigm seems to be equally true for non-biological therapies such as Aspirin, which only reduces the incidence of COX-2-overexpressing cancers and cancers with PI3K3A mutations.43,44 This underscores the importance of understanding the molecular mechanism of action of compounds that appear to have beneficial effects in CRC in epidemiological studies. In this study, we set out to investigate the early effects of statin treatment on CRC cell signal transduction using a kinome array. The most pronounced effects of statins are on the Akt/mTOR survival pathway acting via PTEN and are BMP dependent. Lovastatin also affects multiple other molecules and pathways, including MEK, PI3K and EGFR, but to a lesser extent. Another reason to focus on PTEN is the pre-existing link between BMP signalling and PTEN in Cowden syndrome, which is classically associated with germline PTEN mutations, and was found to have mutations in BMPR1a.
For the kinome array analysis, we chose to use the HCT116 colon cancer cell line. We have previously shown that HCT116 cells are sensitive to statin treatment.15 We confirmed the effects in two other cell lines. Further work is needed to relate the sensitivity of individual cancers to mTOR inhibition based on their mutational fingerprints.45 Whether statins work through the same mechanisms in cancers with different subtypes (CIN, CIMP, and MSI) would be an interesting angle for future studies.
Multiple other studies have investigated the molecular mechanism of statins in cancer.18,19 Extremely high concentrations of statins were often used in vitro. Therefore, we decided to investigate which concentration of Lovastatin would be appropriate for studying specific effects on global cell signalling. The kinome array analysis shows that treating cells with high doses of Lovastatin (10 µM) for 24 h leads to chaotic changes in kinase activity, which could represent non-specific toxic effects. Conversely, cells treated with a relative low dose of Lovastatin (2 µM), a concentration which can be found in patients taking normal dosages, show logical and consistent changes in signalling pathways. The most profound effect was reduced activation of the Akt/mTOR pathway, a major survival pathway that is frequently upregulated in CRC.46 The effect of statins on the Akt/mTOR pathway has been previously shown in breast, lung, hepatic and renal carcinoma.47 We demonstrate that siRNA knockdown of PTEN abolishes the statin-induced inhibition of mTOR. Transfection with constitutively active Akt also prevents statins from inhibiting mTOR providing further evidence that mTOR inhibition by statins is PTEN dependent.
A link between PTEN expression and active BMP signalling has been observed in breast cancer cell lines and in mouse studies.38,39,41 We have previously shown that statins induce BMP signalling and induce apoptosis in CRC cells and that this effect can be abolished by either Noggin or mevalonate treatment.15 In this study, we therefore investigated whether the effect of statin treatment on PTEN was mediated through induction of BMP signalling. We show that the inhibitory effect of statins on mTOR is abolished when pre-treated with the BMP inhibitor Noggin. Noggin alone increases phosphorylated PTEN levels and also reduces the effect of statins on PTEN phosphorylation. This strengthens the link between BMP signalling and PTEN and is consistent with the effect of statins on PTEN being mediated via effects on BMP signalling. The exact mechanism of this interaction will require further investigation in future studies.
To confirm these results in vivo, we treated nude mice bearing CRC xenografts with Simvastatin. We also treated a small number of CRC patients with Simvastatin between diagnosis and surgical resection. We confirmed that statins activate canonical BMP signalling by demonstrating significant increases in nuclear pSMAD1,5,8. Oral statin administration also leads to a significant decrease in PTEN and mTOR phosphorylation in the HCT116 xenografts. In a small pilot study where we treated CRC patients with Simvastatin for 3 weeks, BMP signalling was not significantly upregulated but showed a strong trend, while phospho-mTOR levels were significantly decreased in cancer specimens after treatment. Unfortunately, pPTEN immunohistochemistry in the patient specimens revealed no staining in the resection specimens. This may be due to the relatively long warm ischaemic time or differences in fixation compared to the xenografts. Phospho-epitopes are known to be very sensitive to delays in fixation. Ischaemic time impacts biological integrity of phospho-proteins in PI3K/Akt, ERK/MAPK, and p38 MAPK signalling networks.48 The pilot patient study was smaller than intended. The study was stopped prematurely due to poor patient inclusion partly due to high levels of statin and NSAID use and partly to delays in surgical resection in many included patients leading to protocol violations. A future larger patient trial will be needed to further confirm the results in a larger group of patients.
In conclusion, statin treatment of CRC cells leads to widespread changes in kinase activity affecting multiple signalling pathways. The most pronounced effects are on the PI3K/Akt/mTOR pathway, which are PTEN related and BMP dependent. We also confirmed the effect in vivo in mice and in a small pilot study in humans. Together these data provide new insights into the working mechanisms of statins, which could facilitate their rational, targeted use in CRC.
Supplementary information
Author contributions
S.O.: designed and performed experiments, analysed data, wrote manuscript. M.P.P., S.D., G.M.F.: analysed kinome array. R.J.J., J.H., M.E.W., G.M.F.: performed experiments. L.J.A.C.H.: advised and facilitated. L.L.K.: designed experiments, analysed data, and supervised the project. P.W.V.: designed and performed experiments, analysed data, and wrote the manuscript. J.C.H.H.: designed experiments, analysed data, wrote manuscript, and supervised the project.
Ethics approval and consent to participate
The study was performed in accordance with the Declaration of Helsinki. The patient study was approved by the LUMC Medical Ethics Committee. Patients provided their informed consent for participation. The animal study was approved by the AMC Animal Experiments Committee.
Data availability
Data are available upon request from the corresponding author (p.w.voorneveld@lumc.nl).
Competing interests
The authors declare no competing interests.
Funding information
R.J.J., L.L.K. and J.H. are funded by the Dutch Cancer Society (KWF). P.W.V. and J.H. are funded by the Netherlands Digestive Diseases foundation.
Footnotes
The original online version of this article was revised: Lucas J. A. C. Hawinkels should be Lukas J. A. C. Hawinkels.
Publisher’s note Springer Nature remains neutral with regard to jurisdictional claims in published maps and institutional affiliations.
Change history
5/10/2021
A Correction to this paper has been published: 10.1038/s41416-021-01426-6
Supplementary information
The online version contains supplementary material available at 10.1038/s41416-021-01318-9.
References
- 1.Bardou M, Barkun A, Martel M. Effect of statin therapy on colorectal cancer. Gut. 2010;59:1572–1585. doi: 10.1136/gut.2009.190900. [DOI] [PubMed] [Google Scholar]
- 2.Segnan N, Senore C, Andreoni B, Arrigoni A, Bisanti L, Cardelli A, et al. Randomized trial of different screening strategies for colorectal cancer: patient response and detection rates. J. Natl Cancer Inst. 2005;97:347–357. doi: 10.1093/jnci/dji050. [DOI] [PubMed] [Google Scholar]
- 3.U. S. Preventive Services Task Force, Bibbins-Domingo, K., Grossman, D. C., Curry, S. J., Davidson, K. W., Epling, J. W. et al. Screening for colorectal cancer: US Preventive Services Task Force Recommendation Statement. JAMA315, 2564–2575 (2016). [DOI] [PubMed]
- 4.Doubeni CA, Corley DA, Quinn VP, Jensen CD, Zauber AG, Goodman M, et al. Effectiveness of screening colonoscopy in reducing the risk of death from right and left colon cancer: a large community-based study. Gut. 2018;67:291–298. doi: 10.1136/gutjnl-2016-312712. [DOI] [PMC free article] [PubMed] [Google Scholar]
- 5.Jacobs RJ, Kodach LL, Hardwick JCH. The potential of statins for individualized colorectal cancer chemoprevention. Curr. Drug Targets. 2011;12:1903–1908. doi: 10.2174/138945011798184182. [DOI] [PubMed] [Google Scholar]
- 6.Arber N, Levin B. Chemoprevention of colorectal neoplasia: the potential for personalized medicine. Gastroenterology. 2008;134:1224–1237. doi: 10.1053/j.gastro.2008.02.012. [DOI] [PubMed] [Google Scholar]
- 7.Poynter JN, Gruber SB, Higgins PDR, Almog R, Bonner JD, Rennert HS, et al. Statins and the risk of colorectal cancer. N. Engl. J. Med. 2005;352:2184–2192. doi: 10.1056/NEJMoa043792. [DOI] [PubMed] [Google Scholar]
- 8.Graaf MR, Beiderbeck AB, Egberts ACG, Richel DJ, Guchelaar H-J. The risk of cancer in users of statins. J. Clin. Oncol. 2004;22:2388–2394. doi: 10.1200/JCO.2004.02.027. [DOI] [PubMed] [Google Scholar]
- 9.Mamtani R, Lewis JD, Scott FI, Ahmad T, Goldberg DS, Datta J, et al. Disentangling the association between statins, cholesterol, and colorectal cancer: a nested case-control study. PLoS Med. 2016;13:e1002007. doi: 10.1371/journal.pmed.1002007. [DOI] [PMC free article] [PubMed] [Google Scholar]
- 10.Lytras T, Nikolopoulos G, Bonovas S. Statins and the risk of colorectal cancer: an updated systematic review and meta-analysis of 40 studies. World J. Gastroenterol. 2014;20:1858–1870. doi: 10.3748/wjg.v20.i7.1858. [DOI] [PMC free article] [PubMed] [Google Scholar]
- 11.Nissen SE, Tuzcu EM, Schoenhagen P, Crowe T, Sasiela WJ, Tsai J, et al. Statin therapy, LDL cholesterol, C-reactive protein, and coronary artery disease. N. Engl. J. Med. 2005;352:29–38. doi: 10.1056/NEJMoa042000. [DOI] [PubMed] [Google Scholar]
- 12.Downs JR, Clearfield M, Weis S, Whitney E, Shapiro DR, Beere PA, et al. Primary prevention of acute coronary events with lovastatin in men and women with average cholesterol levels: results of AFCAPS/TexCAPS. Air Force/Texas Coronary Atherosclerosis Prevention Study. JAMA. 1998;279:1615–1622. doi: 10.1001/jama.279.20.1615. [DOI] [PubMed] [Google Scholar]
- 13.Egan A, Colman E. Weighing the benefits of high-dose simvastatin against the risk of myopathy. N. Engl. J. Med. 2011;365:285–287. doi: 10.1056/NEJMp1106689. [DOI] [PubMed] [Google Scholar]
- 14.Gazzerro P, Proto MC, Gangemi G, Malfitano AM, Ciaglia E, Pisanti S, et al. Pharmacological actions of statins: a critical appraisal in the management of cancer. Pharmacol. Rev. 2012;64:102–146. doi: 10.1124/pr.111.004994. [DOI] [PubMed] [Google Scholar]
- 15.Kodach LL, Bleuming SA, Peppelenbosch MP, Hommes DW, van den Brink GR, Hardwick JCH. The effect of statins in colorectal cancer is mediated through the bone morphogenetic protein pathway. Gastroenterology. 2007;133:1272–1281. doi: 10.1053/j.gastro.2007.08.021. [DOI] [PubMed] [Google Scholar]
- 16.Kodach LL, Jacobs RJ, Voorneveld PW, Wildenberg ME, Verspaget HW, van Wezel T, et al. Statins augment the chemosensitivity of colorectal cancer cells inducing epigenetic reprogramming and reducing colorectal cancer cell “stemness” via the bone morphogenetic protein pathway. Gut. 2011;60:1544–1553. doi: 10.1136/gut.2011.237495. [DOI] [PubMed] [Google Scholar]
- 17.Voorneveld PW, Reimers MS, Bastiaannet E, Jacobs RJ, van Eijk R, Zanders MMJ, et al. Statin use after diagnosis of colon cancer and patient survival. Gastroenterology. 2017;153:470.e4–479.e4. doi: 10.1053/j.gastro.2017.05.011. [DOI] [PubMed] [Google Scholar]
- 18.Demierre M-F, Higgins PDR, Gruber SB, Hawk E, Lippman SM. Statins and cancer prevention. Nat. Rev. Cancer. 2005;5:930–942. doi: 10.1038/nrc1751. [DOI] [PubMed] [Google Scholar]
- 19.Guruswamy S, Rao CV. Multi-target approaches in colon cancer chemoprevention based on systems biology of tumor cell-signaling. Gene Regul. Syst. Biol. 2008;2:163–176. doi: 10.4137/grsb.s486. [DOI] [PMC free article] [PubMed] [Google Scholar]
- 20.Johnson SA, Hunter T. Kinomics: methods for deciphering the kinome. Nat. Methods. 2005;2:17–25. doi: 10.1038/nmeth731. [DOI] [PubMed] [Google Scholar]
- 21.Hazen AL, Diks SH, Wahle JA, Fuhler GM, Peppelenbosch MP, Kerr WG. Major remodelling of the murine stem cell kinome following differentiation in the hematopoietic compartment. J. Proteome Res. 2011;10:3542–3550. doi: 10.1021/pr2001594. [DOI] [PMC free article] [PubMed] [Google Scholar]
- 22.Diks SH, Kok K, O’Toole T, Hommes DW, van Dijken P, Joore J, et al. Kinome profiling for studying lipopolysaccharide signal transduction in human peripheral blood mononuclear cells. J. Biol. Chem. 2004;279:49206–49213. doi: 10.1074/jbc.M405028200. [DOI] [PubMed] [Google Scholar]
- 23.Wu D, Sylvester JE, Parker LL, Zhou G, Kron SJ. Peptide reporters of kinase activity in whole cell lysates. Biopolymers. 2010;94:475–486. doi: 10.1002/bip.21401. [DOI] [PMC free article] [PubMed] [Google Scholar]
- 24.Löwenberg M, Tuynman J, Scheffer M, Verhaar A, Vermeulen L, van Deventer S, et al. Kinome analysis reveals nongenomic glucocorticoid receptor-dependent inhibition of insulin signaling. Endocrinology. 2006;147:3555–3562. doi: 10.1210/en.2005-1602. [DOI] [PubMed] [Google Scholar]
- 25.Johnson SC. Hierarchical clustering schemes. Psychometrika. 1967;32:241–254. doi: 10.1007/BF02289588. [DOI] [PubMed] [Google Scholar]
- 26.Abramoff, M., Magalhaes, P. & Ram, S. Image processing with ImageJ. Biophotonics Int. 11, 36–42 (2004).
- 27.Agarwal B, Halmos B, Feoktistov AS, Protiva P, Ramey WG, Chen M, et al. Mechanism of lovastatin-induced apoptosis in intestinal epithelial cells. Carcinogenesis. 2002;23:521–528. doi: 10.1093/carcin/23.3.521. [DOI] [PubMed] [Google Scholar]
- 28.Savas S, Azorsa DO, Jarjanazi H, Ibrahim-Zada I, Gonzales IM, Arora S, et al. NCI60 cancer cell line panel data and RNAi analysis help identify EAF2 as a modulator of simvastatin and lovastatin response in HCT-116 cells. PLoS ONE. 2011;6:e18306. doi: 10.1371/journal.pone.0018306. [DOI] [PMC free article] [PubMed] [Google Scholar]
- 29.Cho S-J, Kim JS, Kim JM, Lee JY, Jung HC, Song IS. Simvastatin induces apoptosis in human colon cancer cells and in tumor xenografts, and attenuates colitis-associated colon cancer in mice. Int. J. Cancer. 2008;123:951–957. doi: 10.1002/ijc.23593. [DOI] [PubMed] [Google Scholar]
- 30.Pan HY, DeVault AR, Wang-Iverson D, Ivashkiv E, Swanson BN, Sugerman AA. Comparative pharmacokinetics and pharmacodynamics of pravastatin and lovastatin. J. Clin. Pharmacol. 1990;30:1128–1135. doi: 10.1002/j.1552-4604.1990.tb01856.x. [DOI] [PubMed] [Google Scholar]
- 31.Vazquez F, Ramaswamy S, Nakamura N, Sellers WR. Phosphorylation of the PTEN tail regulates protein stability and function. Mol. Cell Biol. 2000;20:5010–5018. doi: 10.1128/mcb.20.14.5010-5018.2000. [DOI] [PMC free article] [PubMed] [Google Scholar]
- 32.Rahdar M, Inoue T, Meyer T, Zhang J, Vazquez F, Devreotes PN. A phosphorylation-dependent intramolecular interaction regulates the membrane association and activity of the tumor suppressor PTEN. Proc. Natl Acad. Sci. USA. 2009;106:480–485. doi: 10.1073/pnas.0811212106. [DOI] [PMC free article] [PubMed] [Google Scholar]
- 33.Ross AH, Gericke A. Phosphorylation keeps PTEN phosphatase closed for business. Proc. Natl Acad. Sci. USA. 2009;106:1297–1298. doi: 10.1073/pnas.0812473106. [DOI] [PMC free article] [PubMed] [Google Scholar]
- 34.Burgering BM, Coffer PJ. Protein kinase B (c-Akt) in phosphatidylinositol-3-OH kinase signal transduction. Nature. 1995;376:599–602. doi: 10.1038/376599a0. [DOI] [PubMed] [Google Scholar]
- 35.Howe JR, Bair JL, Sayed MG, Anderson ME, Mitros FA, Petersen GM, et al. Germline mutations of the gene encoding bone morphogenetic protein receptor 1A in juvenile polyposis. Nat. Genet. 2001;28:184–187. doi: 10.1038/88919. [DOI] [PubMed] [Google Scholar]
- 36.Tenesa A, Dunlop MG. New insights into the aetiology of colorectal cancer from genome-wide association studies. Nat. Rev. Genet. 2009;10:353–358. doi: 10.1038/nrg2574. [DOI] [PubMed] [Google Scholar]
- 37.Zhou XP, Woodford-Richens K, Lehtonen R, Kurose K, Aldred M, Hampel H, et al. Germline mutations in BMPR1A/ALK3 cause a subset of cases of juvenile polyposis syndrome and of Cowden and Bannayan-Riley-Ruvalcaba syndromes. Am. J. Hum. Genet. 2001;69:704–711. doi: 10.1086/323703. [DOI] [PMC free article] [PubMed] [Google Scholar]
- 38.Waite KA, Eng C. BMP2 exposure results in decreased PTEN protein degradation and increased PTEN levels. Hum. Mol. Genet. 2003;12:679–684. [PubMed] [Google Scholar]
- 39.Zimmerman LB, De Jesús-Escobar JM, Harland RM. The Spemann organizer signal noggin binds and inactivates bone morphogenetic protein 4. Cell. 1996;86:599–606. doi: 10.1016/s0092-8674(00)80133-6. [DOI] [PubMed] [Google Scholar]
- 40.Kobielak K, Stokes N, de la Cruz J, Polak L, Fuchs E. Loss of a quiescent niche but not follicle stem cells in the absence of bone morphogenetic protein signaling. Proc. Natl Acad. Sci. USA. 2007;104:10063–10068. doi: 10.1073/pnas.0703004104. [DOI] [PMC free article] [PubMed] [Google Scholar]
- 41.He XC, Zhang J, Tong W-G, Tawfik O, Ross J, Scoville DH, et al. BMP signaling inhibits intestinal stem cell self-renewal through suppression of Wnt-beta-catenin signaling. Nat. Genet. 2004;36:1117–1121. doi: 10.1038/ng1430. [DOI] [PubMed] [Google Scholar]
- 42.Stratton MR, Campbell PJ, Futreal PA. The cancer genome. Nature. 2009;458:719–724. doi: 10.1038/nature07943. [DOI] [PMC free article] [PubMed] [Google Scholar]
- 43.Chan AT, Ogino S, Fuchs CS. Aspirin and the risk of colorectal cancer in relation to the expression of COX-2. N. Engl. J. Med. 2007;356:2131–2142. doi: 10.1056/NEJMoa067208. [DOI] [PubMed] [Google Scholar]
- 44.Liao X, Morikawa T, Lochhead P, Imamura Y, Kuchiba A, Yamauchi M, et al. Prognostic role of PIK3CA mutation in colorectal cancer: cohort study and literature review. Clin. Cancer Res. 2012;18:2257–2268. doi: 10.1158/1078-0432.CCR-11-2410. [DOI] [PMC free article] [PubMed] [Google Scholar]
- 45.Din FVN, Valanciute A, Houde VP, Zibrova D, Green KA, Sakamoto K, et al. Aspirin inhibits mTOR signaling, activates AMP-activated protein kinase, and induces autophagy in colorectal cancer cells. Gastroenterology. 2012;142:1504.e3–1515.e3. doi: 10.1053/j.gastro.2012.02.050. [DOI] [PMC free article] [PubMed] [Google Scholar]
- 46.Engelman JA, Luo J, Cantley LC. The evolution of phosphatidylinositol 3-kinases as regulators of growth and metabolism. Nat. Rev. Genet. 2006;7:606–619. doi: 10.1038/nrg1879. [DOI] [PubMed] [Google Scholar]
- 47.Roudier E, Mistafa O, Stenius U. Statins induce mammalian target of rapamycin (mTOR)-mediated inhibition of Akt signaling and sensitize p53-deficient cells to cytostatic drugs. Mol. Cancer Ther. 2006;5:2706–2715. doi: 10.1158/1535-7163.MCT-06-0352. [DOI] [PubMed] [Google Scholar]
- 48.Holzer TR, Fulford AD, Arkins AM, Grondin JM, Mundy CW, Nasir A, et al. Ischemic time impacts biological integrity of phospho-proteins in PI3K/Akt, Erk/MAPK, and p38 MAPK signaling networks. Anticancer Res. 2011;31:2073–2081. [PubMed] [Google Scholar]
Associated Data
This section collects any data citations, data availability statements, or supplementary materials included in this article.
Supplementary Materials
Data Availability Statement
Data are available upon request from the corresponding author (p.w.voorneveld@lumc.nl).