Abstract
BACKGROUND AND PURPOSE: Endovascular stent placement is an emerging technique in treating cerebral aneurysms. Thus far, no quantitative method is available to determine the effectiveness of stent deployment in reducing intraaneurysmal flow circulation, and thereby, in excluding the aneurysm from the cerebral vasculature. Our purpose was to develop a mathematical model congruent with flow transport phenomena observed in cerebral aneurysms and based on the washout of angiographic contrast medium from these aneurysms to provide quantitative indices for predicting the likelihood of stable thrombus formation after stent placement.
METHODS: Angiographic data from an in vitro experiment involving an elastomer side-wall aneurysm model and data from five patients with cerebral aneurysms were collected and analyzed. A region of interest (ROI) delineating the aneurysm was selected in each case, and the temporal variation in average gray-scale intensity within this ROI was assessed. The mathematical model was fit to the gray-scale intensity curves by using least-squares minimization. Variations in model parameters before and after stent placement were studied.
RESULTS: A marked variation in the model parameters was observed in both in vitro cases and when data suitable for mathematical modeling were available from the clinical setting. This variation supported the hypothesis of the model.
CONCLUSION: On the basis of our results, we conclude that the model developed herein can be used to quantitatively depict and characterize alterations in aneurysmal blood-flow transport before and after endovascular stent placement. By inference, future versions of the model will be useful in predicting the long-term effectiveness of endovascular stent placement for cerebral aneurysms immediately after the procedure is performed.
The most dangerous complication associated with cerebral aneurysms is rupture leading to hemorrhagic stroke. On average, someone in the United States has a stroke every 53 seconds, and every 3.3 minutes, someone dies of one. Stroke caused 158,448 deaths in 1998 and accounted for about one of every 14.8 deaths. Approximately 17% of strokes are hemorrhagic; about 41% of these are subarachnoid hemorrhages (SAHs) (1). The frequency of intracranial aneurysms is reported to be 1–8% in the general population; the most common presentation (in 90% of cases) is SAH (2).
Minimally invasive endovascular stent placement is emerging as a potential therapy used to exclude cerebral aneurysms from the circulation and thereby restore the diseased vasculature to normal (3–7). In 1969, Dotter (8) was the first to experimentally illustrate endovascular stent insertion, and stents have been used for years since then for the treatment of atherosclerotic disease (9, 10). Stents impede the mass and momentum transport of flow between the parent artery and the aneurysm, and they alter intraaneurysmal inflow and outflow patterns by providing increased flow resistance into the aneurysm through the stent mesh (7). The stent induces diminished vorticity and promotes flow stagnation in the aneurysmal sac, which may lead to the formation of a stable thrombus within it and the eventual exclusion of the aneurysm from the circulation (3, 6, 7). The surface of the stented arterial segment undergoes a sequence involving thrombus formation, fibroblast proliferation, and endothelialization; eventually, the growth of a neointimal layer and revascularization result (3, 7, 9, 11).
Given the initial clinical results of endovascular stent use in the treatment of cerebral aneurysms, quantifiable methods to evaluate the effectiveness of stents in excluding aneurysms from the circulation are needed. Because angiography is a fundamental part of any endovascular treatment process, it provides the most feasible opportunity for any such analysis of stent placement effectiveness.
An attempt was previously made (12) to extract quantitative information about intraaneurysmal hemodynamics by using angiographic images obtained from a clinical setting. Studies have also been conducted (13–15) to examine the washout of angiographic contrast material from in vitro aneurysm models. The purpose of this study was to develop a mathematical model that is representative of physical flow phenomena associated with cerebral aneurysms and to use the parameters of the model as cogent indices of stent effectiveness.
Methods
Data Collection
In Vitro Experiment.—An in vitro study was conducted by using an elastomer model of a spherical side-wall aneurysm (Sylgard 184; Dow Corning, Midland, MI) (Fig 1) that was fabricated during a previous study (16). Contrast medium was injected through this model, and the temporal variation in the gray-scale intensity in the aneurysm was plotted to obtain raw concentration-time curves for mathematical modeling.
Fig 1.
Geometry and 3D image of the aneurysm model.
A pulsatile flow generator (Fig 2) that consisted of a cardiac pulse duplicator (Superpump System SPS 6891; ViVitro Systems, Victoria, BC, Canada) was used in an effort to duplicate physiologic flow conditions. The system had the following basic constituents: 1) a linear actuator (SPL 3891; Vivitro Systems) that converts the rotational motion of a motor to the linear motion of a piston-cylinder pump, 2) a servo power amplifier (SPA 3891; Vivitro Systems) to control the amplitude of piston oscillation, 3) a hydraulic chamber (Superdup’r SD 6891; Vivitro Systems) simulating the left ventricle of a heart and its systemic load, 4) a ventricle impedance adapter (VIA 7991; Vivitro Systems) that uses resistive and compliant elements to simulate the viscoelastic properties of a ventricle, and 5) a waveform generator (WG 5891; Vivitro Systems) to generate several different waveforms at various selectable frequencies.
Fig 2.
Schematic diagram of the experimental setup.
The peripheral adjustable resistance shown in Figure 2 facilitated the desired aortic pressures, whereas the supplementary aortic root compliance allows adjustment of the stroke volumes. The working fluid was kept separate from the pump by an elastic membrane in the hydraulic chamber. From the ventricle, the fluid was pumped through two parallel loops. The primary loop consisted of flow through a heat exchanger, where the temperature (and therefore the viscosity) of the working fluid was adjusted. The secondary loop flowed through an electromagnetic flow meter, the test cell, and a Starling resistor, in that order.
The aneurysm models were implanted with shape memory Ni-Ti alloy (nitinol) stents to examine contrast agent washout from stented aneurysms. Three helical stents, each made of nitinol wire with a different diameter (Shape Memory Applications; Santa Clara, CA), were used for the study. The porosity of the stents, defined as the percentage ratio of the length unoccupied by the stent filaments to the total length of the stent, was kept constant at 76% (6, 16).
The working fluid was the same as that used in a previous study conducted in our laboratory (16). The fluid was a mixture of 58% glycerin and 42% saline solution (by volume), with a density of 1.1475 g/mL and a viscosity of 0.1142 poise (dyne-sec/cm2) at the working temperature (27.7 °C). The values of the viscosity and temperature were selected for refractive index matching between the working fluid and the elastomer model to enable optical measurements in another study. However, in concert with tube dimensions and flow rate, these values yielded flow dynamic similarity parameters representative of physiologic hemodynamic conditions in human cerebral arteries. The cardiac pulse duplicator was used to generate four oscillatory flow conditions for the case before stent placement and for each case after stent placement. The volume of fluid pumped from the left ventricle was controlled by adjusting the waveform input to the power amplifier and by changing the amplitude and frequency of piston motion. The input waveform was sinusoidal, and a constant ventricular output of 5 L/min was obtained at four frequencies: 1) 60 beats per minute (bpm), with f=1 Hz, Womersley number ∝=2.5, peak Reynold number (Remax)=175; 2) 70 bpm, with f=1.167 Hz, ∝=2.7, Remax = 165; 3) 80 bpm, with f=1.33 Hz, ∝=2.9, Remax=149; and 4) 100 bpm, with f=1.67 Hz, ∝=3.3, Remax = 121. A microliter injection system previously designed in our laboratory was used to inject the contrast agent (Oxilan 300; Cook, Bloomington, IN) at a rate of 1.5 mL/s. The system was used in this experiment to attain repeatable injections. The digital subtraction angiography unit was a dual-plane system (TDA 4000; Toshiba America Medical Systems, Tustin, CA), although only the ceiling C-arm of the system was used. Each angiographic run involved the acquisition of 254 frames at a rate of 10 frames per second (fps), and the frames from all the runs were transferred to a computer for analysis. The rate of 10 fps was chosen as a compromise between requiring high-speed data collection and limiting the amount of data (number of frames) to be processed.
Clinical Cases.—Angiographic data from five clinical patients in whom cerebral aneurysms were treated with endovascular stents were downloaded onto a computer running Windows software (Microsoft; Redmond, WA) for analysis. A biplane system (Super Angiorex model G; Toshiba America Medical Systems) was used for angiography.
Patient 1 presented with headaches, vomiting, and SAH from a fusiform aneurysm in the vertebrobasilar junction. One endovascular stent (Magic S/P Wallstent; Boston Scientific, Natick, MA), 4 mm in diameter and 47 mm in length, was implanted in the diseased region. Patient 2 presented with a fusiform aneurysm in the trunk of the basilar artery, and an attempt had previously been made to sequentially occlude the vertebral arteries to thrombose the aneurysm. After the aneurysm regrew, an endovascular stent was placed in the vessel, and the aneurysm was packed with coils. Because of insufficient exclusion of the aneurysm from the circulation, as determined by visual inspection, another stent (S670, 3.5 × 18 mm; Medtronic, Minneapolis, MN) was inserted concentrically within the previous stent 2 months later. Patient 3 presented with dizziness and an unsteady gait, and a fusiform aneurysm in the vertebrobasilar junction was eventually diagnosed. A stent (Dynalink, 6 ×38 mm; Guidant, Indianapolis, IN) was deployed. Patient 4 presented with headaches, and a carotid-ophthalmic artery bifurcation aneurysm was detected. A S7 AVE stent (3.5 × 12 mm; Medtronic) was implanted. Patient 5 was treated for a wide-necked aneurysm in the posterior inferior cerebellar artery by using a 3.9 × 9-mm S7 AVE stent (Medtronic). Table 1 summarizes the data collected.
TABLE 1:
Summary of clinical data
| Patient and Stage of Angiographic Data Collection | Speed, fps | Total No. of Frames |
|---|---|---|
| Patient 1* | ||
| Before stent | 15 | 84 |
| After stent | 15 | 110 |
| Follow-up at 24 h | 15 | 137 |
| Patient 2† | ||
| No endovascular prostheses | 5 | 18 |
| One stent | 5 | 20 |
| One stent and coils | 5 | 19 |
| One stent and coils, after 2 mo | 15 | 52 |
| Two stents and coils | 15 | 43 |
| Patient 3‡ | ||
| Before stent | 5 | 20 |
| After stent | 5 | 29 |
| Patient 4§ | ||
| Before stent | 15 | 59 |
| After stent | 15 | 110 |
| Patient 5‖ | ||
| Before stent | 5 | 14 |
| After stent | 5 | 14 |
Patient 1 had a fusiform aneurysm at the vertebrobasilar junction that was treated with a Magic S/P Wallstent, 4 × 47 mm (Boston Scientific).
Patient 2 had a fusiform basilar trunk aneurysm that was treated with a S670 stent, 3.5 × 18 mm (Medtronic).
Patient 3 had a fusiform aneurysm at the vertebrobasilar junction that was treated with a Dynalink stent, 6 × 38 mm (Guidant).
Patient 4 had a carotid-ophthalmic bifurcation aneurysm that was treated with an S7 AVE stent, 3.5 × 12 mm (Medtronic).
Patient 5 had a wide-necked posterior inferior cerebellar artery aneurysm that was treated with an S7 AVE stent, 3.5 × 9 mm (Medtronic).
Data Processing
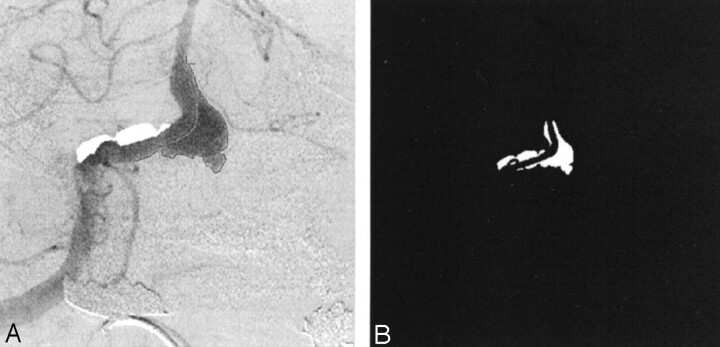
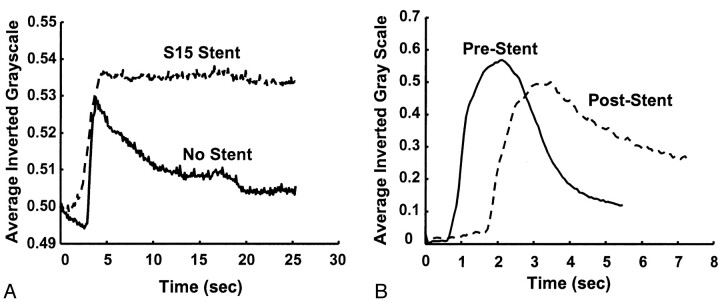
The frame in which the aneurysm was most clearly visualized was chosen in each angiographic run, and a polygonal region of interest (ROI) was manually traced around the aneurysm (Fig 3A). The ROI was traced by starting at the point where the aneurysmal projection in the frame deviated from the course of the normal artery. The tracing continued along the outer edge of the aneurysm and closed along the estimated edge of a normal artery at the aneurysmal neck. When arteries or draining veins are interposed with the aneurysmal mask, they erroneously contribute to the total gray-scale level when contrast material passes through them. In such cases, multiple ROIs that bypassed those arteries or veins were selected to generate the final mask (Fig 3B). That is, if any superimposing vasculature lay in the path of an ROI being traced, that ROI was closed by tracing back along the edge of the superfluous artery or vein. Another ROI was then started at the intersection of the path of the regular ROI trace and the other edge of the imposing vasculature. This mask was multiplied with the entire sequence of frames in a run that delineated the ROI in each frame. The average gray-scale intensity (total gray-scale value of pixels/total number of pixels) within the ROI was then calculated for each frame. Figure 4 shows the variations in average gray-scale intensity with time (raw concentration time curves), before and after stent insertion, from the in vitro experiment and from the anteroposterior (AP) projection data in patient 1.
Fig 3.
Images in patient 1.
A, Angiogram illustrates the selection of an ROI.
B, Final mask.
Fig 4.
Gray-scale intensity curves before and after stent placement.
A, In vitro study.
B, Raw data curves in patient 1 (AP projection).
The point of notable increase in gray-scale intensity, which represents the instant the contrast material enters the aneurysm, was selected on each of the raw data curves and shifted to the origin. The plots were then normalized, and the following mathematical model was fitted to the curves on the basis of least-squares minimization subject to appropriate constraints (Eq 1):
 |
1) |
 |
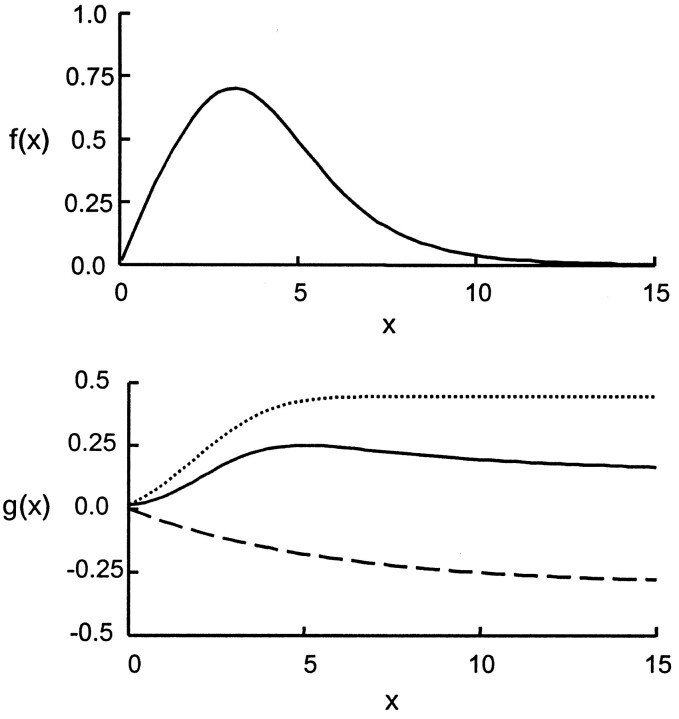
The hypothesis for selecting this model is explained as follows. The fluid particles flowing in and out of the aneurysm can be visualized as being transported by two phenomena: convection and diffusion. The first part of the model was the convolution of a normal distribution and an exponential decay; hence, it represented a lagged normal distribution (Fig 5A). This part of the model simulated those particles that are carried into and out of the aneurysm by means of convection. The second part of the model (Fig 5B) consisted of a sigmoid function (integral of the normal distribution) and an exponential decay; it was intended to simulate the process of diffusion. The sigmoid function represented those particles that are carried into the aneurysm by means of convection but never leave, because they become restricted to those flow streamlines that keep circulating within the aneurysm and never contribute to the outflow from the aneurysm. From the instant aneurysmal inflow begins, fluid particles diffuse from the streamlines restricted to the aneurysm to streamlines that constitute outflow. This diffusive component of flow transport was modeled by the exponential decay in the second part of Equation 1.
Fig 5.
Top, Lagged normal distribution representing convective portion of model. Bottom, Diffusive component of the model. Dotted line indicates the sigmoid constituent; dashed line, the element of exponential decay.
The parameters involved in the model were the following: First, ρconv and ρdiff are amplification factors representing the relative magnitudes of convective and diffusive transport, respectively. The deployment of a stent in the aneurysmal region should result in an increase in the diffusive component (and consequently, a decrease in the convective component) of flow transport, because that leads to greater flow stasis and increased likelihood of aneurysmal thrombosis. Therefore, the value of ρdiff should relatively increase after stent placement, whereas the value of ρconv is expected to decrease.
Second, τconv and τdiff are the convection and diffusion time constants, respectively. To increase the likelihood of thrombosis, the flow should circulate within the aneurysm for a longer period of time after stent placement than before. That is, the washout from the aneurysm should be delayed. This observation would imply an increase in the values of τconv and τdiff. Ideally, the value of τdiff should markedly increase after stent deployment.
Third, σ and μ do not qualify as indices of stent effectiveness, but rather, they are related to the method and profile of contrast agent injection, for example, the rate of injection, the period of injection, and variations in these parameters due to manual injection, and so on.
Results
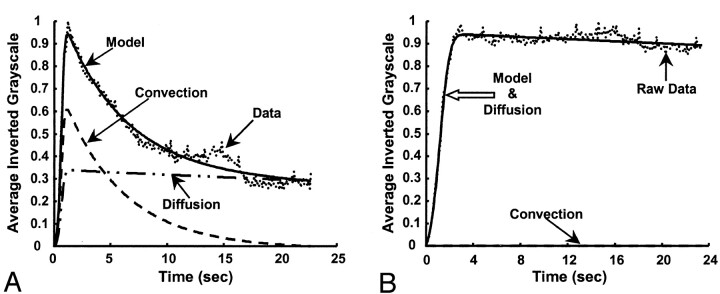
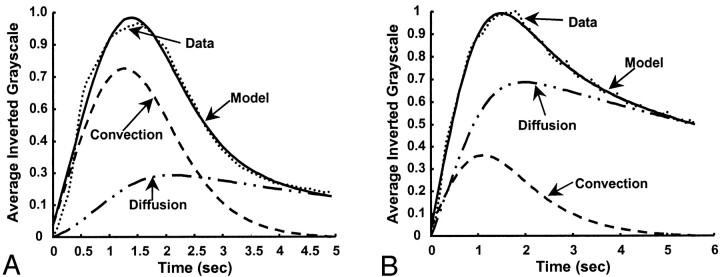
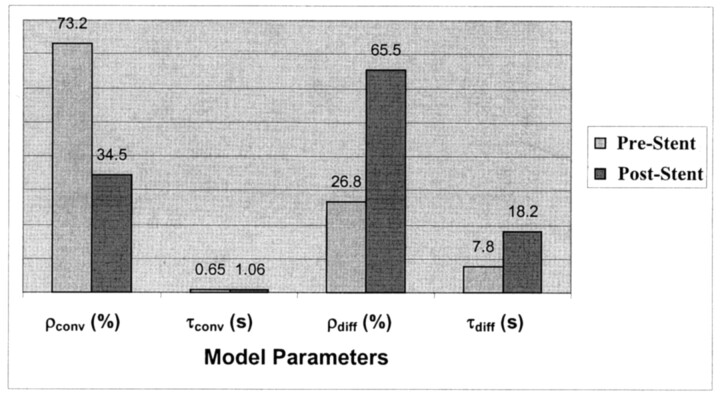
The model fit for two cases from the in vitro experiment is shown in Figure 6, and the values obtained for the convective and diffusive model parameters are shown in Figure 7. Figures 6 and 7 are related to one of the runs before stent placement (f=1.167 Hz) and for one run after stent placement (stent filament diameter=153 μm, f=1.167 Hz). The diffusion component in the post-stent placement case overlaps that of the model; that is, it completely dominates the flow transport. The numbers obtained for the other two stents (filament diameter=127 and 178 μm) were similar to those of the post-stent placement run given here. Negligible contrast washout was observed in all cases after stent placement, and almost all of the contrast material that entered the aneurysm kept circulating within it for the entire duration of the run. Therefore, diffusion becomes the primary mode of transport after stent insertion, and this change is reflected in the model parameters by very high percentages of diffusion (about 100%) and very low convection magnitudes (near 0%). The convection time constant also increased, and the diffusion time constant substantially increased. A relatively high magnitude of convection (20%, 15%, and 11%) resulted for the three stents at an operating frequency of 60 bpm (f=1 Hz, α=2.52), in comparison to almost 0% convection at the higher frequencies.
Fig 6.
Model fits for the in vitro experiment (frame rate, 10 fps). Dotted line indicates data; solid line, model; dashed line and dash-and-dotted line, convection and diffusion components, respectively.
A, Before stent placement.
B, After stent placement.
Fig 7.
Variation in model parameters for the in vitro experiment, before and after stent placement. Values correspond to the model-fit curves in shown Figure 6.
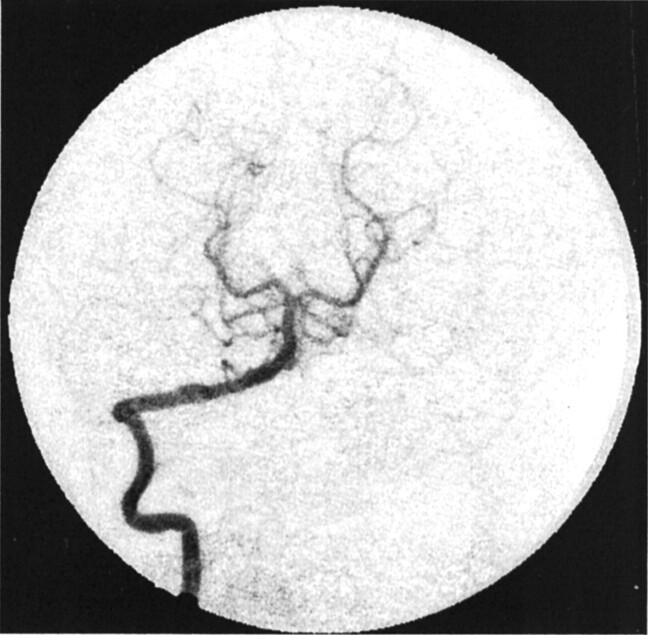
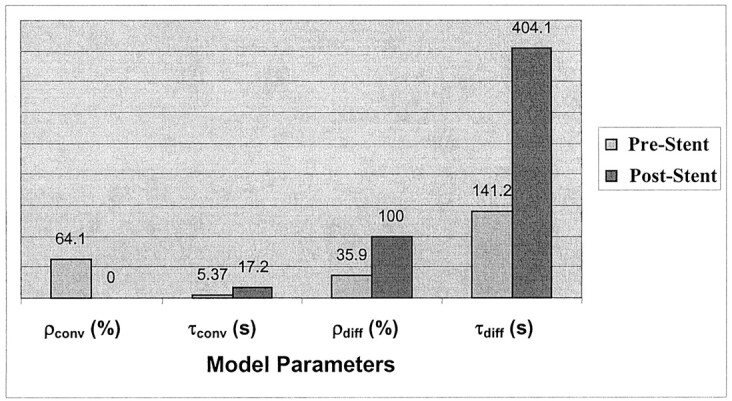
Figures 8 and 9 show the model-fit curves before and after stent placement and the parameters obtained in clinical patient 1 (AP projection data), respectively. The magnitude of convection had been reduced by more more than half the value before stent insertion, whereas the diffusion magnitude and both time constants increased by more than twice their prior values. Therefore, the model could be used to predict increased flow stasis and increased likelihood of thrombosis of the aneurysm after stent placement. Figure 10 shows a follow-up angiogram obtained 3 months after stent implantation. The aneurysm, which was present at the vertebrobasilar junction (Fig 3A), had become completely thrombosed, and the angiogram showed normal vasculature.
Fig 8.
Model fit for patient 1 (AP projection; frame rate, 15 fps). Left, Before stent placement. Right, After stent placement. Dotted line represents data; solid line, the model; dashed line and dash-and-dotted line, convection and diffusion components of the model, respectively.
Fig 9.
Variation in model parameters for patient 1, before and after stent placement. Values correspond to the model-fit curves shown in Figure 8.
Fig 10.
Angiogram obtained at 3-month follow-up in patient 1 shows complete exclusion of the aneurysm from the circulation (AP projection).
Table 2 shows the diffusive and convective model parameters for the other four clinical patients. The values obtained with the lateral (LAT) projection were similar to those shown for the AP projection. The angiographic runs from the first stent implantation and coil procedure were acquired at a rate of 5 fps in patient 2, and runs in the second stent procedure were acquired at 30 fps. These findings hindered the analysis of the progression in this patient. The low-speed data from this patient showed no perceptible change between the values obtained before stent placement and those obtained afterward. The high-speed runs showed a 25% decrease in convection and an increase of about 250% in the magnitude of diffusion in the AP projection. The LAT projection, however, showed almost no change in the parameters. Also, no change occurred in the values of the decay constants. Overall, the stents seemed to have increased flow stasis within the aneurysm, but a better judgment could not be made because of the lack of suitable data.
TABLE 2:
Model parameters for the clinical patients
| Patient and Run* | ρconv, % | ρdiff, % | τconv, seconds | τdiff, seconds |
|---|---|---|---|---|
| Patient 1 | ||||
| Before stent | 73.2 | 36.8 | 0.65 | 7.8 |
| After stent | 34.5 | 65.5 | 1.06 | 18.2 |
| Patient 2 | ||||
| No devices | 84.3 | 14.7 | 0.29 | 4.98 |
| One stent | 82.9 | 17.1 | 0.29 | 4.97 |
| One stent and coils | 89 | 11 | 0.53 | 4.95 |
| One stent and coils, after 2 mo | 91.4 | 8.6 | 0.03 | 4.17 |
| Two stents and coils | 69.4 | 30.6 | 0.07 | 5.1 |
| Patient 3 | ||||
| Before stent | 53 | 47 | 1.71 | 15 |
| After stent | 39 | 61.1 | 1.93 | 20 |
| Patient 4 | ||||
| Before stent | 99 | 0.95 | 0.5 | 1.56 |
| After stent | 90.3 | 9.7 | 0.53 | 9.71 |
| Patient 5 | ||||
| Before stent | 60.2 | 39.8 | 1.22 | 4.97 |
| After stent | 67 | 33.1 | 2.77 | 4.77 |
The stent implanted in patient 3 reduced the convection component of the washout by about 25% and increased the diffusion component by more than 30%. The time constants also relatively increased in value (33% and 200% increase in τdiff in the AP and LAT projections, respectively). The convection magnitude for the data in patient 4 was reduced by only about 10% in the AP projection and 25% in the LAT projection. The washout was completely governed by convection in the pre-stent placement case (99%), and it played a major role in the post-stent placement case as well (AP, 90%; LAT, 73%). The magnitude of diffusion greatly increased relative to the value in the pre-stent placement case, although the absolute percentage of diffusion involved was low (AP, 9.7%; LAT, 27%). The time constants for both projections remained at the same order of magnitude after stent deployment. The model parameters for patient 5 did not show any appreciable change in the pre-and post-stent placement cases in the AP projection. The aneurysm appeared as a slender structure in the LAT projection, with arteries superimposed on it; because of this depiction, this projection was not processed.
Discussion
Stents can promote the formation of a stable thrombus in aneurysms by altering the intraaneurysmal hemodynamics while maintaining patency of the parent artery (3, 4). The growth and rupture of aneurysms is intrinsically related to the hemodynamics prevailing in the diseased region (17, 18). That the favorable alteration of the flow dynamics within and at the aneurysm site can lead to the thrombosis of the aneurysm has also been documented (3, 19). Thus, better understanding and quantification of such hemodynamics is critical to the development of more effective treatment methods.
In this investigation, we attempted to capture flow transport phenomena associated with cerebral aneurysms by developing a mathematical model that was fit to angiographic contrast-material washout data. Four of the six model parameters can be quantified as indices of stent placement effectiveness, whereas the other two are related to the contrast material injection profile. An examination of the effects of stent use shows a marked variation in these four model parameters before and after stent placement in both the in vitro results and in the clinical data.
Whether the almost negligible contrast agent washout in the post-stent placement in vitro case is desirable in the clinical setting is open to question. A slight exchange of blood between the parent artery and the aneurysm might be necessary for the formation of a stable thrombus and organized fibrosis in the aneurysmal sac. The higher percentages of convection in the post-stent placement cases at 60 bpm might be explained after close examination of intraaneurysmal hemodynamics, as in Livescu’s study (16). A lower frequency allows greater time for the contrast medium to wash out with the intraaneurysmal vortex that is abolished during diastole and swept into the parent artery by the process of convection.
Some of the problems encountered during processing of the clinical data were related to the rate of image acquisition and the projection of the images. A low-frame-rate run reduces the effectiveness of the model fit because of the reduced number of available data points. A smoother curve with a higher number of data points provides a more realistic representation of the injection profile, the washout from the aneurysm, and the temporal location when the concentration of contrast medium in the aneurysm is maximal; therefore, this smoother curve is better suited for mathematical modeling. Also, comparing the model parameters between the low-speed runs and the high-speed runs (as in the case of patient 2) is difficult, because low-speed data are acquired over a longer period and present a different injection profile, especially when the injection is manually administered. The optimal frame rate is the maximum rate that can be used over the period of contrast agent washout from the aneurysm, within the range of an appropriate radiation dose. The presence of coils in patient 2 also hindered data processing, because the subtraction process does not completely eliminate the coils from the image (due to jitter), and they affect the gray-scale value within the aneurysm. Thus, an ROI that excluded interposing arteries or coils had to be selected; a process that presented another complication to effective data processing. The insertion of radiopaque objects within the aneurysm attenuates the visibility of the contrast medium and thus complicates the implementation of the proposed technique. However, limited experience with only one case does not conclusively indicate that this method cannot be further refined for evaluating the effectiveness of coils in aneurysm treatment.
Analysis of the data from patient 3 probably underlines the importance of this work, because the patient died while the implantation of a second stent in the diseased region was attempted. To the eye, the stent did not seem to have created enough flow stasis within the aneurysm. We attempted to implant another coaxial stent to reduce the effective porosity and thereby increase the resistance to flow into the aneurysm. In the future, availability of the model parameters immediately after stent placement might help in making a better judgment about the effectiveness of the stent. In light of the fact that the data from patient 4 was amenable to mathematical modeling, the existence of a large convective component, even after stent placement, and the low absolute percentage of diffusion, seem to suggest that the stent was not effective in promoting thrombosis in the aneurysm. The low-speed data from patient 5, coupled with the great difficulty in ROI selection due to an unwieldy aneurysmal projection might explain the unvaried model parameter values after stent placement.
Tenjin et al (12) endeavored to extract quantitative information about intraaneurysmal hemodynamics by using angiographic images obtained in a clinical setting. Circular ROIs were drawn on the parent artery (proximal and distal to the aneurysm) and within the aneurysm, and the temporal variation in the contrast medium concentration inside these regions was plotted. Temporal indices, such as the time to half-peak of the integral of the time-density curve or the time-to-peak density of a γ-variate model fit to the data curves, have been suggested to represent intraaneurysmal blood velocity. Average blood flow velocity may be deduced from the lag in the arrival time of the contrast agent at two locations of known distance in an artery with unidirectional flow. However, blood velocity patterns within aneurysms are complex and multidirectional, and we posit that the use of a composite velocity term expressed by scalar temporal indices does not seem to be representative of that complexity. Although the indices presented in the aforementioned study may be used to characterize intraaneurysmal flow transport and thereby used to evaluate the effects of endovascular stents, stent implantation procedures were not considered. Other studies conducted (13–15) to investigate the washout of contrast material from in vitro models of aneurysms were not designed to quantify the data with a comprehensive mathematical model; also, these studies did not consider the impact and outcome of stent use. For example, Kawanishi et al (13) injected contrast material into an in vitro aneurysm model that was irradiated with stable light. They used the output of a photocell placed opposite the aneurysm to create a contrast material clearance curve. A simple exponential decay was fitted to this curve, and the decay half-life was hypothesized to be an index of intraaneurysmal flow stagnation. The study was performed to assess the effects of parent-artery occlusion as a treatment for aneurysms. Roach (15) conducted a similar study using the output recordings from an anemometer probe placed within the aneurysm to better understand the effect of aneurysm size as a factor influencing their rupture.
Conclusion
Endovascular stent insertion seems to offer a feasible technique in the effective treatment of cerebral aneurysms. However, the unambiguous selection of a stent for a specific aneurysm depends on many factors such as the size, shape, and accessibility of the aneurysm; the degree of disease in the aneurysmal region; the local hemodynamics, stent flexibility and geometry, and so on (6, 7, 11). The mathematical model developed here accurately depicts the expected variation in flow transport phenomena due to stent deployment, and hence, it may eventually be used as one of the tools for purposes such as stent selection.
The most important requirement for the unhindered progress of this work with clinical data is that the procedure for angiography must become more standardized and oriented toward generating suitable data for research. As far as circumstances permit, the contrast material injections must be repeatable and consistent; these aims could be achieved by using a pump injector system. The runs should be acquired at high frame rates, and the image acquisition angles should be selected to minimize the number of arteries and veins that are superimposed on the aneurysmal region; these measures would facilitate data processing.
The next logical step would be a comparison of various stents in an in vitro setting and the collection of as much relevant clinical data as possible. If suitable modifications are made to the model and technique to incorporate absolute measurements rather than case-dependent relative measurements, the data will permit study of the effects that various stents and stent parameters (eg, porosity, filament diameter) have on the transport of blood into and out of cerebral aneurysms. Such a database, with information from comparisons of different stents, might facilitate the selection of a suitable stent before the endovascular procedure. Such a database is also required to firmly corroborate the intended purpose of this work; that is, to be able to predict the long-term effectiveness of stent implantation in achieving flow stasis within, and consequent thrombosis of, an aneurysm immediately after stent deployment is performed.
Footnotes
Financial support provided by the Oishei Foundation and infrastructure provided by Toshiba America Medical Systems.
Presented at the Summer Bioengineering Conference, Snowbird, Utah, June 27 - July 1, 2001, and at the International Mechanical Engineering Congress and Exposition, New York, NY, November 11–16, 2001.
References
- 1.American Heart Association. 2001 Heart and Stroke Statistical Update. Dallas, TX:2000
- 2.Meyer FB, Morita A, Puumala MR, Nichols DA, Medical and surgical management of intracranial aneurysms. Mayo Clin Proc 1995;70:153–172 [DOI] [PubMed] [Google Scholar]
- 3.Geremia G, Haklin M, Brennecke L. Embolization of experimentally created aneurysms with intravascular stent devices. AJNR Am J Neuroradiol 1994;15:1223–1231 [PMC free article] [PubMed] [Google Scholar]
- 4.Wakhloo AK, Schellhammer F, de Vries J, Haberstroh J, Schumacher M. Self-expanding and balloon-expandable stents in the treatment of carotid aneurysms: an experimental study in a canine model. AJNR Am J Neuroradiol 1994;15:493–502 [PMC free article] [PubMed] [Google Scholar]
- 5.Marks MP, Dake MD, Steinberg GK, Norbash AM, Lane B. Stent placement for arterial and venous cerebrovascular disease: preliminary experience. Radiology 1994;191:441–446 [DOI] [PubMed] [Google Scholar]
- 6.Lieber BB, Stancampiano AP, Wakhloo AK. Alteration of hemodynamics in aneurysm models by stenting: influence of stent porosity. Ann Biomed Eng 1997;25:460–469 [DOI] [PubMed] [Google Scholar]
- 7.Wakhloo AK, Lanzino G, Lieber BB, Hopkins LN. Stents for intracranial aneurysms: the beginning of a new endovascular era? Neurosurgery 1998;43:377–379 [DOI] [PubMed] [Google Scholar]
- 8.Dotter, C.T. Transluminally-placed coilspring endarterial tube grafts. Long-term patency in canine popliteal artery. Invest Radiol 1969;4:329–332 [DOI] [PubMed] [Google Scholar]
- 9.Schatz RA. A view of vascular stents. Circulation 1989;79:445–457 [DOI] [PubMed] [Google Scholar]
- 10.Palmaz JC. Intravascular stenting: from basic research to clinical application. Cardiovasc Intervent Radiol 1992;15:279–284 [DOI] [PubMed] [Google Scholar]
- 11.Wakhloo AK, Tio FO, Lieber BB, Schellhammer F, Graf M, Hopkins LN. Self-expanding nitinol stents in canine vertebral arteries: hemodynamics and tissue response. AJNR Am J Neuroradiol 1995;16:1043–1051 [PMC free article] [PubMed] [Google Scholar]
- 12.Tenjin H, Asakura F, Nakahara Y, et al. Evaluation of intraaneurysmal blood velocity by time-density curve analysis and digital subtraction angiography. AJNR Am J Neuroradiol 1998;19:1303–1307 [PMC free article] [PubMed] [Google Scholar]
- 13.Kawanishi M, Nagasawa S, Ohta T, Kajimoto S, Kondoh S. Simulation study on therapeutic vertebral artery occlusion for VA-PICA giant aneurysm. Neurol Res 1994;16:100–103 [DOI] [PubMed] [Google Scholar]
- 14.Nagasawa S, Kawanishi M, Tada Y, Kawabata S, Ohta T. Simulation of therapeutic parent artery occlusion for basilar head aneurysms: hemodynamic effect of occlusion sites and diameters of collateral arteries. Neurol Res 1999;21:180–184 [DOI] [PubMed] [Google Scholar]
- 15.Roach MR. A model study of why some intracranial aneurysms thrombose but others rupture. Stroke 1978;9:583–587 [DOI] [PubMed] [Google Scholar]
- 16.Livescu V. Influence of stent design on intraaneurysmal flow: a piv study [master’s thesis]. Buffalo, NY: State University of New York at Buffalo;2001
- 17.Strother CM, Graves VB, Rappe A. Aneurysm hemodynamics: an experimental study. AJNR Am J Neuroradiol 1992;13:1089–1095 [PMC free article] [PubMed] [Google Scholar]
- 18.Ujiie H, Tachibana H, Hiramatsu O, Hazel AL, Matsumoto T, Ogasawara Y, Nakajima H, Hori T, Takakura K, Kajiya F. Effects of size and shape (aspect ratio) on the hemodynamics of saccular aneurysms: a possible index for surgical treatment of intracranial aneurysms. Neurosurgery 1999;45:119–129 [DOI] [PubMed] [Google Scholar]
- 19.Graves VB, Strother CM, Partington CR, Rappe A. Flow dynamics of lateral carotid artery aneurysms and their effects on coils and balloons: an experimental study in dogs. AJNR Am J Neuroradiol 1992;13:189–196 [PMC free article] [PubMed] [Google Scholar]


