Abstract
BACKGROUND AND PURPOSE: The potential pitfalls in the diagnosis of dural sinus thrombosis include the presence of arachnoid granulations, intrasinus fibrotic bands (so-called septa), and hypoplasia or aplasia of the dural sinuses. The purpose of this study was to assess the appearance, distribution, and prevalence of arachnoid granulations and septa in the dural sinuses by using a high resolution 3D contrast-enhanced magnetization prepared rapid acquisition gradient-echo (MPRAGE) imaging sequence.
METHODS: Conventional MR images and contrast-enhanced MPRAGE images of 100 consecutive patients who had no abnormalities of the dural sinuses were retrospectively reviewed. The incidence, site, number, size, signal intensity, and shape of arachnoid granulations and septa within the sinuses and their relationship with adjacent veins were recorded.
RESULTS: With 3D contrast-enhanced MPRAGE imaging, 433 round, oval, or lobulated focal filling defects were found in a total of 90 patients. Curvilinear septa were observed in 92 patients. Sixty-nine patients had round, oval, or lobulated defects in the transverse sinus, 59 had such defects in the superior sagittal sinus, and 47 had such defects in the straight sinus. All except two of the above defects were isointense relative to CSF on all images. These structures were presumed to be arachnoid granulations. Of 431 arachnoid granulations, 233 (53.8%) were located in the superior sagittal sinus, 122 (28.1%) in the transverse sinus, and 76 (17.6%) in the straight sinus. One or more veins were seen to enter arachnoid granulations in 414 (96%) instances.
CONCLUSION: The contrast-enhanced 3D MPRAGE imaging sequence showed a much higher prevalence and a different distribution of arachnoid granulations and septa within dural sinuses than have been observed in previous radiologic studies. Arachnoid granulations were closely related spatially to veins.
Several entities can be encountered in the imaging evaluation of the dural sinuses to assess for thrombosis, including arachnoid (pacchionian) granulations, intrasinus septa (fibrotic bands), and hypoplasia or aplasia of the dural sinuses (1–13). Arachnoid granulations are observed in two-thirds of cadaveric specimens and are most commonly found in the superior sagittal sinus and transverse sinus (7, 8, 14). The reported frequency of arachnoid granulations on images is variable, however, and ranges from 0.3% to 55% (6, 7, 15). Previous imaging reports (as opposed to cadaver studies) have rarely found these structures in the superior sagittal sinus or straight sinus. This may be because of poor visibility of these two sinuses on conventional axial MR images and CT scans, limits of resolution on MR images, or volume averaging of the superior sagittal sinus with the cranial vertex.
High resolution 3D contrast-enhanced magnetization prepared rapid acquisition gradient-echo (MPRAGE) imaging has been used as a means to depict intracranial dural sinus thrombosis (16). Intradural thrombus, which is generally hypo- or isointense relative to brain parenchyma, has high contrast relative to the high signal intensity of flowing blood on 3D contrast-enhanced MPRAGE images (16). This pulse sequence, which uses a 1.25-mm section thickness and 3D data set, would also be expected to precisely depict normal structures within dural sinuses and distinguish normal structures from occlusive disease. The purpose of this study was to describe the appearance, distribution, and prevalence of arachnoid granulations and septa within patent dural sinuses by using a 3D contrast-enhanced MPRAGE pulse sequence.
Methods
The patient population consisted of 100 consecutive patients (44 men; age range, 1–89 years) who underwent clinical MR imaging of the brain that included a 3D contrast-enhanced MPRAGE imaging sequence, which was part of the clinical protocol at our institution. The patient population was restricted to patients who had normal appearance of the dural sinuses on conventional MR images and contrast-enhanced MPRAGE images, except for well-defined, focal filling defects consistent with arachnoid granulations or heterotopic gray matter (outlined below). Patients with findings consistent with dural sinus thrombosis, brain tumor adjacent to or involving the dural sinuses, traumatic or surgical dural sinus disruption, intracranial hypertension on spin-echo MR images, or those whose imaging studies were technologically inadequate were excluded from this analysis. All images were retrospectively reviewed and findings were determined by the consensus of two experienced neuroradiologists (Y.K., T.S.).
MR imaging studies were performed on a 1.5-T system (Magnetom Vision; Siemens, Erlangen, Germany) with use of a head coil. T1-weighted spin-echo images (600–700/14–24 [TR/TE]), T2-weighted fast spin-echo images (3700/96; echo train length, seven), and fluid-attenuated inversion recovery images (8000/120; echo train length, seven; inversion time, 2000 ms) were obtained in all 100 patients. Other imaging parameters included section thickness of 5 mm, intersection gap of 1 mm, field of view of 220 mm, matrix of 256 × 224, and one excitation. An IV infusion of 0.1 to 0.15 mmol/kg of contrast medium was manually administered at a rate of 1 to 2 mL/s and then T1-weighted MR and contrast-enhanced MPRAGE imaging sequences were performed. The order of the contrast-enhanced MPRAGE imaging sequence and the contrast-enhanced T1-weighted MR imaging sequence varied among individual patients, although both of these sequences were performed within a period of 10 minutes after contrast material infusion. The contrast-enhanced MPRAGE imaging sequence was begun within a period ranging from 10 seconds to 4 minutes after infusion of contrast material. The contrast-enhanced MPRAGE imaging sequence parameters included 13.5/7; inversion time, 300 ms; delay time, 300 ms; flip angle, 15 degrees; matrix, 192 × 256; field of view, 20 cm; section thickness, 1.25 mm; bandwidth, 130 Hz/pixel; and slab thickness, 13.5 to 14 cm. Pixel size on source images was 0.78 × 0.78 mm. The time of acquisition was 7 minutes 43 seconds. All sequences were oriented in the axial plane, except for those of nine patients who had contrast-enhanced T1-weighted images obtained solely in the coronal plane.
Contrast-enhanced MPRAGE imaging was performed through the entire head in 108 sections, and source images were reviewed in the axial plane. Axial images were reconstructed in the sagittal plane by using the multiplanar reconstruction program operating on the MR imaging console. Overlapping sagittal images with a section thickness of 1.3 mm and an intersection distance of 1.2 mm were obtained in each case to better depict the superior sagittal sinus and straight sinus. In a few selected cases, coronal or orthogonal reconstructions were also performed.
The first step in image analysis was examination of all contrast-enhanced MPRAGE data sets for well-defined focal filling defects within the lumen of the dural sinuses. Next, these findings were correlated with the findings of the other MR imaging sequences. Criteria for the focal filling defects were as follows: 1) definite position within a dural sinus, 2) visibility on both the source and reconstructed images, and 3) >50% of the circumference of the defect surrounded by contrast material. Filling defects were considered to represent arachnoid granulations if they were isointense with CSF on all pulse sequences. The incidence, site, number, size, signal intensity, shape, and internal morphology of focal defects were recorded. Filling defects consistent with arachnoid granulations have been reported to be in close proximity to veins entering the dural sinus (5, 7, 8). For this reason, the location of nearby veins entering the sinus was recorded. In addition, the incidence and imaging characteristics of linear or bandlike structures within the dural sinuses were also recorded. In all cases, images were correlated with the appearance of these structures on the corresponding images on other pulse sequences.
To distinguish normal filling defects within dural sinuses from dural sinus thrombosis on the MPRAGE images, two cases with dural sinus thrombosis revealed by 3D contrast-enhanced MPRAGE imaging and confirmed by conventional angiography were retrospectively identified from our clinical files. One of the two cases was a case of untreated dural sinus thrombosis and the other was a case of treated dural sinus thrombosis in which partial recanalization had occurred. The dural sinus thrombosis shown on the images from these two cases were compared with normal appearing dural sinuses on the 3D contrast-enhanced MPRAGE images for the following features: signal intensity, extension into adjacent dural sinuses, dilatation of the affected dural sinus, sharpness of margin around the affected dural sinus, and sharpness of the filling defect within the dural sinus. Because large arachnoid granulations tended to fill most of the width of a dural sinus, the typical appearance of arachnoid granulations was compared with that of the case of untreated dural sinus thrombosis. Because both septa within the dural sinus and treated dural sinus thrombosis produce a linear filling defect, cases of dural sinuses containing septa were compared with the case of partially treated dural sinus thrombosis.
Results
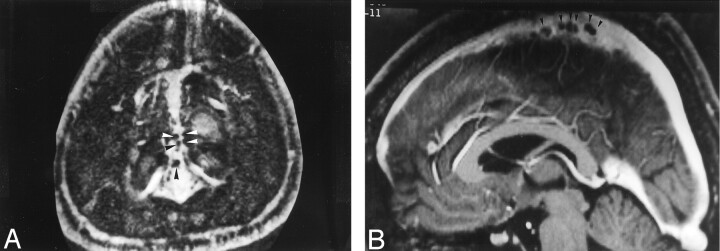
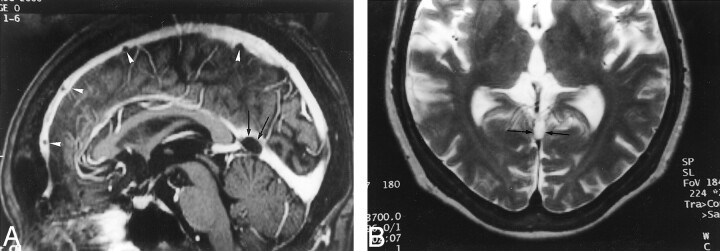
Discrete focal filling defects were identified in at least one dural sinus in each of 90 patients and more than one dural sinus in each of 63 patients on 3D contrast-enhanced MPRAGE images. Filling defects were located in the transverse sinus in 69 cases (Fig 1), superior sagittal sinus in 59 cases (Fig 2), and straight sinus in 47 cases (Figs 3 and 4 and Table 1). A total of 433 focal filling defects were observed in 90 participants: 233 (53.8%) filling defects in the superior sagittal sinus, 122 (28.1%) in the transverse sinus, and 76 (17.5%) in the straight sinus (Table 2).
Fig 1.
Images reveal arachnoid granulation in a 37-year-old man with postoperative changes of a right temporal lobe oligodendroglioma.
A, 3D contrast-enhanced MPRAGE image (13.5/7/1; inversion time, 300 ms; flip angle, 15 degrees) shows a well-circumscribed, round, hypointense focal filling defect (arrowheads) within the right transverse sinus.
B, Axial T2-weighted MR image (3700/96) shows that the structure shown in A (arrowheads) is isointense to CSF.
C, Unenhanced T1-weighted MR image (627/17) shows that the structure shown in A and B is also isointense to CSF in this image.
Fig 2.
Images from the case of a 40-year-old woman with headaches who had normal results of an MR imaging study.
A, Axial source image acquired with a 3D contrast-enhanced MPRAGE sequence shows numerous small filling defects (arrowheads), consistent with arachnoid granulations, aligned along the lateral margin of the superior sagittal sinus.
B, Sagittal reconstruction image obtained with a 3D contrast-enhanced MPRAGE imaging sequence shows an array of arachnoid granulations within the superior sagittal sinus.
Fig 3.
Images reveal arachnoid granulations in a 54-year-old man with headaches who had normal results of an MR imaging study.
A, Sagittal reconstruction image obtained from 3D contrast-enhanced MPRAGE imaging sequence shows a large CSF-isointense filling defect, consistent with an arachnoid granulation (black arrows), at the junction point of the vein of Galen and straight sinus. Note also the presence of smaller arachnoid granulations within the superior sagittal sinus (white arrowheads).
B, Axial T2-weighted MR image shows the defect seen in A as a discrete, focal CSF-isointense filling defect within the straight sinus.
Fig 4.
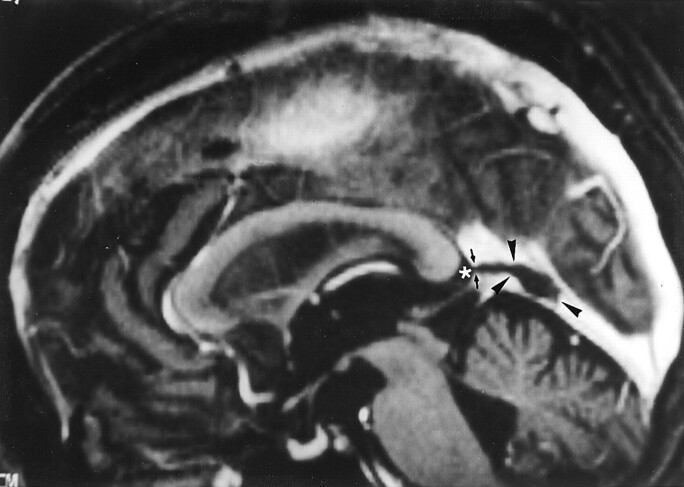
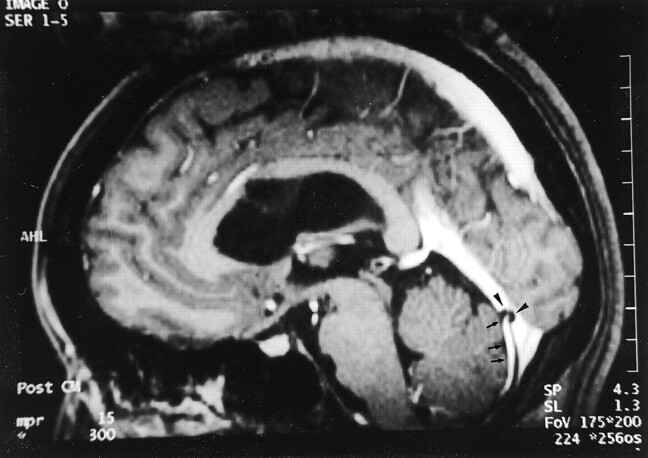
Image reveals arachnoid granulation in a 55-year-old woman with seizures who had normal results of an MR imaging study. Sagittal reconstruction image obtained with a 3D contrast-enhanced MPRAGE sequence shows a large CSF-isointense pouchlike focal filling defect (arrowheads) in the straight sinus. Note that this structure extends to the adjacent CSF space (asterisk) via the orifice opening to the subarachnoid space (small arrows).
TABLE 1:
Distribution of focal filling defects within the dural sinuses on the 3D contrast-enhanced MPRAGE images of 90 cases (100 consecutive participants)
| Sinus | No. of Cases |
|---|---|
| Superior sagittal sinus | 59 |
| Transverse sinus | 69 |
| Right | 41 |
| Left | 55 |
| Bilateral | 27 |
| Straight sinus | 47 |
| Junction point with vein of Galen | 25 |
| Inferior third portion | 33 |
| Superior third portion | 1 |
| Sigmoid sinus | 0 |
| Vein of Galen | 2 |
TABLE 2:
Distribution of 433 focal filling defects within the dural sinuses on the 3D contrast-enhanced MPRAGE images of 90 cases (100 participants)
| Defect Location | No. of Defects | % of Total |
|---|---|---|
| Superior sagittal sinus | 233 | 53.8 |
| Anterior and superior portion | 227 | 53.7 |
| Posterior portion | 6 | 0.2 |
| Right transverse sinus | 48 | 11.0 |
| Midlateral portion and transverse/sigmoid junction | 41 | 9.5 |
| Medial portion | 7 | 1.6 |
| Left transverse sinus | 74 | 17.1 |
| Midlateral portion and transverse/sigmoid junction | 71 | 16.4 |
| Medial portion | 3 | 0.7 |
| Straight sinus | 76 | 17.6 |
| Junction point with vein of Galen | 29 | 6.7 |
| Inferior third portion | 46 | 10.6 |
| Superior portion | 1 | 0.2 |
| Vein of Galen | 2 | 0.5 |
The most common locations for defects in the superior sagittal sinus were at the anterior and superior portions of the sinus. The most common locations for defects in the straight sinus were at the junction of the straight sinus and the vein of Galen and in the inferior third of the straight sinus. Other distribution characteristics for each sinus are detailed in Table 2. Approximately one-third of the patients (20 of 59 patients) with at least a filling defect in the superior sagittal sinus had more than five filling defects (Fig 2). On the other hand, no patient had more than four filling defects in a single transverse sinus.
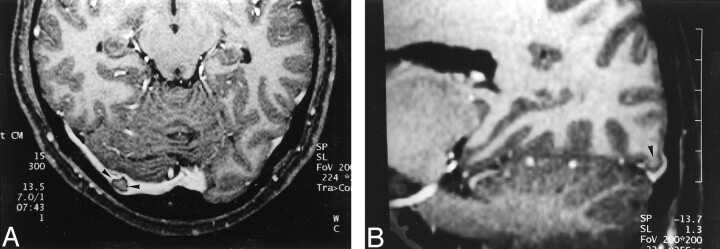
All the 433 focal filling defects except two had low signal intensity relative to brain parenchyma (isointense to CSF and consistent with arachnoid granulations) on 3D contrast-enhanced MPRAGE images and had a round, oval, or lobulated shape (Figs 1–4). In four patients, the defect was elongated and pouchlike rather than round or oval (Fig 4). When visible on spin-echo MR images, the 431 defects that were hypointense to brain tissue on MPRAGE images were hyperintense to brain parenchyma on T2-weighted MR images, hypo- or isointense on unenhanced T1-weighted MR images, hypointense on fluid-attenuated inversion recovery images, and non-enhancing and hypointense on contrast-enhanced T1-weighted MR images (Fig 1). The remaining two focal filling defects were isointense to brain parenchyma on all sequences, surrounded by a CSF rim, and were seen to be contiguous with brain tissue on the reconstruction images (Fig 5). These defects were presumed to be invaginations of brain tissue into the dural sinus.
Fig 5.
Images reveal invagination of brain tissue into the dural sinus in a 32-year-old woman with pituitary hormonal abnormalities who had otherwise normal results of an MR imaging examination.
A, Source image acquired with a 3D contrast-enhanced MPRAGE sequence shows a focal filling defect in the right transverse sinus (arrowheads) that is isointense to brain parenchyma.
B, Reconstruction image obtained in an oblique sagittal plane shows that the structure seen in A is contiguous with brain parenchyma (arrowhead), consistent with invagination of brain tissue into the dural sinus.
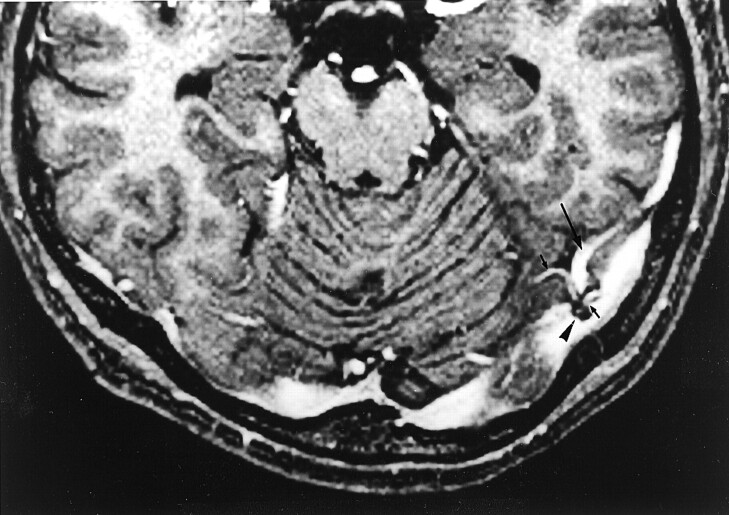
The mean diameter of the arachnoid granulations according to location was 1.5 ± 0.4 mm in the superior sagittal sinus, 4.1 ± 1.5 mm in the transverse sinus, 3.8 ± 1.0 mm at the junction of the straight sinus with the vein of Galen, and 2.0 ± 0.5 mm within the inferior third of the straight sinus (Table 3). Of the 431 hypointense defects, the presence of one or more veins entering the filling defects was identified in 414 (96%) (Figs 6 and 7). The insertion points of veins into the focal filling defects were easily visible on the 3D contrast-enhanced MPRAGE images but were typically less visible on images acquired with other pulse sequences.
TABLE 3:
Sizes of 433 defects in the major axis in each specific sinus
| Size (mm) | Superior Sagittal Sinus |
Transverse Sinus |
Straight Sinus |
|||
|---|---|---|---|---|---|---|
| Anterior and Superior | Posterior | Right | Left | Junction Point | Inferior Third | |
| ≤2 | 197 | 1 | 11 | 17 | 3 | 14 |
| >2, ≤5 | 29 | 5 | 30 | 44 | 18 | 18 |
| >5, ≤8 | 1 | 0 | 5 | 7 | 3 | 1 |
| >8 | 0 | 0 | 2 | 6 | 5 | 0 |
| Mean (mm) | 1.5 | 2.5 | 4.0 | 4.2 | 3.8 | 2.0 |
Note.—Junction Point indicates junction with vein of Galen.
Fig 6.
Reconstruction image from a 3D contrast-enhanced MPRAGE image shows relationship of intracranial veins to arachnoid granulation in a 35-year-old man with normal results of an MR imaging study. The posteroinferior cerebellar vein (arrows) is seen to enter into a CSF-isointense structure (arrowheads), consistent with an arachnoid granulation.
Fig 7.
Image reveals association of intracranial veins and arachnoid granulations in a 41-year-old man with normal results of an MR imaging examination. Axial source image acquired with a 3D contrast-enhanced MPRAGE sequence shows multiple venous tributaries (small arrows), including the vein of Labbé (large arrow), entering into an arachnoid granulation (arrowhead) within the transverse sinus.
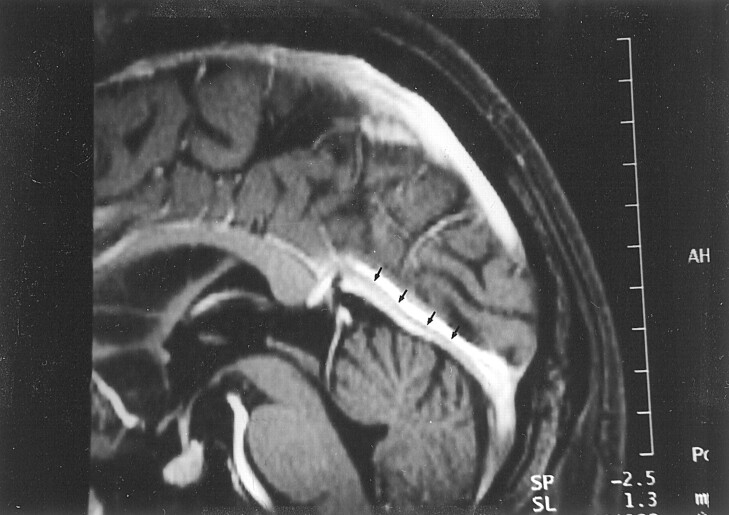
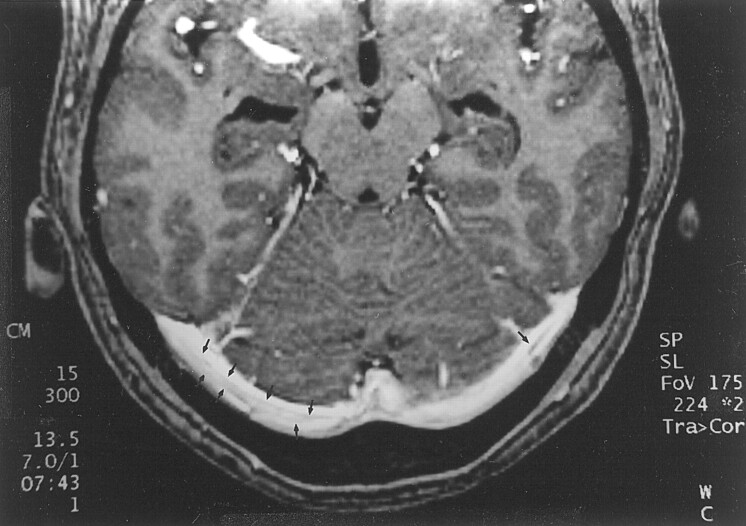
Septa-like structures in the sinuses were frequently seen on 3D MPRAGE images. These structures were seen within the straight sinus (Fig 8) in 92 patients and within the transverse sinus (Fig 9) in 80 patients. Less commonly, they were also seen in the sigmoid sinus.
Fig 8.
Image shows appearance of septum within dural sinus in a 68-year-old woman with normal results of an MR imaging examination. Reconstruction image from a 3D contrast-enhanced MPRAGE image shows a linear structure (arrows), consistent with a septum within the straight sinus.
Fig 9.
Image shows septa within dural sinuses in a 39-year-old man with normal results of an MR imaging study. Axial source image from a 3D contrast-enhanced MPRAGE image shows curvilinear septa (arrows) that have intermediate signal intensity in both transverse sinuses. The septa seen in this study were usually smooth, thin, and not limited to the center of the sinus.
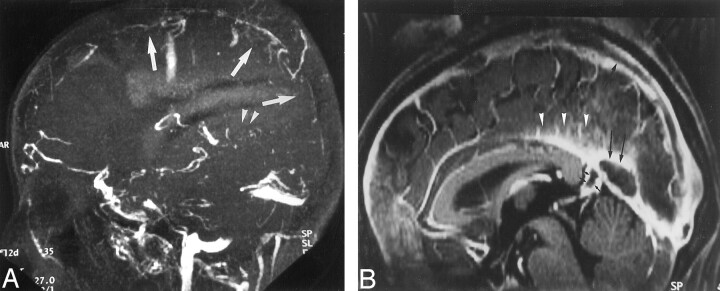
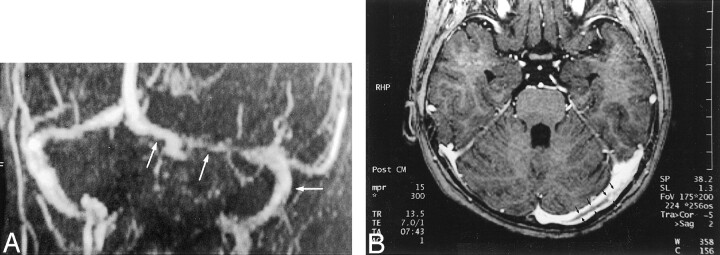
Comparison of arachnoid granulations within dural sinuses with the two cases of dural sinus thrombosis showed that arachnoid granulations were always isointense to CSF, but the signal intensity of thrombosis differed from that of CSF on all images, regardless of pulse sequence, in both instances. Furthermore, the case of untreated dural sinus thrombosis was observed to widen the straight sinus and extend into the adjacent vein of Galen, to have a slightly irregular margin, and to produce an irregular rim of contrast enhancement around the dural sinus (Fig 10). These features were not observed in any case of arachnoid granulations. Comparison of the case of partially treated dural sinus thrombosis with the cases of septa within dural sinuses showed that defects due to residual dural sinus thrombosis were thicker and solely centrally located and had irregular margins (Fig 11), whereas septa produced thin defects with sharp margins. In addition, neither case of dural sinus thrombosis showed the presence of a vein entering the dural sinus at the site of the filling defect caused by the thrombosis, whereas this finding was frequently seen with arachnoid granulations.
Fig 10.
Comparison of 2D time-of-flight MR venograms and 3D contrast-enhanced MPRAGE images of a 37-year-old woman with postpartum dural sinus thrombosis.
A, 2D time-of-flight maximum intensity projection MR venogram shows lack of flow-related enhancement in superior sagittal sinus (arrows) and straight sinus (arrowheads). Note that by using this technique, the thrombosis is inferred by absence of a finding (ie, lack of flow-related enhancement) rather than by direct visualization of the thrombus.
B, Sagittal reconstruction image obtained from a 3D contrast-enhanced MPRAGE image directly shows thrombus in the straight sinus and superior sagittal sinus (large arrows). The thrombus is also seen to extend into the adjacent vein of Galen (small arrows), have irregular margins, and produce irregular contrast enhancement of the inferior sagittal sinus (arrowheads), which were findings that were not seen in cases showing arachnoid granulations.
Fig 11.
Comparison of 2D time-of-flight venograms and 3D contrast-enhanced MPRAGE images for evaluating residual thrombosis in a 5-year-old female patient treated for dural sinus thrombosis 1 month before MR imaging.
A, Maximum intensity projection 2D time-of-flight MR venogram obtained in a slightly oblique coronal plane shows narrowing of the left transverse sinus and patent sigmoid sinus (arrows). The narrowing at the point of the middle arrow could represent stenosis due to thrombus formation or congenital hypoplasia. Again, the thrombosis is inferred by a negative finding (ie, lack of flow-related enhancement) rather than directly visualized.
B, Axial source image from a 3D contrast-enhanced MPRAGE image directly shows thrombus (arrows) in the left transverse sinus. The irregular margin and increased thickness allow this entity to be distinguished from septa within dural sinuses (compare with Fig 9).
Discussion
In this study, almost all the 433 focal filling defects detected on 3D contrast-enhanced MPRAGE images had signal intensity that was isointense relative to CSF. These filling defects were presumed to represent arachnoid granulations, which are invaginations of the arachnoid membrane that perforate gaps in the dura and protrude into the lumen of the dural sinus. These structures are generally considered to provide a pathway for drainage of CSF from the subarachnoid space into the dural sinus. The granulations can be seen with the unaided eye; however, structures within the granulations, called villi, can be seen only with the aid of a microscope.
Two filling defects were isointense to brain parenchyma on all sequences and were presumed to be the invaginations of normal brain tissue. Therefore, invagination of brain tissue into the dural sinus is uncommon but should be considered in the differential diagnosis of a focal filling defect within dural sinuses. Notably, a previous report presents a case of invagination of heterotopic brain tissue into a dural sinus that was mistaken for thrombus (17).
The 3D contrast-enhanced MPRAGE imaging sequence used in this study is a heavily T1-weighted imaging technique with a high signal-to-noise ratio that has no interference from slow or in-plane flow (16). All these factors seem to have contributed to the high detectability of arachnoid granulations in our study. In addition, this pulse sequence allows whole brain coverage and multiplanar reconstruction capability, which, in our study, allowed for high visibility of small arachnoid granulations in the superior sagittal sinus and straight sinus on sagittal reconstruction planes. Using this technique, it seems possible to detect arachnoid granulations as small as 1 to 2 mm. Therefore, it is perhaps not surprising that the frequency of arachnoid granulations in our study is much higher than that noted in previous MR imaging and CT reports (0.3–55%); however, the frequency was also somewhat higher than the 66% rate noted in an autopsy study (7). One possible reason for the lower frequency noted at autopsy examination is that small arachnoid granulations may become smaller and less noticeable because of cessation of CSF production after death.
In this study, we used a 3D imaging sequence and thin axial images as source images for the basis for reconstruction into other imaging planes. In our experience, the choice of plane of source images does not substantially affect image quality of the various reconstruction planes. For instance, conspicuity of thrombus or arachnoid granulations is not dependent on whether axial source images or coronal source images are used to construct sagittal reformatted images. Therefore, the 3D contrast-enhanced MPRAGE imaging sequence is fundamentally different from 2D time-of-flight venography, with which choice of imaging plane is important. For example, lesion conspicuity on 2D time-of-flight imaging is best when images are obtained perpendicular to the affected dural sinuses. Because it is difficult to determine beforehand which dural sinuses are affected, the dependence on choice of imaging plane is a limitation of 2D time-of-flight venography relative to 3D contrast-enhanced MPRAGE imaging.
The relative frequency of arachnoid granulations by location in our study differed from that of previous imaging studies, in which approximately 85% to 95% were located in the transverse sinus (6, 7). In our group, slightly more than half (approximately 54%) of arachnoid granulations were located in the superior sagittal sinus. The distribution in our series more closely reflects that reported in previous anatomic studies, in which the arachnoid granulations most frequently occurred in the superior sagittal sinus and transverse sinus (8, 14, 19, 20). The average size of arachnoid granulations was smallest in the superior sagittal sinus. We infer that arachnoid granulations in the superior sagittal sinus may likely have been less frequently detected in previous studies for two reasons. First, their small size may have made them more difficult to detect when using conventional spin-echo imaging techniques. Second, most previous studies used the axial imaging plane (in which arachnoid granulations would be less obvious because of volume averaging) whereas the finely detailed sagittal reconstructed images used in our study allowed better visualization of the superior sagittal sinus.
Arachnoid granulations in the transverse sinus were easily visible on both conventional MR images and MPRAGE images because of their comparatively large size (mean diameter of 4 mm) and good signal intensity contrast with the surrounding sinus (4–7, 9, 15). Most of these arachnoid granulations were located at the lateral third of the transverse sinus and at the junction of the transverse sinus and sigmoid sinus, where the vein of Labbé and other cerebellar veins enter the sinuses, consistent with previous studies (5–7).
On 3D contrast-enhanced MPRAGE images, numerous small granulations <2 mm were frequently observed at the anterior and superior portions of the superior sagittal sinus, near the site at which the veins enter the dural sinus. They typically invaginated into the lateral and inferior surfaces of the superior sagittal sinus (Fig 2). Solitary, comparatively larger ones were occasionally found at the posterior or caudal portion of the superior sagittal sinus, generally at a position approximately 2.5 cm rostral to the torcula herophili. These characteristics of the granulations were similar to published findings of cadaveric studies (5, 21).
The straight sinus is another location in which the frequency of arachnoid granulations in our study substantially differed from the findings of previous cross-sectional imaging studies. In our study, 25% of the patients had arachnoid granulations at the junction of the straight sinus and the vein of Galen. In addition, 33% had arachnoid granulations in the inferior one-third of the straight sinus (ie, the portion of the sinus into which the posteroinferior cerebellar veins drain just above the torcula herophili). In comparison, in one previous study, only 10 arachnoid granulations were observed at this site among 573 contrast-enhanced CT studies and none among 100 MR imaging studies (7). In another study, only 11 arachnoid granulations were seen in the straight sinus on the MR images of 1118 participants (18). Arachnoid granulations at the junction of the vein of Galen and straight sinus ranged in size from 2 mm to 2 cm. These structures were occasionally very large and seemed to be connected with fibrous septa in the straight sinus. Arachnoid granulations at this site have sometimes been referred to as cavernous nodules because they have occasionally been revealed by autopsy studies to contain collagen fibers, a plexus of sinusoidal channels, and nerve fibers (22). Although we did not have a corresponding histologic study, we presumed these structures to be arachnoid granulations (or variants of granulations) because they were isointense to CSF on all images and were similar to arachnoid granulations in other locations.
One of the most distinct structural characteristics of arachnoid granulations in our study was that approximately 96% (414 of 431 granulations) were seen to have veins entering them along the internal wall of the sinus (ie, at the orifices opening to the subarachnoid space) (Figs 6 and 7). This intimate relationship between arachnoid granulations and sites of entry of veins into the dural sinuses has been previously noted. For instance, in one early study comparing angiographic and histologic findings, veins were closely related to arachnoid granulations in approximately 50% of patients older than 40 years (8). More recently, other investigators have shown three arachnoid granulations in two autopsy cases that had a central large blood vessel (5). One study noted that 95 (62%) of 154 arachnoid granulations revealed by 573 CT studies and 11 of 13 granulations revealed by 100 MR examinations were located adjacent to venous entry sites in the transverse sinus (7). Our study showed that for all dural sinuses (not just the transverse sinus), the veins did not simply course adjacent to granulations but apparently entered them (Fig 6). These findings are consistent with reports of microscopic findings indicating that venous entry sites have a close relationship with arachnoid granulations (14, 23, 24). On the basis of this structural finding, our findings support the hypothesis that one likely mechanism that allows arachnoid granulations to adjust rates of absorption of CSF is by responding to the venous pressure of endothelial channels within the arachnoid granulation via either nerve fibers or a pressure-sensitive body (25, 26).
Septa have been reported to be present on angiograms in approximately 15% of normal participants (27). However, in our series, approximately 90% of participants were found to have one or more septa in the straight sinus (Fig 8). These septa typically were oriented along the long axis of the sinus and sometimes extended the whole course of the sinus. Because the 3D contrast-enhanced MPRAGE imaging sequence is relatively free of flow artifacts and truncation artifacts, distinction of septa from these artifacts was not difficult (16). Septa in the transverse sinus sometimes appeared as multiple thin parallel structures (Fig 9). Like the septa in the straight sinus, those in the transverse and sigmoid sinuses were oriented along the long axis of the sinus. Therefore, these septa had a curved shape that conformed to that of the sinus.
It is worth comparing lesion conspicuity on the 3D MPRAGE image with those obtained by more conventional sequences such as 2D time-of-flight MR venography. In a previous study, we compared 3D contrast-enhanced MPRAGE images, spin-echo images, and 2D time-of-flight MR venograms by using conventional angiograms as the references for 35 consecutive patients (16). Dural sinus thrombosis was diagnosed at 26 sites in 12 patients by conventional angiography. The sensitivity of the 3D contrast-enhanced MPRAGE imaging was 83% compared with 51% for 2D time-of-flight MR venography and 33% for T1-weighted MR imaging. Specificity was also higher for 3D contrast-enhanced MPRAGE imaging (99%) than 2D time-of-flight venography (92%) and T2-weighted MR imaging (84%). Performance characteristics for the 3D contrast-enhanced MPRAGE imaging sequence were best for combined use of source images and maximum intensity projection images, especially for relatively small deep venous structures, such as the basal vein of Rosenthal and inferior sagittal sinus.
In our experience, 3D contrast-enhanced MPRAGE imaging is superior to 2D time-of-flight venography for distinction of various types of intradural filling defects (eg, distinction of small focus of thrombus from arachnoid granulations). Specifically, arachnoid granulations that can be difficult to discern when using the 2D time-of-flight method are relatively easily seen on 3D contrast-enhanced MPRAGE images. For instance, a clot smaller than what we have depicted herein (Fig 10) would have characteristics similar to those of an arachnoid granulation. However, comparison of the typical appearance of arachnoid granulations in our series showed some findings that may be useful for distinguishing these structures from dural sinus thrombosis. First, arachnoid granulations are isointense relative to CSF, whereas the signal intensity of thrombosis differs from that of CSF on both T1- and T2-weighted MR images (11). Second, granulations did not widen the dural sinus, whereas thrombosis may expand the dural sinus. Third, on the 3D contrast-enhanced MPRAGE images, arachnoid granulations and dural sinuses containing arachnoid granulations always had sharp margins, whereas thrombosis can produce irregular margins. Fourth, arachnoid granulations were not seen to extend into adjacent dural sinuses, whereas thrombosis may extend from one dural sinus to another. Finally, on the 3D contrast-enhanced MPRAGE images, a vein was typically seen entering the dural sinus near the site of an arachnoid granulation, a finding that would not be expected for dural sinus thrombosis (Figs 3, 4, 7, and 10).
As opposed to the appearance of dural sinus occlusion, partial recanalization of previous dural sinus thrombosis can produce a linear filling defect similar, in some ways, to the septa seen in many of the normal dural sinuses found in our study. Septa in sinuses were, however, always thin defects with sharp margins and were typically seen on only one image, whereas partial recanalization of a previously thrombosed dural sinus generally was seen to have thick defects with irregular margins on contiguous images (Figs 8, 9, and 11). Nonetheless, we recognize that these suggestions are merely guidelines. A blinded formal study with blinded readers comparing the appearance of these entities is needed to appropriately assess the reliability of these findings in distinguishing normal findings from dural sinus thrombosis on 3D contrast-enhanced MPRAGE images.
Conclusion
The 3D contrast-enhanced MPRAGE imaging sequence used in our study showed a much higher prevalence and different distribution of arachnoid granulations within dural sinuses than were observed in previous radiologic reports. Our observations, including the relationship of veins entering the dural sinus to arachnoid granulations, are in conformity with anatomic descriptions noted in cadaveric studies. This MR imaging sequence provides excellent anatomic detail and deserves further study in assessment of pathologic states involving the dural sinuses.
Footnotes
Presented at an Radiological Society of North America educational exhibition, Chicago, IL: December 2000.
References
- 1.Cure JK, Van Tassel P, Smith MT. Normal and variant anatomy of the dural venous sinuses. Semin Ultrasound CT MR 1994;15:499–519 [DOI] [PubMed] [Google Scholar]
- 2.Cure JK, Van Tassel P. Congenital and acquired abnormalities of the dural venous sinuses. Semin Ultrasound CT MR 1994;15:520–539 [DOI] [PubMed] [Google Scholar]
- 3.Zouaoui A, Hidden G. Cerebral venous sinuses: anatomical variants or thrombosis? Acta Anat (Basel) 1988;133:318–324 [DOI] [PubMed] [Google Scholar]
- 4.Chin SC, Chen CY, Lee CC, et al. Giant arachnoid granulation mimicking dural sinus thrombosis in a boy with headache: MRI. Neuroradiology 1998;40:181–183 [DOI] [PubMed] [Google Scholar]
- 5.Mamourian AC, Towfighi J. MR of giant arachnoid granulations: a normal variant presenting as a mass within the dual venous sinus. AJNR Am J Neuroradiol 1995;16:901–904 [PMC free article] [PubMed] [Google Scholar]
- 6.Roche J, Warner D. Arachnoid granulations in the transverse and sigmoid sinuses: CT, MR, and MR angiographic appearance of a normal anatomic variation. AJNR Am J Neuroradiol 1996;17:677–683 [PMC free article] [PubMed] [Google Scholar]
- 7.Leach JL, Jones BV, Tomsick TA, Stewart CA, Balko MG. Normal appearance of arachnoid granulations on contrast-enhanced CT and MR of the brain: differentiation from dural sinus disease. AJNR Am J Neuroradiol 1996;17:1523–1532 [PMC free article] [PubMed] [Google Scholar]
- 8.Grossman CB, Potts DG. Arachnoid granulations: radiology and anatomy. Radiology 1974;113:95–100 [DOI] [PubMed] [Google Scholar]
- 9.Tokiguchi S, Hayashi S, Takahashi H, et al. CT of the pacchionian body. Neuroradiology 1993;35:347–348 [DOI] [PubMed] [Google Scholar]
- 10.Ayanzen RH, Bird CR, Keller PJ, McCully FJ, Theobald MR Heiserman JE. Cerebral MR venography: normal anatomy and potential diagnostic pitfalls. AJNR Am J Neuroradiol 2000;21:74–78 [PMC free article] [PubMed] [Google Scholar]
- 11.Zimmerman RD, Ernst RJ. Neuroimaging of cerebral venous thrombosis. Neuroimaging Clin N Am 1992;2:463–485 [Google Scholar]
- 12.Ozsvath RR, Casey SO, Lustrin ES, Alberico RA, Hassankhani A, Patel M. Cerebral venography: comparison of CT and MR projection venography. AJR Am J Roentgenol 1997;169:1699–1707 [DOI] [PubMed] [Google Scholar]
- 13.Mattle HP, Wentz KU, Edelman RR, et al. Cerebral venography with MR. Radiology 1991;178:453–458 [DOI] [PubMed] [Google Scholar]
- 14.Potts DG, Reilley KF, Deonarine V. Morphology of arachnoid villi and granulations. Radiology 1972;105:333–341 [DOI] [PubMed] [Google Scholar]
- 15.Casey SO, Ozsvath RR, Choi JS. Prevalence of arachnoid granulations as detected with CT venography of the dural sinuses [letter]. AJNR Am J Neuroradiol 1997;18:993–994 [PubMed] [Google Scholar]
- 16.Liang L, Korogi Y, Sugahara T, et al. Evaluation of the intracranial dural sinuses with a 3D contrast-enhanced MP-RAGE sequence: prospective comparison with 2D-TOF MR venography and digital subtraction angiography. AJNR Am J Neuroradiol 2001;22:481–492 [PMC free article] [PubMed] [Google Scholar]
- 17.Kollar C, Hohnston I, Parker G, Harper C. Dural arteriovenous fistula in association with heterotopic brain nodule in the transverse sinus. AJNR Am J Neuroradiol 1993;19:1126–1128 [PMC free article] [PubMed] [Google Scholar]
- 18.Ikushima I, Korogi Y, Makita O, et al. MRI of arachnoid granulations within the sinuses using a FLAIR pulse sequence. Br J Radiol 1999;72:1046–1051 [DOI] [PubMed] [Google Scholar]
- 19.Key A, Retzius G. Studien in der Anatomie des Nervensystems und des Bindesgewebe . Stockholm: Norstedt and Soner;1876. :2
- 20.LeGros Clark WE. On the pacchionian bodies. J Anat 1920;55:40–48 [PMC free article] [PubMed] [Google Scholar]
- 21.Browder J, Browder A, Kaplan HA. Benign tumors of the cerebral dural sinuses. J Neurosurg 1972;37:576–579 [DOI] [PubMed] [Google Scholar]
- 22.Bergquist E, Willen. Cavernous nodules in the dural sinuses. J Neurosurg 1974;40:330–335 [DOI] [PubMed] [Google Scholar]
- 23.Upton ML, Weller RO. The morphology of cerebrospinal fluid drainage pathways in human arachnoid granulations. J Neurosurg 1985;63:867–875 [DOI] [PubMed] [Google Scholar]
- 24.Krisch B. Ultrastructure of the meninges at the site of penetration of veins through the dura mater, with particular reference to pacchionian granulations: investigations in the rat and two species of New-World monkeys (Cebus apella, Callitrix jacchus). Cell Tissue Res 1988;251:621–631 [DOI] [PubMed] [Google Scholar]
- 25.Jayatilaka AD. Arachnoid granulations in sheep. J Anat 1965;99:315–327 [PMC free article] [PubMed] [Google Scholar]
- 26.Jayatilaka AD. An electron microscopic study of sheep arachnoid granulations. J Anat 1965;99:635–649 [PMC free article] [PubMed] [Google Scholar]
- 27.Huber P. Cerebral Angiography . 2nd ed. New York: Georg Thieme Verlag;1982. :224


