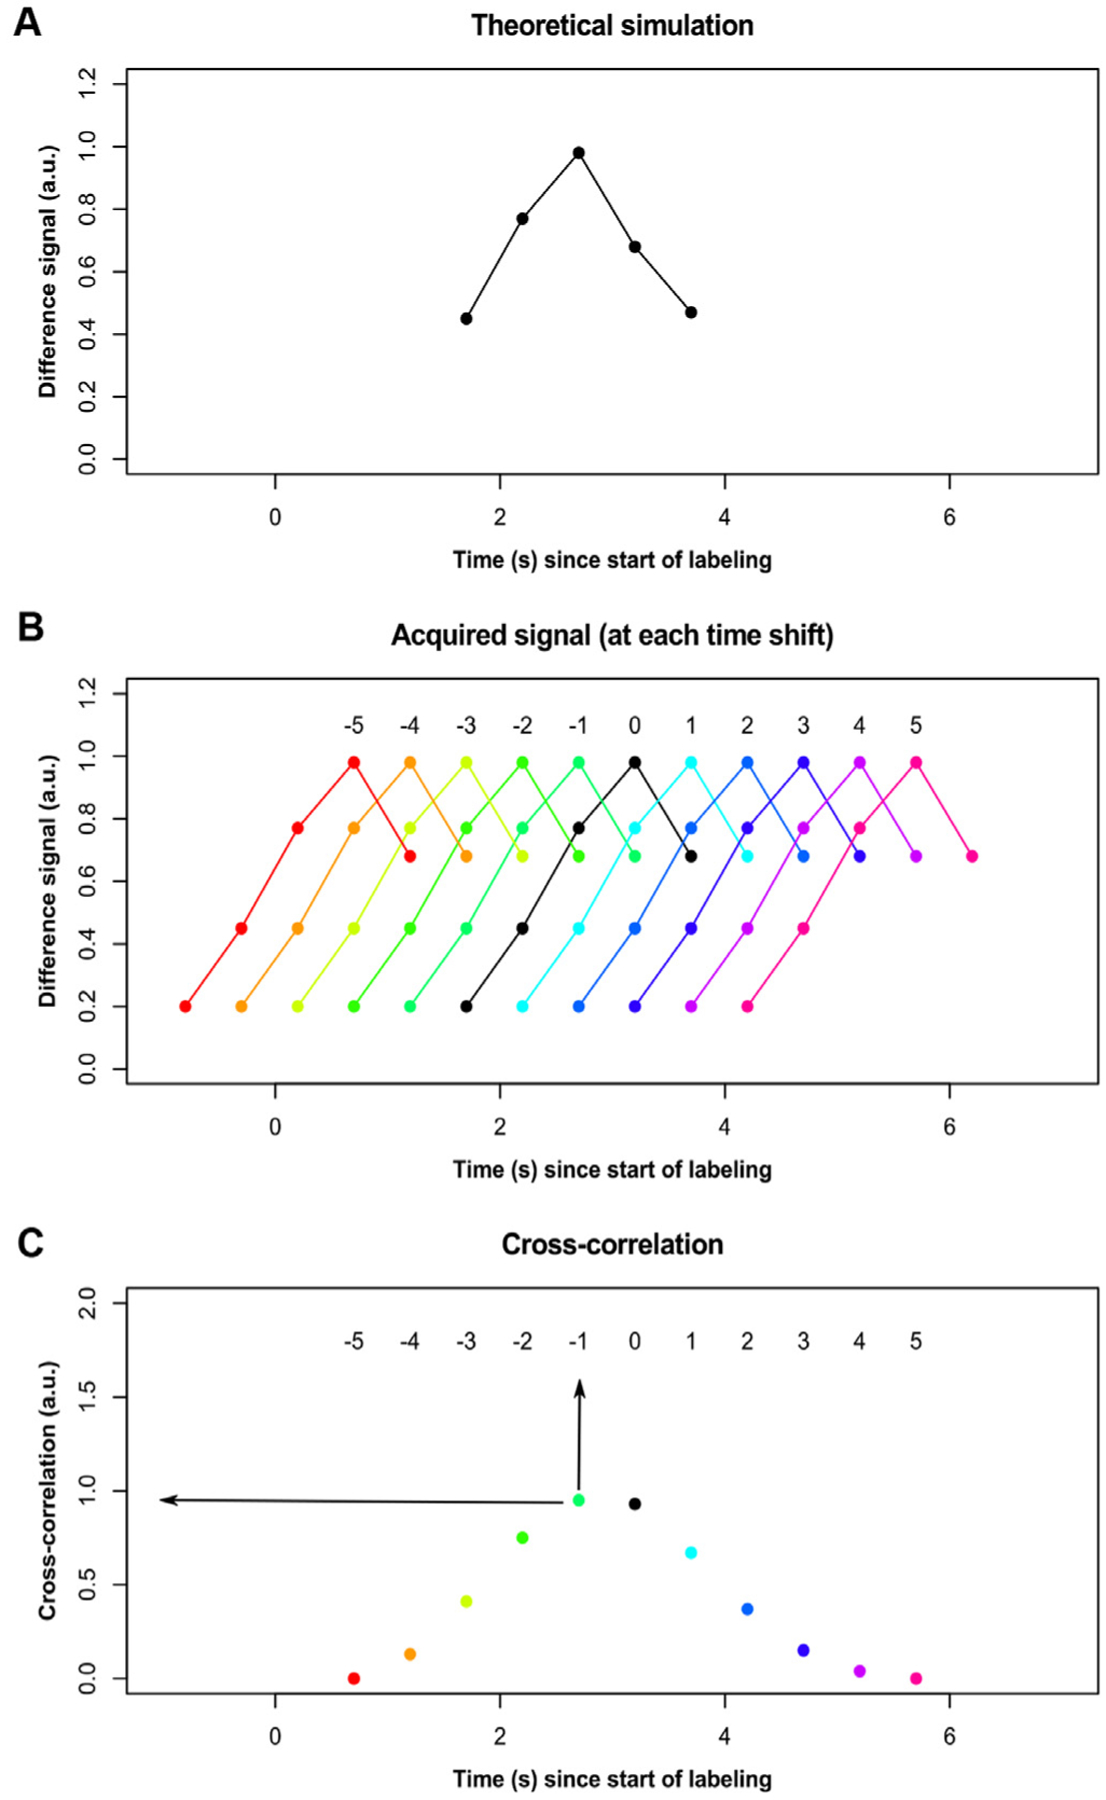
Fig. 1. Cross-correlation approach.

(A) The theoretical kinetic curve based on simulation assuming ATT = 1.2 s is shown after down-sampling to the temporal resolution of the post-labeling delay (PLD) times used. (B) The signal for any given voxel (black) is shifted in time − 5 to + 5 in increments of the PLD, and the cross-correlation between the acquired signal and the simulated signal is calculated at each shift. (C) Each voxel is then assigned the maximum correlation as well as the time shift at which that correlation is at maximum (arrows).
