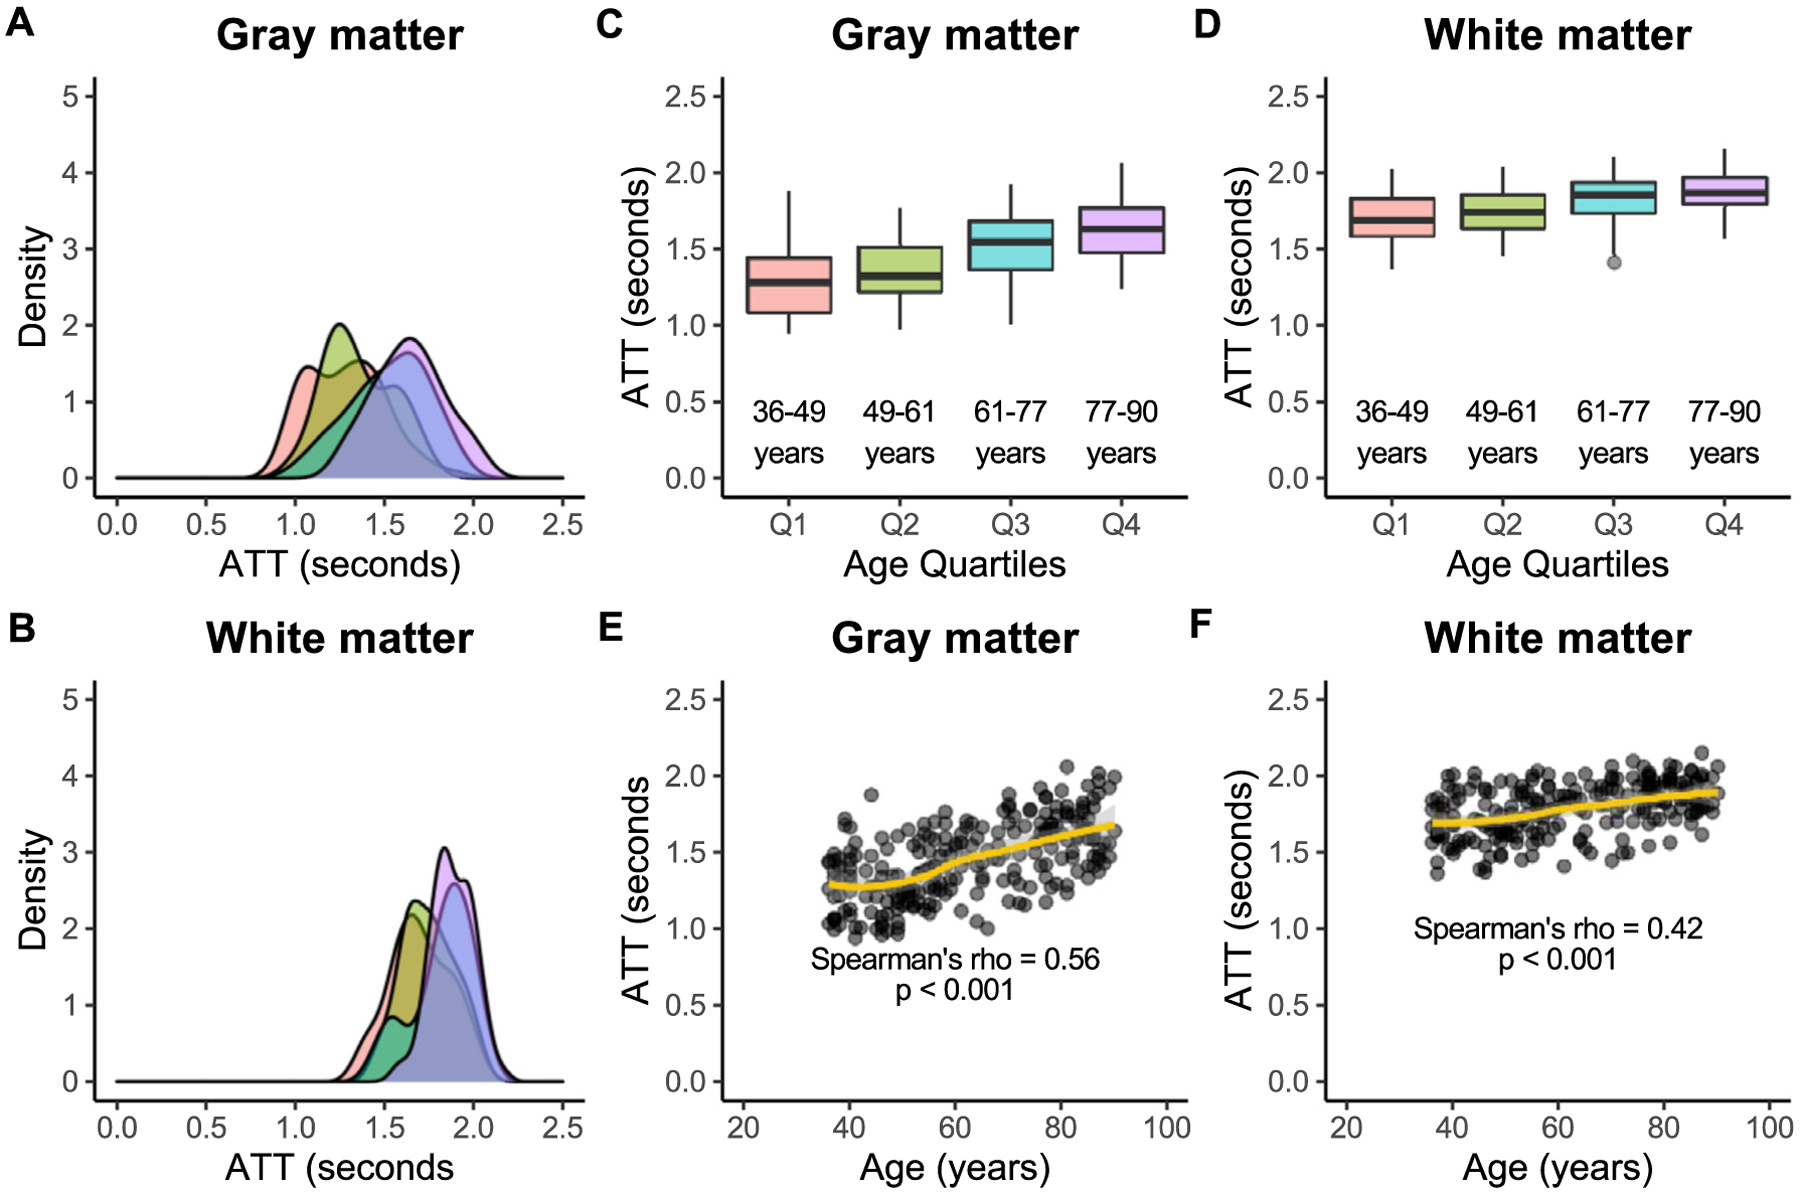
Fig. 4. Arterial transit time.

Associations between arterial transit time (ATT) and age are shown here in gray and white matter across quartiles of age: Q1 (36–49 years; red), Q2 (49–61 years; green), Q3 (61–77 years; blue), and Q4 (77–90 years; purple). Kernel density plots show that the width of the distribution of gray matter ATTs (A) may be similar to that of white matter (B) across age groups. However, gray matter ATT (C) is significantly lower than white matter ATT (D) in all age groups. Lastly, ATT is directly associated with age in both gray matter (E) and white matter (F).
