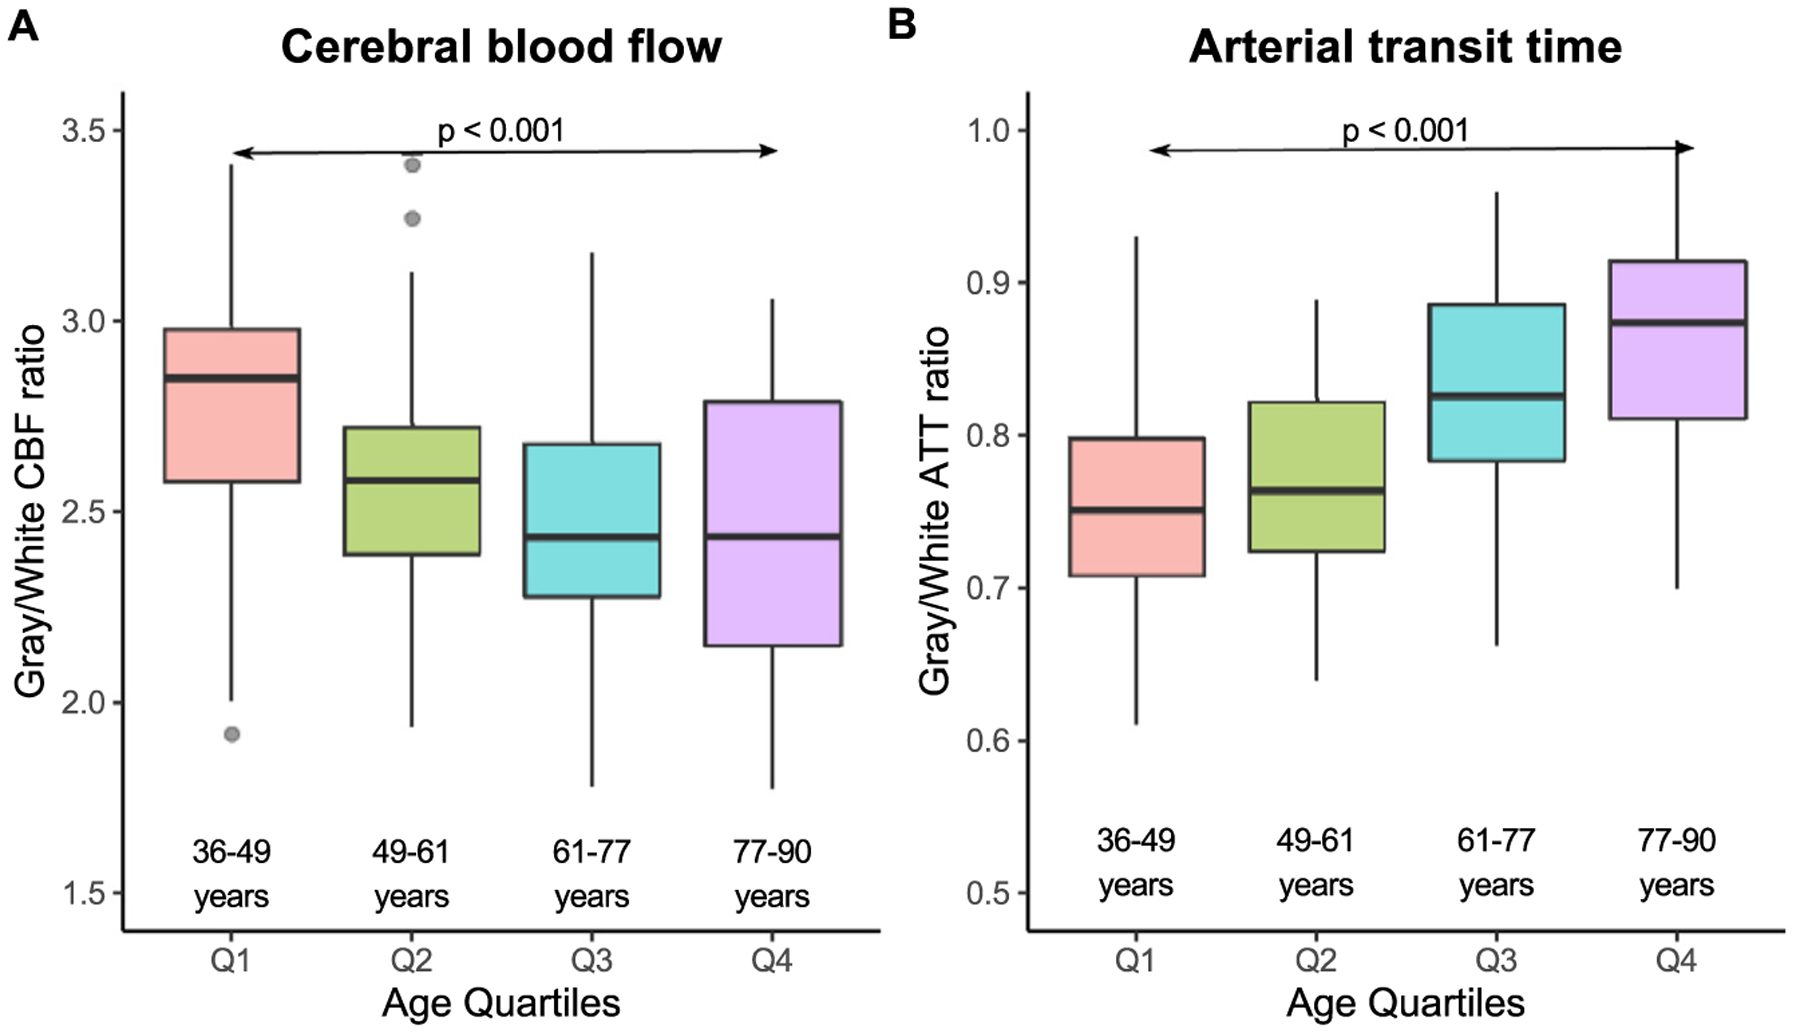
Fig. 5. Gray versus white matter.

Plots of gray-to-white matter CBF (A) and gray-to-white ATT (B) are shown here for each age quartile. The ratio of gray-to-white matter CBF generally decreases with age (p < 0.001) until the 4th quartile in which there is more variability. The ratio of gray-to-white matter ATT generally increases with age (p < 0.001).
