

Abstract
Background and Purpose:
Cortical development is essential for children’s neurocognition. In this study we evaluated how variations in cortical morphometry in normal children are associated with outcome differences in multiple domains of cognition.
Methods:
8-year-old children were recruited for a brain MRI followed by a battery of neuropsychological assessments. The MRI scan included 3D-T1-weighted imaging for cortical morphometry in 34 regions defined by the Desikan atlas. The neuropsychological assessments included the Reynolds Intellectual Assessment Scales (RIAS) for IQ, Clinical Evaluation of Language Fundamentals (CELF-4) for language, Children’s Memory Scale (CMS) for memory, Wide Range Achievement Test (WRAT-4) for academic skills, and Behavior Rating Inventory of Executive Function (BRIEF) for executive functions. The relationships between MRI measured cortical features including gray matter volume, surface area, and cortical thickness for different brain regions and neuropsychological test scores were evaluated using partial correlation analyses controlled for age and sex.
Results:
RIAS/CELF-4/CMS/WRAT-4/BRIEF scores showed significant correlations (R: [0.38-0.44], P: [0.005-0.046]) with gray matter volume, surface area, or cortical thickness in multiple brain regions. Gray matter volume in the medial orbitofrontal/ventromedial prefrontal cortex appeared to be a sensitive marker for overall neurocognition as it significantly correlated with IQ, language, memory, and executive function behaviors. The superior temporal gyrus and banks of superior temporal sulcus appeared to be most sensitive to reflect overall language function as their cortical features consistently correlated with language-related test scores.
Conclusions:
Cortical morphometry significantly correlated with neuropsychological function in healthy children; certain regions/features may serve as sensitive imaging markers.
Keywords: gray matter volume, cortical surface area, cortical thickness, cognition, behavior, neuropsychological function
INTRODUCTION
Healthy brain cortical development is very important for children’s normal cognitive functioning. The cortical gyrification starts early in utero, and there is an overproduction of synapses formed during early brain development which is followed by synaptic pruning throughout early childhood. While brain cortex is already very similar to that in adults by age 2 years,1 maturation of cortex continues, which is evident by changes in gray matter volume, cortical surface area, and/or cortical thickness and curvature with age.2 Many studies have reported associations between measurements of these brain cortical features and cognitive performance and neurodevelopmental outcomes. For example, strong correlations between whole brain gray matter volume and IQ were found in children at age 5-18 years;3 improvement in reading proficiency was associated with gray matter volume in the left superior temporal gyrus in beginning readers;4 cortical thinning in gray matter was associated with improvement in working memory and cognitive control in 5-10 years old children.5 While it is reasonable to hypothesize that changes in cortical structures are one of the driving forces of differences in neuropsychological function in children, the complexity of multiple domains of cognition each involving a set of brain cortical regions makes it challenging to fully understand the brain cortical structure-function relationships. A study combining a comprehensive suite of neuropsychological tests to characterize how different aspects of cognitive performance and neurobehavior are implicated by brain cortical features would provide some insight into this.
In addition, clinical brain segmentation and volumetric/morphometry post-processing tools on MRI scanners have been increasingly available. Identification of sensitive imaging markers based on brain cortical features which may be predictive of clinical outcomes has immediate practical value. For example, hippocampal volume has become a recognized marker in mild cognitive impairment to predict conversion to Alzheimer’s disease.6 For the developing brain, sensitive and succinct imaging markers reflecting or predicting overall neurocognitive outcomes in children would also be very valuable, not only for early identification of children at risk for adverse outcomes, but also for effective evaluation of strategies (such as nutrition and exercise) targeted at promoting brain development in all children. A comprehensive evaluation of correlations between brain volumetric/morphometry features measured by MRI and cognition/behavior in children measured by a battery of neuropsychological tests covering different domains may help identify brain regions showing the most consistent relationships and cortical features that may be representative imaging markers.
At age ~8 years, total brain gray matter volume is approaching the peak in the developmental curve, and higher order cognitive functions as well as academic skills can readily be assessed. In this study, we recruited healthy 8-year-old children for an MRI scan of the brain followed by a series of neuropsychological assessments. We aimed to identify common brain regions with cortical features (gray matter volume, cortical surface area, and cortical thickness) that are significantly correlated with neuropsychological test scores (including IQ, language, memory, academic skills, and executive functions).
METHODS
Subjects:
Healthy 8-year-old children were recruited for this study. All experimental procedures were approved by the Institutional Review Board of the University of Arkansas for Medical Sciences, and all participants provided assents as well as parental consents. Inclusion criteria for the participants included: healthy, age 90-101 months; right-handed; parental report of full-term gestation at birth (38-42 weeks); parental report of birth weight between 5-95th percentile-for-age (5.5 – 9.25 pounds); and body mass index between 5-95th percentile-for-age. Exclusion criteria for the participants included: maternal use of alcohol, tobacco, drug, or psychotropic medications during pregnancy; illnesses and chronic diseases which may affect children’s growth or development; psychological/psychiatric diagnoses; neurological impairment or injury; history or current use of anticonvulsant, stimulant, or mood stabilizing medications; and history or current use of remedial special education services. In total, 68 children had both valid structural MRI data and completed the battery of neuropsychological assessments, and were therefore included in this study. The demographic information and test scores of these 68 children are listed in Table 1.
Table 1: Demographic information of the cohort and their neuropsychological test scores.
RIAS: Reynolds Intellectual Assessment Scales; CELF-4: Clinical Evaluation of Language Fundamentals, Fourth Edition; CMS: Children’s Memory Scale; WRAT-4: Wide Range Achievement Test, Fourth Edition; BRIEF: Behavior Rating Inventory of Executive Function
| Mean ± Standard Deviation |
Range [min, max] | |
|---|---|---|
| Sex | 30 boys and 38 girls | |
| Age at MRI (years) | 7.91 ± 0.26 | [7.52, 8.51] |
| IQ: (RIAS) | ||
| Guess What | 53.3 ± 9.8 | [27, 74] |
| Verbal Reasoning | 54.9 ± 10.1 | [35, 79] |
| Odd Item Out | 58.0 ± 9.8 | [33, 77] |
| What’s Missing | 56.3 ± 11.3 | [33, 76] |
| Verbal IQ | 108.4 ± 14.7 | [78, 147] |
| Non-verbal IQ | 114.1 ± 14.3 | [81, 145] |
| Composite IQ | 111.5 ± 12.7 | [82, 147] |
| Language: (CELF-4) | ||
| Concepts & Following Directions | 10.7 ± 2.5 | [4, 16] |
| Word Structure | 9.6 ± 2.7 | [3, 15] |
| Recalling Sentences | 10.6 ± 2.8 | [4, 18] |
| Formulated Sentences | 10.9 ± 2.8 | [4, 16] |
| Word Classes - Receptive | 11.3 ± 1.7 | [7, 17] |
| Sentence Structure | 11.4 ± 2.2 | [4, 13] |
| Receptive Language | 107.2 ± 9.9 | [75, 129] |
| Expressive Language | 102.1 ± 13.6 | [71, 132] |
| Core Language | 102.3 ± 13.2 | [72, 127] |
| Memory: (CMS) | ||
| Visual Immediate | 106.2 ± 12.5 | [82, 137] |
| Visual Delayed | 105.1 ± 9.8 | [78, 125] |
| Verbal Immediate | 109.7 ± 13.5 | [75, 140] |
| Verbal Delayed | 112.9 ± 14.0 | [72, 140] |
| Attention & Concentration | 107.0 ± 16.0 | [75, 146] |
| Learning | 103.3 ± 12.4 | [66, 137] |
| Delayed Recognition | 108.9 ± 10.0 | [85, 122] |
| General Memory | 113.1 ± 12.5 | [77, 135] |
| Academic Skills: (WRAT-4) | ||
| Word Reading | 109.0 ± 11.6 | [86, 138] |
| Sentence Comprehension | 112.6 ± 15.1 | [89, 145] |
| Reading Composite | 111.1 ± 13.2 | [87, 142] |
| Executive Function: (BRIEF) | ||
| Inhibit | 47.3 ± 8.1 | [36, 80] |
| Shift | 45.2 ± 7.9 | [36, 68] |
| Emotional Control | 44.8 ± 8.0 | [35, 71] |
| Initiate | 46.3 ± 8.2 | [35, 71] |
| Working Memory | 48.4 ± 9.1 | [35, 73] |
| Plan/Organize | 44.8 ± 8.1 | [33, 65] |
| Organization of Materials | 46.8 ± 10.1 | [33, 70] |
| Monitor | 44.9 ± 9.2 | [31, 67] |
| Behavioral Regulation | 45.1 ± 7.5 | [33, 65] |
| Metacognition | 45.5 ± 8.9 | [31, 69] |
| Global Executive Composite | 45.2 ± 8.1 | [32, 69] |
MRI data acquisition:
All children had the brain MRI done at the Radiology Department of the Arkansas Children’s Hospital on a 1.5T Achieva scanner (Philips Healthcare, Best, the Netherlands) with 60-cm bore size, 33-mT/m gradient amplitude, and 100-mT/m/ms maximum slew rate. The built-in body coil was used as a transmitter, and a standard 8-channel sensitivity encoding head coil was used as a receiver. Structural imaging data of the brain was acquired using a T1-weighted 3D turbo field echo pulse sequence with the following parameters: 7.3 ms TR; 3.4 ms TE; 8° flip angle; 1x1x1 mm acquisition voxel size; 256x232x150 matrix size; 2 averages; and 7 minutes of scan time. All Images were reviewed on the scanner at the time of scanning to screen for motion artifact, and scans with substantial motion artifacts were repeated. Those who were unable to hold still or did not wish to repeat were excluded from the study.
MRI data analysis:
All MRI data were exported to a Macintosh workstation with the FreeSurfer software version 6 installed for cortical analysis. Standard preprocessing steps including motion correction, non-brain tissue removal, and transformation to the Talairach space were applied. Imaging segmentation to gray matter, white matter, and CSF was then performed, followed by intensity normalization, tessellation of cortical gray/white matter boundaries, automated topology correction, and surface deformation. White/gray matter (white) and gray matter/cerebrospinal fluid (pial) surface models were created, inflated, and registered to a spherical atlas, which was used for cortical parcellation according to gyral and sulcal curvature. Specifically, the Desikan atlas7 was used to parcellate brain cortex to 34 different regions. Cortical thickness was defined as the closest distance from the white surface to the pial surface at each surface’s vertex; cortical surface area was defined as the area of all vertex along the outer surface. All intermediate or processed images were visually inspected to ensure quality of the brain segmentation and cortical surface reconstruction/parcellation. Particularly, boundaries of white and pial surfaces and neuroanatomical labels were reviewed. No obvious errors or mismatches were observed for any subject. For each cortical region defined by the Desikan atlas, the total gray matter volume, total surface area, and the mean cortical thickness were calculated, and their correlations with neuropsychological assessment results were tested.
Neuropsychological assessments:
All children also underwent a battery of tests to evaluate their neuropsychological function. These included standardized tests to measure intelligence quotient, general language ability, memory and learning, basic academic skills, and a parent questionnaire to assess executive function behaviors. A licensed psychological examiner administered all measures. Specifically, tests given included the following:
Reynolds Intellectual Assessment Scales (RIAS).8
An individually administered test of IQ, the RIAS yields a two-subtest Verbal Intelligence Index (Verbal IQ), a two-subtest Nonverbal Intelligence Index (Nonverbal IQ), and a Composite Intelligence Index (Composite IQ). The Verbal IQ includes a Guess What subtest and a Verbal Reasoning subtest, and it reveals information about an individual’s verbal problem solving and verbal reasoning. The Nonverbal IQ includes an Odd Item Out subtest and a What’s Missing subtest, and it reflects an individual’s reasoning and spatial ability using predominantly nonverbal stimuli. The Composite IQ is an overall measure of an individual’s ability to reason, solve problems, and learn. This instrument is brief to administer and is appropriate for individuals aged 3 through 94 years. Standard scores are obtained with the RIAS using a median score of 100 and a standard deviation of 15, similar to most other measures of cognitive ability. Scores between 85 and 115 are considered to be within the average range.
Clinical Evaluation of Language Fundamentals, Fourth Edition (CELF-4).9
The CELF-4 is an individually administered assessment tool designed to assess the presence of a language disorder or delay. It is appropriate for use with children and young adults aged 5 to 21 years. Core and Index Scores of the CELF-4 examined in this study include Core Language (a measure of general language ability), Receptive Language (a measure of listening and auditory comprehension), and Expressive Language (an overall appraisal of expressive language skills). These scores are derived from subtests including Concepts & Following Directions, Word Structure, Recalling Sentences, Formulated Sentences, Word Classes – Receptive, and Sentence Structure. Similar to the RIAS, the CELF-4 uses a standard median score of 100 and a standard deviation of 15, meaning scores of 85 – 115 are in the average range.
Children’s Memory Scale (CMS).10
The CMS is a comprehensive assessment of learning and memory functioning individually administered to children and adolescents ages 5 to 16 years. Core subtests measure learning and various dimensions of memory including attention and working memory, verbal and visual memory, short- and long-delay memory, recall and recognition, and learning characteristics. From these, examiners derive eight index scores: Visual Immediate, Visual Delayed, Verbal Immediate, Verbal Delayed, Attention/Concentration, Learning, Delayed Recognition, and General Memory, which yield information on clinically meaningful domains of learning, memory, and attention. CMS index scores have a standard mean of 100 and a standard deviation of 15, with a score range of 50 to 150.
Wide Range Achievement Test, Fourth Edition (WRAT-4).11
The WRAT-4 is a norm-referenced assessment of fundamental academic skills designed for use with individuals ages 5 to 94 years. The Word Reading and Sentence Comprehension subtests were given, and these two subtests yield a Reading Composite score for each subject. Word Reading assesses decoding through letter identification and word recognition, and Sentence Comprehension measures the ability to identify meaning of words and understand ideas and information in sentences using a modified cloze technique. The overall Reading Composite score gives information about an individual’s reading achievement. These subtests were individually administered, and raw scores were converted to age-based standard scores having a mean of 100 and a standard deviation of 15. WRAT4 scores range from 55 to 145.
Behavior Rating Inventory of Executive Function (BRIEF).12
The parent version of the BRIEF questionnaire was utilized to assess executive function behaviors. This instrument is designed to evaluate the abilities of a broad range of children ages 5 to 18 years. The questionnaire contains 86 items to which parents endorse the frequency with which their children have had problems with the behaviors described over the past six months. The questionnaire items comprise eight clinical scales that measure various aspects of executive functioning, including Inhibit, Shift, Emotional Control, Initiate, Working Memory, Plan/Organize, Organization of Materials, and Monitor. The clinical scales form two Indexes, Behavioral Regulation and Metacognition, and yield an overall score, the Global Executive Composite. The Behavioral Regulation Index reflects the ability to shift cognitive set and modulate emotions and behaviors, and the Metacognition Index gives information about the ability to initiate, plan, organize, self-monitor, and sustain working memory. The Global Executive Composite is a summary score that includes all of the BRIEF clinical scales. In addition, two validity scales are included, Negativity and Inconsistency. T scores are used to interpret executive functioning as reported by parents on the BRIEF. These scores are linear transformations of raw scores and have a mean of 50 and a standard deviation of 10.
Statistics:
Spearman’s correlation test was used to evaluate relationships between brain MRI parameters (cortical gray matter volume, surface area, and cortical thickness) and neuropsychological test scores (RIAS, CELF-4, CMS, WRAT-4, and BRIEF) for each region. Age and sex of the children were included as covariates in the correlation analysis, since children’s brain continue to develop at age 8 years, and it is known that there are sex-related differences in brain volume in children. Correlation coefficients (R values) and significance level (P values) between variables of interest were calculated from the partial correlation tests, in which the effects of sex and age were regressed out. Bonferroni correction method was used for multiple comparison corrections. Specifically, since there were 34 total brain regions considered in each of the left and right brain hemispheres, all raw P values were multiplied by 68, and the results were regarded as corrected P values and presented. Correlations with corrected P values ≤0.05 were regarded as significant. Since Bonferroni correction is a very strict method for multiple comparison correction, it was assumed that the most robust relationships between brain morphometry and neuropsychological function can be identified this way. In addition, we also used false discovery rate (FDR) correction as a more general multiple comparison correction approach, and presented all relationships identified with FDR corrected P≤0.05 in heat maps. All statistics analyses were done in MATLAB (The MathWorks, Inc., Natick, MA) software or in R.
RESULTS
The neuropsychological test scores of these children are listed in Table 1. Overall, results indicated that mean scores on all administered assessments were within published normal limits. In fact, performance for the majority of this cohort tended to fall within the average to above average ranges or higher on measures. An analysis of RIAS scores revealed that 97% of subjects scored within the average range or higher with regard to Verbal IQ and Nonverbal IQ, and 99% had a Composite IQ in the average range or greater. With regard to performance on the CELF-4, 90% of subjects obtained Core Language and Expressive Language Index scores in the average range or beyond, while 97% of subjects’ Receptive Language Index was average or above. Memory functioning for 97% of subjects were in the average range or above according to the results of the CMS. 100% of WRAT-4 scores on the Word Reading and Sentence Comprehension subtests and for the Reading Composite were within the average range or higher. Finally, an analysis of BRIEF results revealed that 97% of subjects scored within normal limits on the Behavioral Regulation Index, 94% were functioning typically on the Metacognition Index, and the Global Executive Composite scores suggested 96% of subjects were in the average range with regard to their general executive function behaviors.
Correlations between brain cortical features and intelligence quotient:
Significant positive correlations (P≤0.05, corrected for multiple comparisons using Bonferroni correction) were observed between cortical gray matter volume in 4 regions and RIAS test scores, including: left lateral orbitofrontal gyrus and Composite IQ (R=0.41, P=0.03), right medial orbitofrontal gyrus and Guess What subtest score (R=0.42, P=0.02), right banks of superior temporal sulcus and Composite IQ (R=0.41, P=0.04), and right transverse temporal gyrus and Composite IQ (R=0.42, P=0.02). In addition, significant positive correlations were also observed between cortical gray matter surface area in 2 regions and RIAS test scores, including: left superior temporal gyrus and Guess What subtest score (R=0.41, P=0.04), and right rostral anterior cingulate gyrus and Composite IQ (R=0.42, P=0.03). Scatter plots of these correlations are provided in Figure 1.
Figure 1:
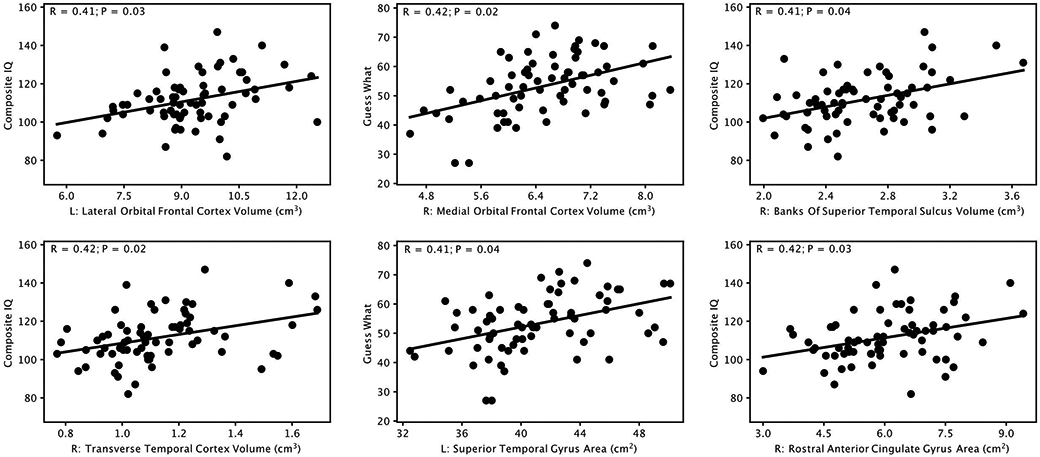
Significant positive correlations (P≤0.05, Bonferroni corrected) between cortical gray matter volume and surface area measures in different brain regions and IQ test (Reynolds Intellectual Assessment Scales) scores and subscales. L: left; R: right
Correlations between brain cortical features and language function:
Significant positive correlations (P≤0.05, corrected for multiple comparisons using Bonferroni correction) were observed between cortical gray matter volume in 6 regions and CELF-4 test scores, including: left medial orbitofrontal cortex and Recalling Sentences (R=0.40, P=0.04), right banks of superior temporal sulcus and Concepts & Following Directions (R=0.42, P=0.02), right superior temporal gyrus and Concepts & Following Directions (R=0.40, P=0.05), right medial orbitofrontal cortex and Recalling Sentences (R=0.42, P=0.02), right posterior cingulate gyrus and Recalling Sentences (R=0.40, P=0.05), and right superior temporal gyrus and Recalling Sentences (R=0.44, P=0.01). In addition, significant positive correlations were also observed between cortical gray matter surface area in 2 regions and CELF-4 test scores, including: right superior temporal gyrus and Concepts & Following Directions (R=0.41, P=0.04), and right superior temporal gyrus and Recalling Sentence (R=0.40, P=0.05). Scatter plots of these correlations are provided in Figure 2.
Figure 2:
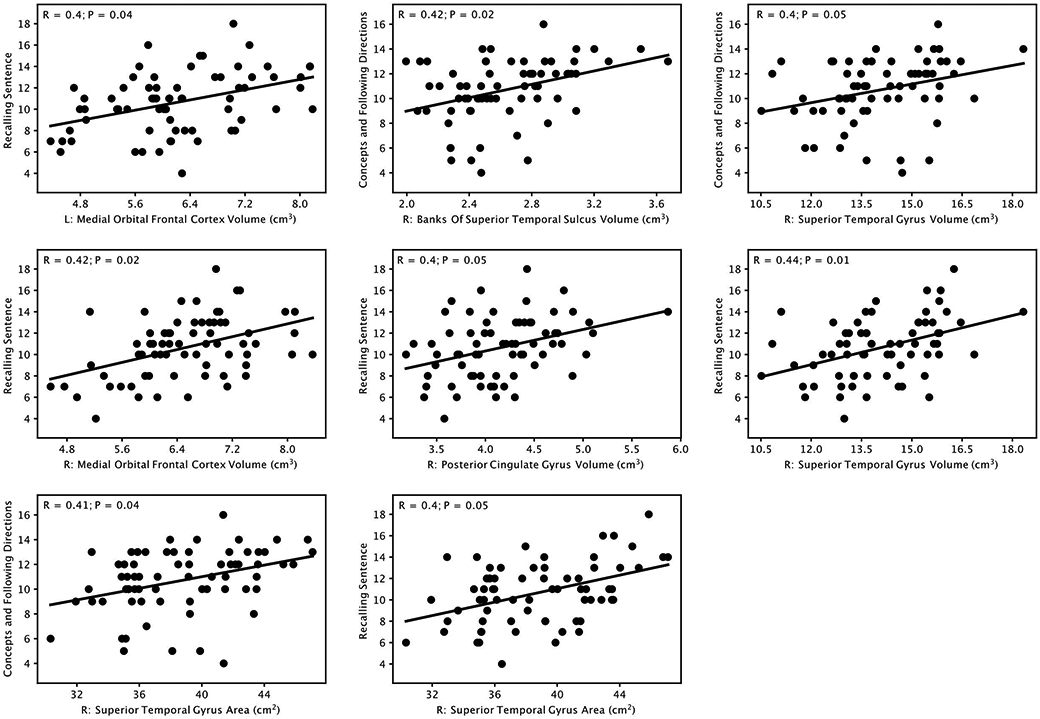
Significant positive correlations (P≤0.05, Bonferroni corrected) between cortical gray matter volume and surface area measures in different brain regions and language test (Clinical Evaluation of Language Fundamentals, Fourth Edition) scores and subscales. L: left; R: right
Correlations between brain cortical features and memory function:
Significant positive correlations (P≤0.05, corrected for multiple comparisons using Bonferroni correction) were observed between cortical gray matter volume in one region and one CMS index: left medial orbitofrontal cortex and Attention/Concentration (R=0.40, P=0.05), as shown in Figure 3.
Figure 3:
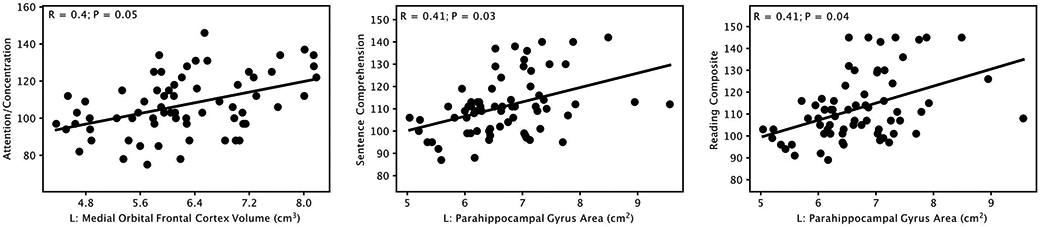
Significant positive correlations (P≤0.05, Bonferroni corrected) between gray matter volume in the left medial orbitofrontal cortex and Attention/Concentration subscales in the memory test (Children’s Memory Scale). And significant positive correlations (P≤0.05, Bonferroni corrected) between cortical surface area measures in different brain regions and academic skills test (Wide Range Achievement Test, Fourth Edition) scores. L: left
Correlations between brain cortical features and academic skills:
Significant positive correlations (P≤0.05, corrected for multiple comparisons using Bonferroni correction) were observed between cortical gray matter surface area in 2 regions and WRAT-4 test scores, including: left parahippocampal gyrus and Sentence Comprehension (R=0.41, P=0.03), and left parahippocampal gyrus and Reading Composite (R=0.41, P=0.04). Scatter plots of these correlations are provided in Figure 3.
Correlations between brain cortical features and executive functions:
Significant negative correlations (P≤0.05, corrected for multiple comparisons using Bonferroni correction) were observed between cortical gray matter volume in 2 regions and parental-reported BRIEF scores (problems for behaviors involving executive functions), including: left medial orbital frontal cortex and Working Memory (R=−0.40, P=0.04), and left pars opercularis gyrus and Working Memory (R=−0.40, P=0.05). In addition, significant negative correlation was also observed between cortical gray matter thickness in one region and BRIEF scores, specifically, right parahippocampal gyrus and Initiate (R=−0.41, P=0.04). Scatter plots of these correlations are provided in Figure 4.
Figure 4:
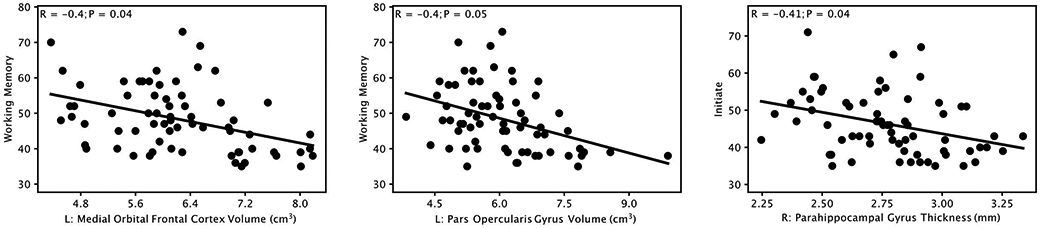
Significant negative correlations (P≤0.05, Bonferroni corrected) between cortical gray matter volume and cortical thickness measures in different brain regions and executive function behavior test (Behavior Rating Inventory of Executive Function) scores. L: left; R: right
Importance of medial orbitofrontal cortex in IQ, language, memory, and executive functions:
One brain region consistently showing significant relationships with most neuropsychological tests is the medial orbitofrontal cortex. The definition of this region in the Desikan atlas is illustrated in Figure 5a, which is often referred as the ventromedial prefrontal cortex. The gray matter volume of this region positively correlated (Bonferroni corrected P≤0.05) with IQ (Figure 5b), language (Figure 5c, 5d), memory (Figure 5e), and negatively correlated with executive function behavior problems (Figure 5f).
Figure 5:

Definition of medial orbitofrontal cortex in the Desikan atlas (a), and significant correlations (P≤0.05, Bonferroni corrected) between gray matter volume in the medial orbitofrontal cortex and IQ (b), language (c, d), memory (e), and executive function (f) assessment scores. RIAS: Reynolds Intellectual Assessment Scales; CELF-4: Clinical Evaluation of Language Fundamentals, Fourth Edition; CMS: Children’s Memory Scale; BRIEF: Behavior Rating Inventory of Executive Function; L: left; R: right
Consistent relationships between superior temporal gyrus/sulcus area and language function:
brain regions consistently showing significant relationships between imaging features and language functions in this cohort of children are the superior temporal gyrus and the banks of superior temporal sulcus (posterior aspects of the superior temporal sulcus), (Figures 1,2) consistent with the well-known Wernicke’s area for receptive language.
Findings when using less strict false discovery rate method for multiple comparison correction:
If FDR corrected P≤0.05 were used for the multiple comparison correction, more relationships were identified between neuropsychological test results and morphometry parameters. These findings are illustrated in Figure 6, which includes heat maps for relationships between all test scores (and subscales) and cortical grey matter volume, surface area, and thickness in the 68 brain regions. Cortical gray matter volume was the most sensitive in terms of relationships with neuropsychological function, with 63 total relationships (FDR corrected P≤0.05) identified, while cortical surface area and thickness were less sensitive, with 6 and 1 relationships (FDR corrected P≤0.05) identified, same as the findings using Bonferroni correction.
Figure 6:

Heat maps demonstrating correlations between neuropsychological function test scores and cortical morphometry parameters including gray matter volume, cortical surface area, and cortical thickness. FDR correction was used in generating these heat maps
Inter-correlations between neuropsychological test scores:
Correlations between scores for different neuropsychological tests (and between different subscales for the same neuropsychological test) were also evaluated and presented in Figure 7. In general, there were significant correlations among subscales for each of the five neuropsychological test scores (RIAS, CELF-4, CMS, WRAT-4, and BREIF). In addition, there were noticeable correlations between IQ measures (RIAS scores) and language (CELF-4), academic skills (WRAT-4), or memory (CMS) test scores; and between memory (CMS) test scores and language (CELF-4) or academic skills (WRAT-4).
Figure 7:

Heat maps demonstrating inter-correlations among different neuropsychological test scores and subscales. RIAS: Reynolds Intellectual Assessment Scales; BRIEF: Behavior Rating Inventory of Executive Function; CMS: Children’s Memory Scale; WRAT-4: Wide Range Achievement Test, Fourth Edition; CELF-4: Clinical Evaluation of Language Fundamentals, Fourth Edition
DISCUSSION
Significant relationships were consistently observed between brain cortical imaging features and neuropsychological test scores. Briefly, regional gray matter volume appears to be the most sensitive cortical features (compared to cortical surface area and cortical thickness) as measurements of gray matter volume significantly correlated with all domains of neuropsychological assessments in different regions. The correlations with RIAS, CELF-4, CMS, and WRAT-4 scores were all positive, indicating that larger gray matter volume is associated with higher IQ and academic skills as well as better language and memory functioning. The correlations with BRIEF scores were negative, indicating that larger gray matter volume is associated with fewer problems in behavior related with executive functions. Cortical surface area also appears to be sensitive, as measurements of surface area significantly correlated with RIAS, CELF-4, and WRAT-4 test scores. The correlations were all positive, indicating that larger cortical surface area is associated with higher IQ and academic skills and better language functioning. One the other hand, cortical thickness is the least sensitive measure and only showed significant correlation with one BRIEF test sub-score in one brain region. Assuming better neuropsychological test scores indicate better gray matter development, these findings are probably related to the maturation trajectory of brain cortex in children: while gray matter volume continues to increase until around age 10 years before starting to decrease with age, cortical thinning has already started around age 2 years.2, 13 Therefore, at age ~8 years, better gray matter development is most likely reflected by increase in gray matter volume and/or cortical surface area; on the other hand, the cortical thickness before thinning and the speed of cortical thinning both (and in opposite directions) affect the cortical thickness measured at this age, which therefore may not be as a straightforward indication of better gray matter development as measures of volume and surface area.
While numerous studies have evaluated both neuropsychological testing and brain MRI findings on different populations, most of those studies are focusing on a particular patient group, and it is surprising not many studies focused on the correlations in typical developing children. Nevertheless, they are literature evidence supporting significant relationships between cortical morphometry and cognitive function in healthy normal children, such as increased total gray matter volume and higher IQ3, improved reading skills and greater gray matter volume in superior temporal gyrus,4 better working memory and cognitive control and appropriate cortical thinning in cortical regions such as superior parietal cortex, anterior cingulate gyrus, and inferior frontal gyrus.5 In addition, we have included a table showing examples of other studies reporting associations between brain MRI findings and neuropsychological test scores using measures similar to ours, supporting the sensitivity of brain-behavior relationships evaluated in our study (Table 2).
Table 2:
Examples of literatures reporting associations between brain MRI findings and neuropsychological test scores using measures similar to those in our study
| Neuropsychological Test |
Publications | Main findings |
|---|---|---|
| CELE-4 | Raschle et al. " Investigating the Influences of Language Delay and/or Familial Risk for Dyslexia on Brain Structure in 5-Year-Olds." Cerebral Cortex 27 (2017): 764-776. | Associations between early language delay and reduced gray matter volume in left-hemispheric middle temporal, occipital, and frontal regions |
| RIAS; CELE-4 | Ou et al. "Sex-specific association between infant diet and white matter integrity in 8-y-old children." Pediatric research 76, no. 6 (2014): 535. | IQ and language test scores correlated with white matter development in boys |
| CMS | Peng, et al. "The relationship between hippocampal volumes and nonverbal memory in patients with medial temporal lobe epilepsy." Epilepsy research 108, no. 10 (2014): 1839-1844. | Patients with or without hippocampal volume abnormality showed differences in CMS subscales such as the nonsense graphical recognition and facial memory. |
| CMS | Brent et al. "Alterations of lateral temporal cortical gray matter and facial memory as vulnerability indicators for schizophrenia: an MRI study in youth at familial high-risk for schizophrenia." Schizophrenia research 170, no. 1 (2016): 123-129. | Right middle temporal gyral volume showed a significant positive association with delayed facial memory |
| WRAT-4 | Cheong et al. "Contribution of brain size to IQ and educational underperformance in extremely preterm adolescents." PloS one 8, no. 10 (2013). | Total and regional brain volume correlated with educational skills, a relationship that was similar for both the ex-preterms and controls |
| BRIEF | Garlinghouse et al. "Subjective rating of working memory is associated with frontal lobe volume in schizophrenia." Schizophrenia Research 120, no. 1-3 (2010): 71-75. | Poorer working memory evaluated by BRIEF was associated with smaller left and right frontal lobe volumes |
| BRIEF | Lynch et al. "Executive dysfunction in autism spectrum disorder is associated with a failure to modulate frontoparietal-insular hub architecture." Biological Psychiatry: Cognitive Neuroscience and Neuroimaging 2, no. 6 (2017): 537-545. | Change in frontoparietal-insular participation coefficient predicted BRIEF scores indexing the ability to attend to task-oriented output, plan and organize, and sustain working memory |
The medial orbitofrontal cortex appears to play an important role in most of the domains of neuropsychological function measured in this study. Particularly, higher gray matter volume in this region is associated with higher IQ, better language and memory functioning, and fewer problems in executive function behaviors. The medial orbitofrontal cortex region defined in the Desikan Atlas, as illustrated in Figure 5a, is relatively broad and has a medial boundary of cingulate cortex.7 This defined region largely overlaps with the ventromedial prefrontal cortex, although some would define the ventromedial prefrontal cortex as the region shown in Figure 5a and would define the medial orbitofrontal cortex as a sub-region of it, and others would separate the region shown in Figure 5a into ventromedial prefrontal cortex (top portion) and medial orbitofrontal cortex (bottom portion). For our discussion, we will use the term mOFC/vmPFC to represent this region in Figure 5a. It is interesting that cortical gray matter volume in this region is implicated in performance on most of the neuropsychological measures in this study. Structurally, mOFC/vmPFC is connected to and presumably sends/receives signals to and from a number of neighboring regions including the amygdala, the lateral hypothalamus, the cingulate cortex, the temporal lobe, and other regions of the prefrontal cortex. Functionally, mOFC/vmPFC is presumably involved in sensitivity to reward and determine its value14 and hypothesized as playing an important role in executive functions and decision-making.15 The vmPFC volume in adolescents has been shown to predict hyperactive and inattentive symptoms 5 years later;16 smaller vmPFC volume also significantly correlated with lower impulse control in normal school age boys.17 While conventional functional MRI studies designed to stimulate language have not typically activated the mOFC/vmPFC region,18 semantic processing does appear to involve the vmPFC.19 Likewise, while working memory is related to activations in limbic system and lateral prefrontal instead of mOFC,20 it has been found that vmPFC features are correlated with extinction memory.21 In addition, deactivation of the vmPFC has been noticed in various tasks22 and it appears to be one of the main hubs in the default mode network of the brain.23 In summary, although better understanding of how the mOFC/vmPFC would impact performance on the various psychological tests of our study is still needed, it is possible that the mOFC/vmPFC volume can actually serve as a sensitive marker predictive of overall neurocognition in children.
The superior temporal gyrus and the banks of superior temporal sulcus appeared to be regions most sensitive to language-related test performance. Many of their cortical volume or surface area measures significantly correlated with total or sub-test scores for the Verbal IQ on the RIAS and Receptive Language on the CELF-4. The associations in the left brain hemisphere are expected as most children are left-dominated for language and the Wernicke’s area for receptive language partially overlaps with the superior temporal gyrus and the banks of superior temporal sulcus. The associations in the right brain hemisphere are interesting. Previous studies have reported decreased left and right superior temporal gyrus volume in children with loss of language comprehension and verbal expression,24 as well as involvement of banks of right superior temporal sulcus in semantic integration of speech and pantomimes25 and right superior temporal gyrus in language switching in those who are bilingual,26 The important role of these right hemisphere regions in language outcomes will need further investigation. On the other hand, it is noteworthy that the significant relationships between neuropsychological test scores and cortical morphometry parameters were lateralized in many brain regions. This is not surprising, as asymmetry of brain morphometry has been identified in both typically developing children and healthy adults.27-28 Particularly, the cortical development in the orbitofrontal and inferior frontal cortex was lateralized in right-handed children,27 and cortical asymmetries in inferior frontal gyrus, transverse temporal gyrus, and parahippocampal gyrus were also consistently identified in healthy adults. These regions overlap with regions identified in our study with lateralized structural-functional relationships, although it is unclear whether structural asymmetry or functional lateralization contributed most to these relationships.
There are several limitations for this study. The psychological test scores for the cohort have a higher mean value than the mean for the population suggested from the test manuals, indicating that the cohort involved in this study may not fully present the whole pediatric population; the sample size is also relatively small compared to recent or ongoing large multicenter neuroimaging studies, and more regions with significant correlations or more sensitive imaging markers may be identified by a larger study; this cross-sectional study only covers one age point, and longitudinal studies will be necessary to understand the brain structure-behavior relationships along the whole developmental trajectory.
In conclusion, brain cortical features significantly correlated with neuropsychological function test scores in normal 8-year-old children in this study. The medial orbitofrontal cortex (ventromedial prefrontal cortex) gray matter volume may be a sensitive marker to reflect or predict overall neurocognitive outcomes, and brain features of the bilateral superior temporal gyrus and the banks of superior temporal sulcus appeared to consistently reflect language performance.
Acknowledgements and Disclosure:
This project was supported by USDA-ARS Project 6026-51000-010-05S at the Arkansas Children’s Nutrition Center. The PI is also supported by NIH 1R01HD099099. We also would like to thank the staff of the Arkansas Children’s Nutrition Center Clinical Research Core for their assistance with this study. None of the authors have any potential financial conflicts-of-interests related with this study.
REFERENCES
- 1.Knickmeyer RC, Gouttard S, Kang C, et al. A structural MRI study of human brain development from birth to 2 years. J Neurosci 2008;28:12176–82. [DOI] [PMC free article] [PubMed] [Google Scholar]
- 2.Remer J, Croteau-Chonka E, Dean DC, et al. Quantifying cortical development in typically developing toddlers and young children, 1-6 years of age. Neuroimage 2017;153:246–61. [DOI] [PMC free article] [PubMed] [Google Scholar]
- 3.Wilke M, Sohn JH, Byars AW, Holland SK. Bright spots: correlations of gray matter volume with IQ in a normal pediatric population. Neuroimage 2003;20:202–15. [DOI] [PubMed] [Google Scholar]
- 4.Linkersdorfer J, Jurcoane A, Lindberg S, et al. The association between gray matter volume and reading proficiency: a longitudinal study of beginning readers. J Cogn Neurosci 2015;27:308–18. [DOI] [PubMed] [Google Scholar]
- 5.Kharitonova M, Martin RE, Gabrieli JD, Sheridan MA. Cortical gray-matter thinning is associated with age-related improvements on executive function tasks. Dev Cogn Neurosci 2013;6:61–71. [DOI] [PMC free article] [PubMed] [Google Scholar]
- 6.Jack CR Jr., Petersen RC, Xu YC, et al. Prediction of AD with MRI-based hippocampal volume in mild cognitive impairment. Neurology 1999;52:1397–403. [DOI] [PMC free article] [PubMed] [Google Scholar]
- 7.Desikan RS, Segonne F, Fischl B, et al. An automated labeling system for subdividing the human cerebral cortex on MRI scans into gyral based regions of interest. Neuroimage 2006;31:968–80. [DOI] [PubMed] [Google Scholar]
- 8.Reynolds CR, Kamphaus RW, editors. Reynolds intellectual assessment scales. Lutz, FL: Psychological Assessment Resources; 2003. [Google Scholar]
- 9.Semel E, Wiig EH, Secord WA, editors. Clinical evaluation of language fundamentals – fourth edition. San Antonio, TX: Harcourt Assessment, Inc. 2003. [Google Scholar]
- 10.Cohen MJ, editor. Children’s memory scale. San Antonio, TX: The Psychological Corporation; 1997. [Google Scholar]
- 11.Wilkinson GS, Robertson GJ, editors. Wide range achievement test: Fourth Edition. Lutz, FL: Psychological Assessment Resources; 2006. [Google Scholar]
- 12.Gioia GA, Isquith PK, Guy SC, Kenworthy L, editors. Behavior rating inventory of executive function (BRIEF). Lutz, FL:: Psychological Assessment Resources, Inc. 2000. [Google Scholar]
- 13.Lenroot RK, Gogtay N, Greenstein DK, et al. Sexual dimorphism of brain developmental trajectories during childhood and adolescence. Neuroimage 2007;36:1065–73. [DOI] [PMC free article] [PubMed] [Google Scholar]
- 14.O'Doherty J, Winston J, Critchley H, Perrett D, Burt DM, Dolan RJ. Beauty in a smile: the role of medial orbitofrontal cortex in facial attractiveness. Neuropsychologia 2003;41:147–55. [DOI] [PubMed] [Google Scholar]
- 15.Taylor SF, Welsh RC, Wager TD, Phan KL, Fitzgerald KD, Gehring WJ. A functional neuroimaging study of motivation and executive function. Neuroimage 2004;21:1045–54. [DOI] [PubMed] [Google Scholar]
- 16.Albaugh MD, Ivanova M, Chaarani B, et al. Ventromedial prefrontal volume in adolescence predicts hyperactive/inattentive symptoms in adulthood. Cereb Cortex 2019;29:1866–74. [DOI] [PMC free article] [PubMed] [Google Scholar]
- 17.Boes AD, Bechara A, Tranel D, Anderson SW, Richman L, Nopoulos P. Right ventromedial prefrontal cortex: a neuroanatomical correlate of impulse control in boys. Soc Cogn Affect Neurosci 2009;4:1–9. [DOI] [PMC free article] [PubMed] [Google Scholar]
- 18.Binder JR, Frost JA, Hammeke TA, Cox RW, Rao SM, Prieto T. Human brain language areas identified by functional magnetic resonance imaging. J Neurosci 1997;17:353–62. [DOI] [PMC free article] [PubMed] [Google Scholar]
- 19.Binder JR, Desai RH, Graves WW, Conant LL. Where is the semantic system? A critical review and meta-analysis of 120 functional neuroimaging studies. Cereb Cortex 2009;19:2767–96. [DOI] [PMC free article] [PubMed] [Google Scholar]
- 20.D'Esposito M, Postle BR, Rypma B. Prefrontal cortical contributions to working memory: evidence from event-related fMRI studies. Exp Brain Res 2000;133:3–11. [DOI] [PubMed] [Google Scholar]
- 21.Milad MR, Quinn BT, Pitman RK, Orr SP, Fischl B, Rauch SL. Thickness of ventromedial prefrontal cortex in humans is correlated with extinction memory. Proc Natl Acad Sci U S A 2005;102:10706–11. [DOI] [PMC free article] [PubMed] [Google Scholar]
- 22.Buckner RL, Andrews-Hanna JR, Schacter DL. The brain's default network: anatomy, function, and relevance to disease. Ann N Y Acad Sci 2008;1124:1–38. [DOI] [PubMed] [Google Scholar]
- 23.Uddin LQ, Kelly AM, Biswal BB, Castellanos FX, Milham MP. Functional connectivity of default mode network components: correlation, anticorrelation, and causality. Hum Brain Mapp 2009;30:625–37. [DOI] [PMC free article] [PubMed] [Google Scholar]
- 24.Takeoka M, Riviello JJ, Jr., Duffy FH, et al. Bilateral volume reduction of the superior temporal areas in Landau-Kleffner syndrome. Neurology 2004;63:1289–92. [DOI] [PubMed] [Google Scholar]
- 25.Willems RM, Ozyurek A, Hagoort P. Differential roles for left inferior frontal and superior temporal cortex in multimodal integration of action and language. Neuroimage 2009;47:1992–2004. [DOI] [PubMed] [Google Scholar]
- 26.Luk G, Green DW, Abutalebi J, Grady C. Cognitive control for language switching in bilinguals: A quantitative meta-analysis of functional neuroimaging studies. Lang Cogn Process 2011;27:1479–88. [DOI] [PMC free article] [PubMed] [Google Scholar]
- 27.Shaw P, Lalonde F, Lepage C, et al. Development of Cortical asymmetry in typically developing children and its disruption in attention-deficit/hyperactive disorders. Arch Gen Psychiatry 2009:66:888–96 [DOI] [PMC free article] [PubMed] [Google Scholar]
- 28.Kong XZ, Mathias SR, Guadalupe T, et al. Mapping cortical brain asymmetry in 17,141 healthy individuals worldwide via the ENIGMA consortium. PNAS 2018:115:E5154–63 [DOI] [PMC free article] [PubMed] [Google Scholar]