Abstract
The in vivo rabbit test is the benchmark against which new approach methodologies for skin irritation are usually compared. No alternative method offers a complete replacement of animal use for this endpoint for all regulatory applications. Variability in the animal reference data may be a limiting factor in identifying a replacement. We established a curated data set of 2624 test records, representing 990 substances, each tested at least twice, to characterize the reproducibility of the in vivo assay. Methodological deviations from guidelines were noted, and multiple data sets with differing tolerances for deviations were created. Conditional probabilities were used to evaluate the reproducibility of the in vivo method in identification of U.S. Environmental Protection Agency or Globally Harmonized System hazard categories. Chemicals classified as moderate irritants at least once were classified as mild or non-irritants at least 40% of the time when tested repeatedly. Variability was greatest between mild and moderate irritants, which both had less than a 50% likelihood of being replicated. Increased reproducibility was observed when a binary categorization between corrosives/moderate irritants and mild/non-irritants was used. This analysis indicates that variability present in the rabbit skin irritation test should be considered when evaluating nonanimal alternative methods as potential replacements.
Keywords: Skin irritation, in vivo, in vitro, hazard classification, new approach methodologies, variability, validation, reference data
1. Introduction
Skin irritation is defined as reversible damage to the skin caused by application of a test substance, whereas skin corrosion is irreversible test substance-induced damage such as dermal necrosis (US-EPA 1998b). Skin irritation testing is required in both the U.S. and Europe for hazard identification and product labeling for pesticides and other industrial chemicals, and helps determine necessary levels of personal protective equipment for safe handling (US-EPA, 2016). The in vivo rabbit skin irritation test (Draize et al., 1944) is the primary method for skin irritation testing and is the reference method against which non-animal alternatives are compared. In this test, a test substance is applied to shaved rabbit skin for a period of at least 4 hours, after which the skin is observed and quantitatively scored for erythema and edema for intervals up to 72 hours. These scores are then used to assign a hazard classification according to the U.S. Environmental Protection Agency (EPA) or United Nations Globally Harmonized System of Classification and Labeling of Chemicals (GHS) skin irritation classification systems.
The EPA system uses primary dermal irritation indexes (PDIIs), which are calculated from the
erythema and edema scores as follows:
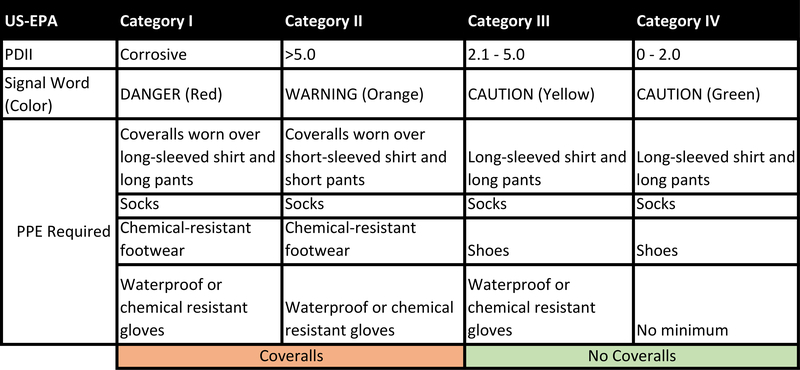
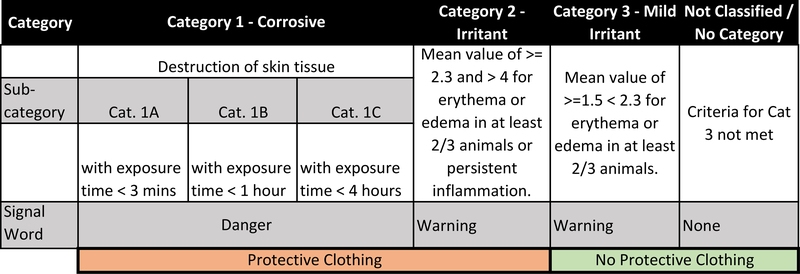
PDIIs are used to categorize substances into Category (Cat.) II, III, or IV (Fig. 1A) (US-EPA, 1998). A Cat. I chemical is corrosive to the skin. In the UN-GHS classification system (Fig. 1B), categorizations are made based directly on erythema and edema scores. Again, Category 1 chemicals are corrosive to the skin, but they are subdivided into three subcategories (A, B, C) based on exposure time necessary to induce a corrosive response. Most international regulatory authorities classify irritant substances as Cat. 2 without further subdivision into mild and moderate classifications. However, there is an optional Cat. 3 (mild irritant) that is used by the United States and other countries that require such a distinction be made. All other substances do not require classification for skin irritation hazard.
Figure 1:
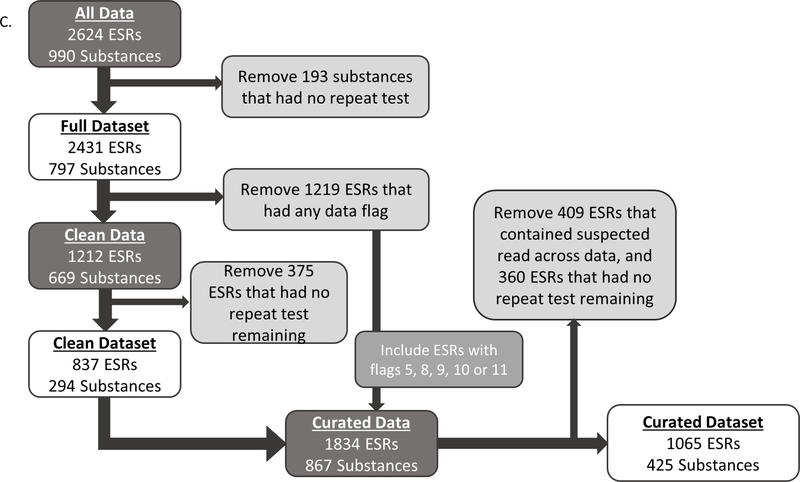
Hazard Classifications for Skin Irritation. A. EPA classification system, including PDII range per category, signal words and colors, and required PPE. B. UN-GHS hazard classification system for skin irritation. PPE used to assign binary classifications for analysis in Section 3.4 highlighted. C. Flow diagram of filtering steps for each Endpoint Study Record (ESR) dataset analyzed.
New approach methodologies (NAMs) are generally defined as non-animal methods or approaches using one or more in vitro or in silico methods to provide insight on chemical hazard (ICCVAM, 2018). The Interagency Coordinating Committee on the Validation of Alternative Methods (ICCVAM) published a strategic roadmap in 2018 that focuses on fostering the development and adoption of NAMs by regulatory agencies. This, along with initiatives from the EU (Regulation EC 1907/2006; Regulation EC 1223/2009), EPA (US-EPA, 2018a), and FDA (US-FDA, 2017), and recent advances in in vitro assays, have increased the regulatory acceptance of NAMs to replace many traditional animal tests. For example, in 2015 EPA published an accepted alternative testing approach for evaluating the eye irritation potential of certain pesticide products using a decision tree structure based only on in vitro and ex vivo assays (US-EPA, 2015). In 2018, EPA released a draft policy on the use of alternative approaches for skin sensitization as a potential replacement for laboratory animal testing (US-EPA, 2018b).
The use of laboratory animals for skin irritation hazard identification has been questioned both with regards to its relevance to predicting skin irritation in humans and its lack of reproducibility (Hoffmann et al., 2005; Weil and Scala, 1971; Worth and Cronin, 2001).Numerous efforts over the last two decades resulted in the development, validation, and international adoption of nonanimal alternatives for the in vivo rabbit test. Three separate test guidelines have been issued by the Organisation for Economic Co-operation and Development (OECD) for nonanimal approaches to detect EPA/GHS Cat. 1 skin corrosives (OECD 2015a; OECD 2015b; OECD 2019a; ). A fourth test guideline (OECD, 2019b) describes reconstructed human epithelial models that can be used as stand-alone replacements for identification of GHS Cat. 2 irritants, and, depending on regulatory requirements, GHS non-classified chemicals. These methods have not been able to reliably distinguish between substances classified based on the in vivo rabbit test as moderate and mild irritants for either the GHS (Categories 2 and 3) or EPA (Categories II and III) classification systems. Thus, they are not currently accepted as full replacements for the in vivo test in the United States. However, modifications to the guideline protocol including increased dosing volume and incubation time have shown promise in distinguishing mild skin irritation potential among medical devices (De Jong et al., 2018).
All NAMs for skin irritation have been benchmarked for performance against the in vivo rabbit test. E. Evidence has long suggested that not only is the rabbit test variable between laboratories, the range of response between individual rabbits can also vary significantly (Weil and Scala, 1971). This variability may in part be intrinsic to the animal response, as it is seen in other related toxicity endpoints such as eye irritation (Luechtefeld et al. 2016. Furthermore). Furthermore, the subjective nature of the scoring of erythema and edema responses that underlie the hazard classifications is a potentially significant source of variability. It is critical to understand any variability inherent to the rabbit test, as this will directly affect the expectations for performance of NAMs that seek to replace it.
In this study, we used conditional probabilities to assess the reproducibility of hazard classifications resulting from the rabbit skin irritation assay using data from chemicals that had at least two independently generated in vivo test results. The goal was to establish an appropriate benchmark against which to evaluate NAMs, and thereby set appropriate expectations for NAM performance.
2. Methods
2.1. Data collection
The initial in vivo rabbit skin irritation data were provided by the European Chemical Association (ECHA) (https://echa.europa.eu/) in December 2019. A list of studies of interest was generated by querying the database through eChemPortal (https://www.echemportal.org/echemportal/) for in vivo skin irritation results with the following parameters:
Key or Supporting Study
Experimental Result (as opposed to read-across or other in silico predictions)
Reliability score of 1 (Reliable without restriction) or 2 (Reliable with restriction) as originally defined by Klimisch et al. (Klimisch et al., 1997)
Endpoint: skin irritation in vivo, also (skin irritation / corrosion, other|skin irritation / corrosion)
Species: Rabbit, other
Query results were assembled and filtered to include only results for which the tested substance was identified as a mono-constituent substance that had at least two independent endpoint study reports (ESRs) each. To avoid duplicate ESRs, only full registration dossiers were used. Additionally, some ESRs contained multiple outcomes, so any in vitro or non-rabbit results were removed.
The information extracted included substance identifiers, the endpoint measured, type of information, adherence to specific guidelines, methodological information, and all reported results. Detailed information on the extracted data can be found in Supp. Table 1. The data set is available through the NTP Integrated Chemical Environment (ICE) web application (https://ice.ntp.niehs.nih.gov/DATASETDESCRIPTION).
2.2. Data curation
Data from individual ESRs were inspected line by line, and any methodological deviation from the EPA guideline was noted with a data flag (Supp. Table 2). Where data were available, average erythema and edema scores were extracted or calculated based on reported results. PDII scores were then calculated from the erythema and edema scores. If PDII were reported in the ESR, they were only used when the data were not available with which to calculate the PDII. If an ESR contained erythema and edema scores from both intact and abraded skin, but they were reported separately, only the intact skin scores were used in calculating the PDII. On the other hand, if data were reported so that it was not possible to separate the intact and abraded skin scores, the ESR was given the appropriate data flag (Flag 2, see Supp. Table 2).
Quality control (QC) was performed at 25% curation completion intervals on a randomly selected 20% subset of the ESRs in that curation interval. Each ESR assigned for QC was examined by a curator who had not performed the initial curation of that ESR, and any discrepancies were noted in a QC log. Input from a third curator was sought for all noted discrepancies before changes were made to the dataset. Formatting QC was also performed at the same 25% curation completion intervals.
2.3. Regulatory classifications
EPA classifications II, III, and IV were assigned according to the PDII ranges shown in Fig. 1A. Category I assignments are based on the presence of corrosive effects rather than PDII scores. In our curation, if the ‘interpretation of results’ or ‘conclusions’ column stated ‘corrosive’ in any fashion, or if the ESR detailed any evidence of corrosive effects or necrosis in any results or remarks fields, the ESR was assigned a classification of Cat. I.
GHS classifications were also curated for each ESR when possible, based on the ranges provided in Fig. 1B. Otherwise, classifications reported in the ‘interpretation of results’ field were used. Entries in this field are only partially standardized and curation consisted of converting raw text entries to GHS categories (1, 1A, 1B, 1C, 2, 3 or NC [not classified]) where possible.
2.4. Data sets
Four separate data sets were compiled for examining reproducibility using conditional probabilities, three with EPA classifications and one with GHS. The data sets for EPA classifications were iteratively derived by applying flags for deviations from methodological criteria based on EPA guidelines, which was not possible for GHS largely due to lack of individual animal data. Supp. Table 2 contains the numbers of ESRs that received each flag. The ‘Full EPA’ data set contained all ESRs regardless of data flags. The ‘Clean EPA’ data set consisted of ESRs that had no data flags assigned to them (listed below). The ‘Curated EPA’ data set consisted of the entire ‘Clean’ data set, with the re-inclusion of ESRs with specific flags (note that some ESRs could have been associated with more than one flag). Those flags are bolded in the following list, which also contains their re-inclusion justifications:
Flag 1: Experiment conducted on abraded skin only. Although the original test method protocols included abrading the skin prior to dosing, both EPA OPPTS 870.2500 (US-EPA, 1998) and OECD TG 404 (OECD, 2002) now indicate that, “Care should be taken to avoid abrading the skin, and only animals with healthy, intact skin should be used”. For this reason and given the likely differences in study results with abraded or non-abraded skin, we excluded studies with abraded skin.
Flag 2: Conducted on both abraded and intact skin, but data were not reported in a way which the results could be separated.
Flag 3: Test substance was applied at a concentration less than 90%.
Flag 4: Exposure time was < 4 hours without a corrosive response.
Flag 5: Exposure duration greater than 4 hours. Re-inclusion rationale: EPA guidance document OPPTS 870.2500 (US-EPA, 1998) recommends exposure duration of 4 hours, but that exposure can be extended to more closely estimate expected patterns of human exposure.
Flag 6: Unknown number of animals.
Flag 7: < 3 animals without a corrosive response.
Flag 8: Incomplete observation timepoints. Re-inclusion rationale: EPA guidance (US-EPA, 1998) states that observations should be made within 1 hour of patch removal, and then 24, 48 and 72 hours later. We did not include the 1- hour timepoint in our assessment of ‘complete’ time points as it is not required under GHS guidance and was absent from a large portion of the ESRs. The majority of ‘incomplete timepoint’ flagged studies lacked or were unclear on inclusion of a 48-hour observation. Frequently ESRs reported values of ‘24 – 72 hours’ in the timepoint field associated with average erythema or edema scores. These studies were flagged as it was not possible to determine if they included the 48-hour reading, but were ultimately included in the curated set.
Flag 9: Study reported an irritation parameter other than erythema, edema or PDII. Re-inclusion rationale: this flag was created to capture studies that reported scores using differing nomenclature such as ‘overall irritation score’ or ‘primary irritation index’. If nomenclature used prevented us from calculating a PDII with confidence, the study would have been removed in the initial filtering step. The studies that remained with this flag also have PDIIs, indicating either that we had other methodological information to establish that these results were indeed PDIIs or we were able to calculate them from reported erythema and edema scores.
Flag 10: Reported and calculated PDII did not match. Re-inclusion rationale: this flag was used to indicate that our calculated PDII did not match what was reported by the ESR submitters. Often, this was the result of the study authors including both intact and abraded skin in the reported PDII. As noted above, whenever possible, we only used data from intact skin to calculate PDIIs. In any case, our calculated PDIIs were used for classification.
Flag 11: Reported scores contain a range. Re-inclusion rationale: if the range reported prevented us from calculating a PDII, the study would have been removed in the first filtering step. The studies that remained with this flag frequently contained scores with ranges for erythema and edema, but also reported exact PDII’s, or vice versa.
At this point it was clear that some ESRs for unique substances contained identical data, as would be expected in a read-across scenario, even if they were not explicitly designated as such. To search for potential read-across data, molecular fingerprints for each substance were obtained and pairwise Tanimoto similarity scores were generated for all unique substances (Karmaus et al., 2016). ESR data from pairs of substances with Tanimoto scores >= 0.8 were manually inspected to ensure the data was unique and was generated from the correct test substance. When data was shared between multiple highly similar substances it was assigned to the correct substance whenever possible, and removed from the ‘Curated EPA’ dataset when not.
The ‘GHS’ data set was derived from ESRs with GHS classifications. Since the data flags were specific to methodological deviations from EPA guidance, they were not considered in deriving the GHS dataset. ESRs identified as potential read-across were also removed from the ‘GHS’ data set.
2.5. Conditional probabilities
Conditional probabilities, conducted iteratively for each category, were used to evaluate the reproducibility of the hazard classifications for both EPA and GHS as described by Luechtefeld et al. (Luechtefeld et al., 2016) using the following equation:
This equation gives the probability of a Type 1 result for the in vivo rabbit skin test given a Type 1 result for another rabbit skin test of the same chemical. Ti = 1 represents a test (i) with outcome Type 1. Data sets were created for each category defined by all the substances classified in that category at least once. The frequency of classification for each category, given the total number of ESRs in the data set, was determined. Probability (P) was calculated for each category by dividing the frequency of each category (Ci) by the frequency of all categories (total number of ESRs) (A) in that dataset. P= Ci/A.
We also evaluated a binary classification approach to determine if the reproducibility of the in vivo rabbit test was improved by using a simple irritant vs. non-irritant classification system. For EPA, Cat. I and Cat. II were grouped together as irritants, and Cat. III and Cat. IV were considered non-irritants. This grouping was largely based on the personal protective equipment requirements defined by each category (Fig 1A): Cat. I and Cat. II require coveralls for safe handling, while Cat. III and Cat, IV do not. For GHS, Cat. 1 (A / B / C) and Cat. 2 were combined, and Cat. 3 and non-classified/no category were grouped together as non-irritants (Fig 1B). Conditional probabilities were then calculated as above using these two-category classification systems.
2.6. Physicochemical properties
To investigate the potential for intrinsic chemical properties as a source of variability, we grouped substances from the ‘Curated EPA’ dataset together as variable and non-variable. Variable substances were defined as those that were categorized in multiple EPA hazard categories (n=91), and non-variable substances were those that were categorized in only a single hazard class (n=334). We compared the distribution of a number of physicochemical properties predicted using the Open Structure-activity/property Relationship App (OPERA) (Mansouri et al., 2018) obtained via the Integrated Chemical Environment (ICE) (Bell et al., 2020, 2017) web application.
3. Results
3.1. Dataset characterization
3.1.1. Full EPA data set
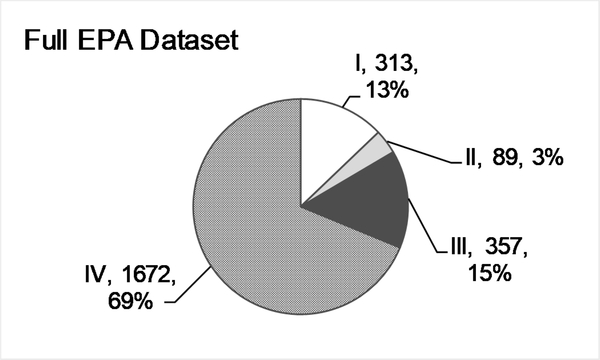
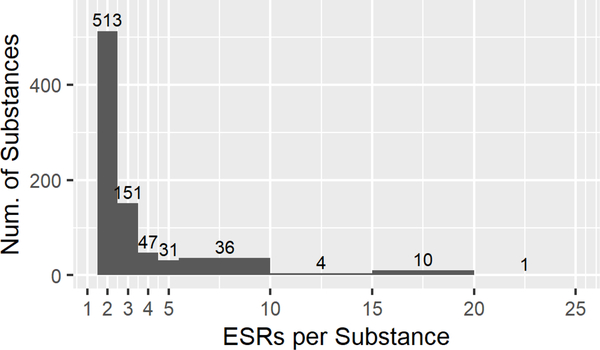
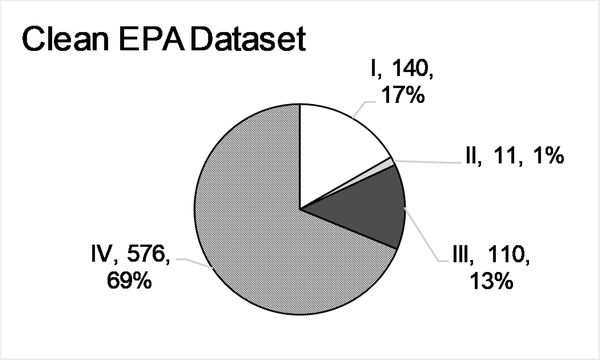
After query results were assembled, 3291 ESRs remained, covering 1071 individual mono-constituent substances, and was representative of the chemical space of ECHA/REACH registered substances. Each substance had at least two ESRs in the data set, which contained 13,844 rows of data. Fig. 1C diagrams the filtering steps used to create each of the data sets. After manual curation, PDIIs were calculated for 2624 ESRs representing 990 substances. When this data set was filtered to exclude substances represented by only one ESRs, 797 substances and 2431 ESRs remained. This is referred to as the ‘Full EPA’ dataset (Supp Table 3). Fig. 2A shows the breakdown of this data set by EPA category with most substances falling into Cat. IV. The distribution of ESRs per substance can be seen in Fig. 2B, with 513 substances in the full data set described in two ESRs and 151 in three ESRSs, and 10 substances with fifteen to twenty ESRs each.
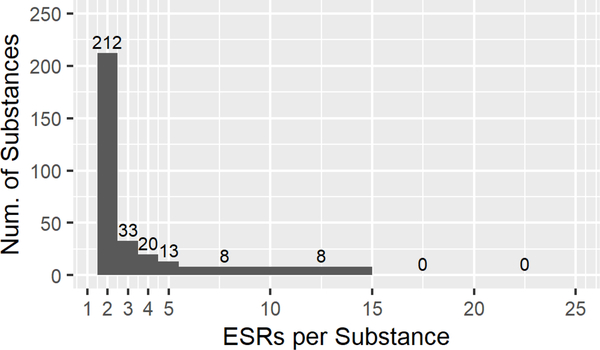
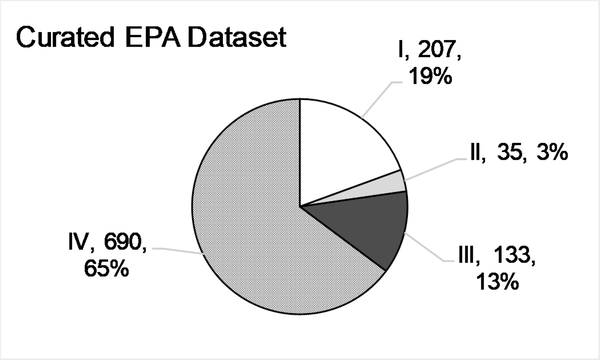
Figure 2:
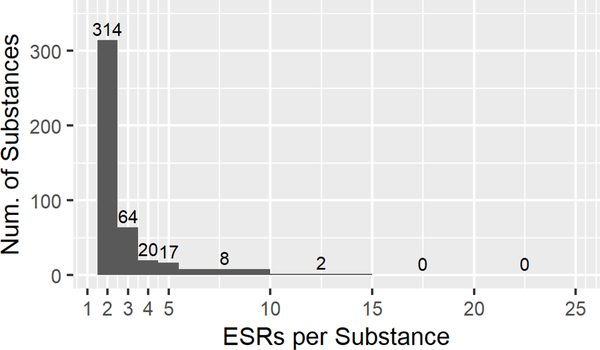
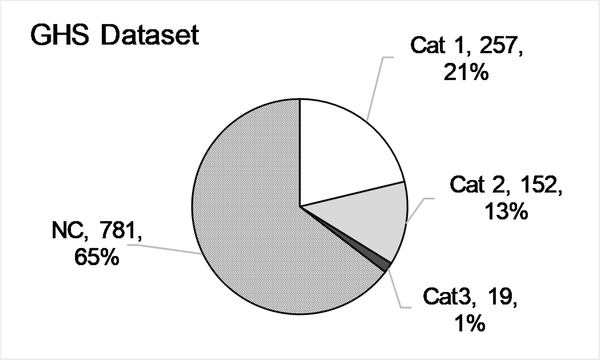
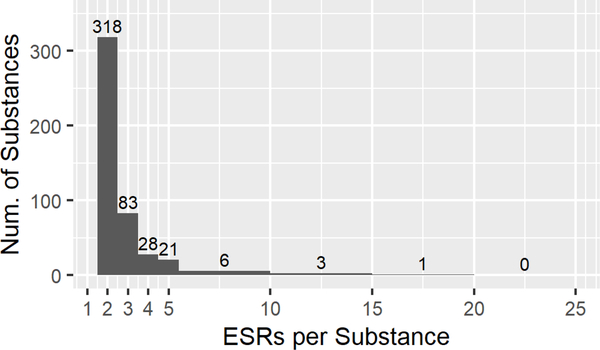
Descriptive statistics for the EPA categorized ‘Full’(A,B), ‘Clean’(C,D), and ‘Curated’ (E,F) data sets, and the ‘GHS’ (G,H) data set. A, C, E, G. Numbers of Endpoint Study Reports (ESRs) and distributions of calculated EPA classifications for every ESR in each data set (Category, n, %). B, D, F, H. Distribution of the number of ESRs per substance in each data set.
3.1.2. Clean EPA data set
Of the 2431 ESRs in the ‘Full EPA’ dataset, approximately half were flagged for methodological deviations or concerns (Section 2.4). The ‘Clean EPA’ dataset was constructed by selecting only those ESRs that were not flagged for any reason and then retaining substances that still contained multiple ESRs. The resulting dataset contained 837 ESRs and 294 individual substances. Importantly, only 11 ESRs, or 1.3%, fell into Cat. II (Fig. 2C).
3.1.3. Curated EPA data set
While some data flags were considered to represent major methodological deviations that warranted exclusion from the dataset, other flags were considered less impactful and thus the ESRs with such flags could be included in the analysis. Our final ‘Curated EPA’ data set was constructed by adding back ESRs with specific flags (Section 2.4) to the ‘Clean EPA’ data set, and removing suspected read-across data. The inclusion of the flagged studies in the ‘Clean EPA’ data set increased the number of ESRs to 1834, covering 867 substances. Removing the suspected read-across ESRs and filtering the ‘Curated EPA’ dataset to include only those substances with multiple ESRs reduced the number of substances to 425, with 1065 ESRs remaining. Fig. 2E details the numbers and percentages of ESRs per EPA category. Notably, with the re-inclusion of these studies, Cat. II now contains 35 ESRs, or 3.3% of the final dataset. In the ‘Curated’ dataset, 89% (378/425) of the results still originate from substances with two or three ESRs (Fig. 2F).
3.1.4. GHS data set
Since the EPA and GHS classifications were determined from different columns in the ESRs, the resulting data sets were distinct and not entirely overlapping. To accurately assign GHS classifications requires individual animal data, which were largely not available. Thus, we used the hazard classifications as reported in the ESRs. After removal of suspected read-across ESRs, the ‘GHS’ data set consisted of 1209 ESRs covering 460 individual substances, of which 283 substances overlapped with those in the ‘Curated’ EPA dataset and 177 were unique to the GHS data set. The distribution of classifications was slightly different in the ‘GHS’ data set (Fig 2G), with Cat. 2 being nearly 11% of the total ESRs and Cat. 3 representing only 1.36%. Similar to the EPA classified datasets, 87% (401/460) of the substances in the GHS data set had 2 or 3 ESRs per substance (Fig. 2H).
3.2. Conditional Probabilities
3.2.1. EPA data sets
Conditional probabilities can be thought of as the likelihood that a substance classified based on a single test result would receive the same classification if tested again. Conditional probabilities (Tables 1 A–C) were calculated for each dataset as described in Section 2.5.
Table 1:
Conditional probabilities for the ‘Full EPA’ (A), ‘Clean EPA’ (B), ‘Curated EPA’ (C), and ‘GHS’ (D) datasets.
| A. Full Data Set | |||||
|---|---|---|---|---|---|
| Prior Result | I | II | III | IV | Total |
| I | 76.0% | 8.0% | 8.5% | 7.5% | 313 |
| II | 12.0% | 28.1% | 35.3% | 24.6% | 89 |
| III | 5.8% | 5.0% | 43.5% | 45.7% | 357 |
| IV | 2.2% | 1.9% | 11.6% | 84.4% | 1672 |
| B. Clean Data Set | |||||
| Prior Result | I | II | III | IV | Total |
| I | 87.5% | 1.9% | 7.5% | 3.1% | 140 |
| II | 17.4% | 47.8% | 8.7% | 26.1% | 11 |
| III | 4.2% | 0.8% | 42.5% | 52.5% | 110 |
| IV | 0.8% | 0.8% | 9.7% | 88.8% | 576 |
| C. Curated Data Set | |||||
| Prior Result | I | II | III | IV | Total |
| I | 86.3% | 4.2% | 7.1% | 2.5% | 207 |
| II | 14.1% | 44.9% | 20.5% | 20.5% | 35 |
| III | 6.9% | 5.2% | 53.6% | 34.3% | 133 |
| IV | 0.9% | 2.0% | 9.1% | 88.0% | 690 |
| D. GHS Data Set | |||||
| Prior Result | Cat 1 | Cat 2 | Cat3 | NC | Total |
| Cat 1 | 86.2% | 7.7% | 0.3% | 5.7% | 257 |
| Cat 2 | 13.0% | 63.6% | 5.9% | 17.6% | 152 |
| Cat3 | 2.4% | 28.6% | 45.2% | 23.8% | 19 |
| NC | 2.2% | 4.2% | 1.4% | 92.1% | 781 |
While the individual probabilities vary, the trends remain constant throughout all datasets. The highest conditional probabilities were noted for EPA Cat. I and Cat. IV substances, indicating that substances in these categories are likely to produce similar results upon repeated testing. The probability of receiving a Cat. I classification given a prior Cat. I classification ranged from 76.0% in the ‘Full EPA’ dataset, to 87.5% in the ‘Clean EPA’ dataset. Likewise, the Cat. IV statistics ranges from 84.4% in the ‘Full’ dataset to 88.8% in the ‘Clean EPA’ dataset.
Categories II and III were far less reproducible. The probabilities of repeat categorization for Cat. II substances were 28.1%, 47.8% and 44.9% in the ‘Full EPA’, ‘Clean EPA’, and ‘Curated EPA’ datasets, respectively. In both the ‘Full EPA’ and ‘Curated EPA’ datasets, substances classified as Cat. II had a similar chance of being classified as Cat. III or Cat. IV (full 59.9%, curated 41.0%) when retested, rather than again being classified as Cat. II. In the ‘Full EPA’ and ‘Clean EPA’ datasets, substances classified as Cat. III were more likely to be classified as Cat. IV upon repeat testing than they were to receive another Cat. III classification. In the ‘Curated EPA’ data set they were slightly more likely to receive a repeat Cat. III result (53.6% Cat. III vs 34.3% Cat. IV).
3.2.2. GHS data set
The results were similar using the GHS criteria for classification (Table 1D). Cat. 1 and NC substances had an 86.2% or 92.1% probability of receiving the same classification when tested multiple times, respectively. Cat. 2 substances had a 63.6% chance of retesting as Cat. 2 and a combined 23.5% chance of being classified as a Cat. 3 or NC upon repeat testing. Cat. 3 substances had a 45.2% chance of retesting as Cat. 3, a 28.6% chance of testing at Cat. 2, and a 23.8% chance of testing at NC. It should be noted that only 19 ESRs were classified as Cat. 3 in the ‘GHS’ data set.
3.3. Effect of number of ESRs on reproducibility
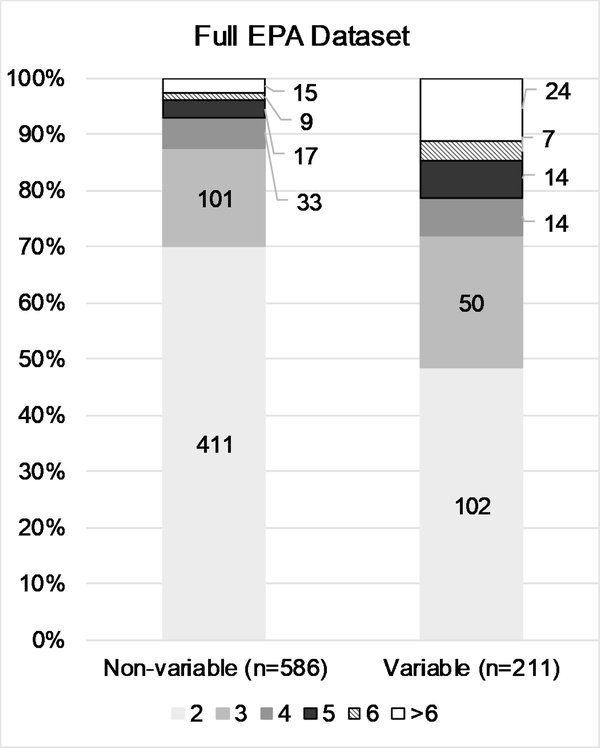
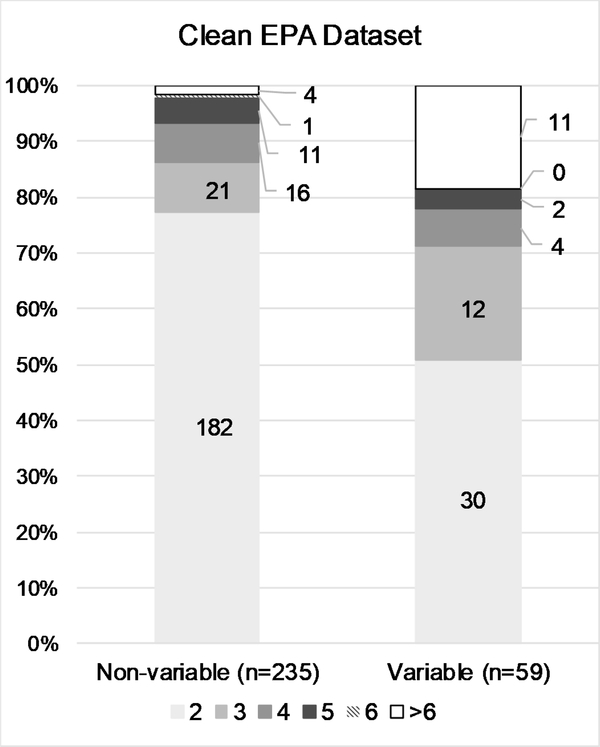
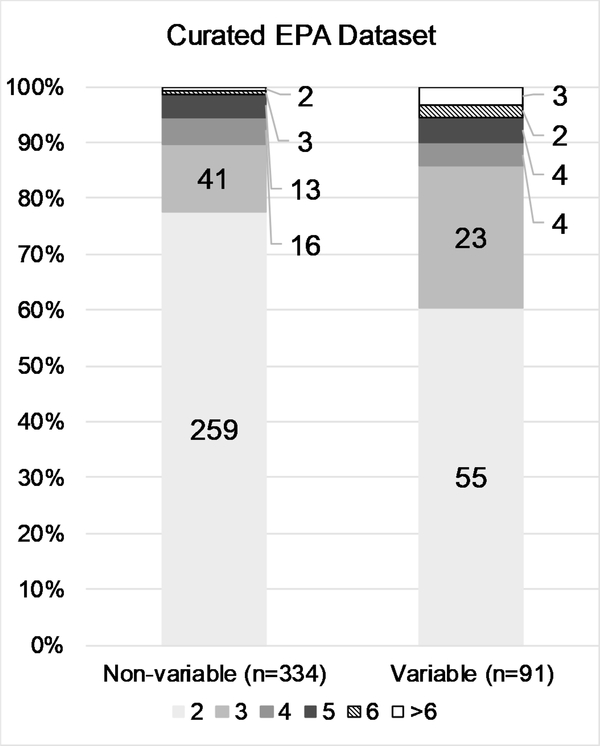
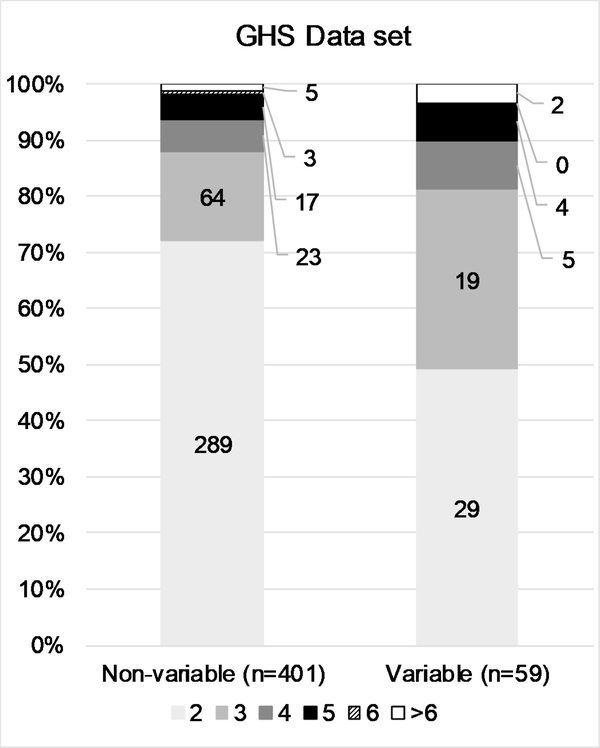
The conditional probability testing revealed that while in vivo test results are relatively reproducible at the extremes (i.e., corrosive or non-irritant substances), reproducibility is decreased for intermediate categories. To better characterize the number of substances contributing to the variability of in vivo test results, we examined the number and proportion of substances classified as non-variable vs. the number classified as variable, stratified by ESRs per substance. The general trend in all four data sets was that the variability observed in the results is primarily driven by many substances tested two or three times, rather than by a few substances tested more frequently (Fig. 3 A–D). While the proportion of ESRs per substance greater than 3 is slightly higher for the variable substances, the vast majority still have either 2 or 3 ESRs.
Figure 3:
Details the number and proportion of substances classified in single or multiple categories by the number of ESRs per substance, for the ‘Full EPA’ (A), ‘Clean EPA’ (B), ‘Curated EPA’ (C), and ‘GHS’ (D) datasets. Data labels indicate numbers of substances.
3.4. Binary classification approach
We then tested whether a binary approach to categorization would improve reproducibility. We combined categories based on the personal protective equipment required for safe handling. Specifically, we created a ‘Coveralls’ classification that included EPA Categories I and II, which both require the use of coveralls, and a ‘No Coveralls’ classification that included EPA Categories III and IV, neither of which require coveralls (Fig. 1A). The ‘Curated EPA’ dataset was then recategorized using these classifications. When the conditional probabilities were calculated using this binary decision approach (Table 2A), the reproducibility for the ‘No Coveralls’ classification was the highest seen in any case in the analysis, at 94.9%. The probability of a reproducible classification for substances classified as ‘Coveralls’ was 81.5%, which was only slightly lower than the Cat. I reproducibility from the previous analysis, but significantly higher than that of Cat. II, which was also part of the ‘Coveralls’ category. These results also raise the possibility of a tiered approach in which chemicals classified as “Coveralls” could then be further tested for corrosivity to refine PPE requirements.
Table 2:
A. Conditional probabilities using the ‘Curated EPA’ data set based on a binary approach combining Cat. I and Cat. II into a single category (‘Coveralls’), and Cat. III and Cat. IV into another single category (‘No coveralls’). B. Conditional probabilities based using the ’Cleaned GHS’ data set and a binary approach classifying substances as, ‘Protective clothing’ (Cat 1 or 2) or ‘no protective clothing’ (Cat 3 or NC).
| A. Prior Result | 'Coveralls' (Cat. I or II) | 'No coveralls' (Cat. III or IV) |
| 'Coveralls' (Cat. I or II) | 81.5% | 18.5% |
| 'No coveralls' (Cat. III or IV) | 5.1% | 94.9% |
| B. Prior Result | ‘Protective clothing’ (Cat. 1/2) | ‘No protective clothing’ (Cat. 3/NC) |
| ‘Protective clothing’ (Cat. 1/2) | 84.9% | 15.1% |
| ‘No protective clothing’ (Cat. 3/NC) | 7.1% | 92.9% |
Because criteria for GHS Categories and EPA categories are not equivalent (Fig. 1), directly comparing conditional probabilities of categories between systems is not valid. Therefore, we conducted a similar analysis for GHS classifications, with Cat. 1 and Cat. 2 combined into a single category (‘Protective clothing’), and Cat. 3 and NC combined into another category (‘No protective clothing’) (Fig. 1B. Conditional probabilities using this approach resulted in relatively high reproducibility for both categories with Cat. 1/2 results at 84.9% and Cat. 3/NC at 92.9%. (Table 2B).
3.5. Chemical properties of “non-variable” vs. “variable” substances
To investigate the potential that a group of specific physicochemical properties of test substances could contribute to the observed variability in hazard classifications, we compared those properties between substances categorized in only one hazard class and substances categorized in multiple hazard classes in the ‘Curated EPA’ data set (Supp. Fig. 1). Predictions were available for 262 of the 334 ‘non-variable’ substances and 85 of the 91 ‘Variable’ substances. A qualitative analysis of the distributions of all 10 properties examined indicated that none contributed to the observed variability or reproducibility.
4. Discussion
Here, we describe the collection, curation, and analysis of a data set of in vivo rabbit skin irritation test results from REACH registrations present in the ECHA database. The downloaded data set contained 3291 endpoint study results for 1071 substances, each with at least two individual test results. An extensive curation process was used to determine PDIIs for each ESR wherever possible and to flag studies with methodological deviations. This led to the creation of three sets of data with EPA classifications, ‘Full’, ‘Clean’, and ‘Curated’, with differing tolerances for the presence of data flags, and therefore differing numbers of ESRs. A fourth data set, ‘GHS’, was created by standardizing the GHS categorizations as reported in a subset of the ESRs.
Using conditional probabilities, we analyzed the reproducibility of the hazard classifications by asking the question, “When a substance is classified based on an in vivo rabbit test result, what is the probability that it will be assigned the same category if the substance is tested again?” We conducted these analyses using both EPA and GHS categories, though the underlying datasets where slightly different due to the differences in data required to assign classifications for each system. Regardless of which classification system was used, the overall results suggested that the animal test results are most reproducible at the extreme ends of the irritation spectrum (i.e., corrosive and non-irritating) and indicated that reproducibility drops dramatically for intermediate categories. In both the ‘Full EPA’ and ‘Curated EPA’ datasets, substances classified as Cat. II were more likely to be classified as Cat. III or Cat. IV than Cat II upon repeat testing. Notably, a Cat. II or Cat. III substance receiving a more severe irritancy classification is far less likely. For example, in the ‘Curated EPA’ dataset, a substance initially given a Cat. II classification had only a 14.1% chance of retesting as a Cat. I. Similarly, a substance initially given a Cat. III classification had only a 12.1% probability of retesting as Cat. I or Cat. II. We observed similar results with the GHS system. This trend is similar to what has been previously shown with eye irritation data (Luechtefeld et al., 2016).
Regardless of the dataset, most data comes from substances that have been tested either two or three times, with fewer substances tested more frequently. Similarly, most substances that have received categorizations in multiple hazard classes have either two or three ESRs per substance, suggesting that the variability is not attributable to specific chemical attributes. This observation was upheld when comparing the distribution of a wide array of physicochemical properties between variable and non-variable substance groups. Furthermore, the number and proportion of substances with > 6 ESRs per substance decreased for both ‘non-variable’ and ‘variable’ substances when suspected read-across data was removed, indicating that very few substances truly have results from more than 6 unique studies.
A major strength of our study is the curation of the underlying data and the resulting dataset we have created and made publicly available in ICE (https://ice.ntp.niehs.nih.gov/DATASETDESCRIPTION). Significant care and time were invested in manual row-by-row curation of nearly 14,000 rows of data to ensure that each ESR met minimum requirements for inclusion or was appropriately flagged to indicate what methodological deviations were present. This resulted in, to our knowledge, the largest available data set of high-quality in vivo skin irritation test results with either EPA or GHS hazard classifications, which could be further utilized in identifying reference chemicals with reproducible results to support fit-for-purpose validation of NAMs. Furthermore, the addition of detailed data flags allowed for quick filtering of ESRs to enable inclusion or exclusion of specific methodological differences. The fact that the four data sets analyzed herein showed similar trends regarding conditional probabilities suggests that these methodological differences do not account for a substantial proportion of the variability seen. This approach could potentially be extended to include the analysis of defined mixtures, though sourcing data for identical mixtures tested repeatedly may be more difficult.
The most notable limitation of our data set is that not all studies included were conducted strictly according to EPA or OECD guidelines. As previously stated, however, the deviations permitted in the ‘Curated EPA’ data set did not impact the ability to calculate PDIIs, nor did we consider that the accuracy of these PDIIs was affected. Another limitation is the potential inclusion of read-across data. Our queries were designed to exclude studies that were identified as read-across or other modelling-based data. However, trends that appeared in our results suggested that read-across data were still present in our data set even though they were not labeled as such. In fact, as specified in the initial queries, all of the suspected read-across ESRs were listed as ‘Experimental Results’ Detailed investigation of ESRs for pairs of substances with Tanimoto similarity scores > 0.8 led to the removal of 405 ESRs that contained duplicated data. The scenarios discovered ranged from 2 substances sharing data in 2 ESRs, to a group of 8 substances sharing between 11 and 13 ESRs. Every effort was made to assign individual ESRs to the correct test substance, but this was rarely achievable. If an ESR was associated with multiple substances and there was no information given about which substance was used in the generation of that data, the ESR was removed from all substances for which it was associated. There was at least one group of substances that shared data derived from a UVCB (unknown or variable composition) test substance, even though all substances in the group were listed as mono-constituent. Despite significant effort, it is not possible to determine the full extent to which our results may have been influenced by the presence of any read-across data that was not discovered in our dataset. However, inclusion of read-across data would only enhance reproducibility, so our findings associated with a lack of reproducibility are still valid.
There are other potential considerations. The ‘Clean EPA’ dataset contained very few substances classified as Cat. II, which may have skewed the analysis of this specific dataset. And, as the GHS system requires individual animal data to accurately make classifications, we were limited to using the classifications reported in the ESRs in the ‘interpretation of results’ field. It should be noted that this is an author-completed field and does not represent judgement made by ECHA. Assignment of GHS classifications was not possible for all ESRs, as some entries were blank or too vague to be assigned a definitive classification.
As US and international regulatory authorities are encouraging the development and implementation of NAMs in toxicity testing, appropriate benchmarks for evaluating NAMs performance are essential. Understanding the limitations, including variability, of those benchmarks is critical to assessing performance of any potential replacement assay. The most reproducible categories in our analysis (EPA Categories I and IV, GHS Categories 1 and NC) are also the ones for which alternatives have been accepted that replace the use of animals. As we have shown, there is substantial variability in the assessment of in vivo skin irritation in the irritant and moderate irritant ranges (EPA Cat. II to Cat. III, UN-GHS Cat. 2 to Cat. 3). These categories are also where alternatives are most often discordant with the in vivo test, thereby precluding their international adoption as complete replacements (Spielmann et al., 2007). This variability must be accounted for when evaluating the performance of NAMs. Another approach would be to acknowledge the shortcomings of using the animal data as a reference, and instead examine the available in vivo, in vitro, and ex vivo test methods with respect to their relevance to human dermal anatomy, anticipated exposure scenarios, and the mechanisms of skin irritation/corrosion in humans, as has been done recently for ocular toxicity. While a binary ‘Coveralls’ / ‘No Coveralls’ system did lead to more reproducible classifications, such a change would certainly impact existing registrations and regulatory use of test results beyond personal protective equipment requirements. These analyses help provide much-needed context not only to assess the reference test method, but also to aid in setting expectations for NAM performance.
Supplementary Material
Highlights.
Built a curated data set of 2624 in vivo skin irritation test results encompassing 990 substances.
Conditional probabilities were used to analyze the reproducibility of hazard classifications.
Reproducibility is best at the ends of the classification spectrums, corrosive or non-irritant.
Mild and moderate irritant results are far less reproducible, below 50% in most cases.
Variability in in vivo tests must be considered when benchmarking new approaches.
Acknowledgements:
The authors would like to thank Warren Casey and Pei-Li Yao for their technical review and feedback, and Shannon Bell and Ruhi Rai for their help with method development. The authors would also like to thank Toni Alasuvanto, Marta Sannicola, Jeroen Provoost, Panos Karamertzanis and Mike Rasenberg from the European Chemicals Agency for providing the original data for this analysis.
Funding:
This project was funded in whole or in part with federal funds from the NIEHS, NIH under Contract No. HHSN273201500010C.
Footnotes
Declaration of interests
☒ The authors declare that they have no known competing financial interests or personal relationships that could have appeared to influence the work reported in this paper.
Publisher's Disclaimer: This is a PDF file of an unedited manuscript that has been accepted for publication. As a service to our customers we are providing this early version of the manuscript. The manuscript will undergo copyediting, typesetting, and review of the resulting proof before it is published in its final form. Please note that during the production process errors may be discovered which could affect the content, and all legal disclaimers that apply to the journal pertain.
References
- Bell S, Abedini J, Ceger P, Chang X, Cook B, Karmaus AL, Lea I, Mansouri K, Phillips J, McAfee E, Rai R, Rooney J, Sprankle C, Tandon A, Allen D, Casey W, Kleinstreuer N, 2020. An integrated chemical environment with tools for chemical safety testing. Toxicol. In Vitro 67, 104916. 10.1016/j.tiv.2020.104916 [DOI] [PMC free article] [PubMed] [Google Scholar]
- Bell SM, Phillips J, Sedykh A, Tandon A, Sprankle C, Morefield SQ, Shapiro A, Allen D, Shah R, Maull EA, Casey WM, Kleinstreuer NC, 2017. An Integrated Chemical Environment to Support 21st-Century Toxicology. Environ. Health Perspect 125, 054501. 10.1289/EHP1759 [DOI] [PMC free article] [PubMed] [Google Scholar]
- De Jong WH, Hoffmann S, Lee M, Kandárová H, Pellevoisin C, Haishima Y, Rollins B, Zdawczyk A, Willoughby J, Bachelor M, Schatz T, Skoog S, Parker S, Sawyer A, Pescio P, Fant K, Kim K-M, Kwon JS, Gehrke H, Hofman-Hüther H, Meloni M, Julius C, Briotet D, Letasiova S, Kato R, Miyajima A, De La Fonteyne LJJ, Videau C, Tornier C, Turley AP, Christiano N, Rollins TS, Coleman KP, 2018. Round robin study to evaluate the reconstructed human epidermis (RhE) model as an in vitro skin irritation test for detection of irritant activity in medical device extracts. Toxicol. In Vitro 50, 439–449. 10.1016/j.tiv.2018.01.001 [DOI] [PubMed] [Google Scholar]
- Draize JH, Woodard G, Calvery HO, 1944. Methods for the Study of Irritation and Toxicity of Substances Applied Topically to the Skin and Mucous Membranes. J. Pharmacol. Exp. Ther 82, 377. [Google Scholar]
- ECHA European Chemicals Agency, 2017. Guidance to Regulation (EC) No 1272/2008 on classification, labelling and packaging (CLP) of substances and mixtures.
- Hoffmann S, Cole T, Hartung T, 2005. Skin irritation: prevalence, variability, and regulatory classification of existing in vivo data from industrial chemicals. Regul. Toxicol. Pharmacol 41, 159–166. 10.1016/j.yrtph.2004.11.003 [DOI] [PubMed] [Google Scholar]
- ICCVAM, 2018. A Strategic Roadmap for Establishing New Approaches to Evaluate the Safety of Chemicals and Medical Products in the United States.
- Karmaus AL, Filer DL, Martin MT, Houck KA, 2016. Evaluation of food-relevant chemicals in the ToxCast high-throughput screening program. Food Chem. Toxicol 92, 188–196. 10.1016/j.fct.2016.04.012 [DOI] [PubMed] [Google Scholar]
- Klimisch HJ, Andreae M, Tillmann U, 1997. A systematic approach for evaluating the quality of experimental toxicological and ecotoxicological data. Regul. Toxicol. Pharmacol. RTP 25, 1–5. 10.1006/rtph.1996.1076 [DOI] [PubMed] [Google Scholar]
- Luechtefeld T, Maertens A, Russo DP, Rovida C, Zhu H, Hartung T, 2016. Analysis of Draize eye irritation testing and its prediction by mining publicly available 2008–2014 REACH data. ALTEX - Altern. Anim. Exp 33, 123–134. 10.14573/altex.1510053 [DOI] [PMC free article] [PubMed] [Google Scholar]
- Mansouri K, Grulke CM, Judson RS, Williams AJ, 2018. OPERA models for predicting physicochemical properties and environmental fate endpoints. J. Cheminformatics 10, 10. 10.1186/s13321-018-0263-1 [DOI] [PMC free article] [PubMed] [Google Scholar]
- OECD, 2019a. Test No. 431: In vitro skin corrosion: reconstructed human epidermis (RHE) test method.
- OECD, 2019b. Test No. 439: In Vitro Skin Irritation: Reconstructed Human Epidermis Test Method.
- OECD, 2015a. Test No. 430: In Vitro Skin Corrosion: Transcutaneous Electrical Resistance Test Method (TER).
- OECD, 2015b. Test No. 435: In Vitro Membrane Barrier Test Method for Skin Corrosion.
- OECD, 2002. Test No. 404: Acute Dermal Irritation/Corrosion.
- Spielmann H, Hoffmann S, Liebsch M, Botham P, Fentem JH, Eskes C, Roguet R, Cotovio J, Cole T, Worth A, Heylings J, Jones P, Robles C, Kandárová H, Gamer A, Remmele M, Curren R, Raabe H, Cockshott A, Gerner I, Zuang V, 2007. The ECVAM international validation study on in vitro tests for acute skin irritation: report on the validity of the EPISKIN and EpiDerm assays and on the Skin Integrity Function Test. Altern. Lab. Anim. ATLA 35, 559–601. 10.1177/026119290703500614 [DOI] [PubMed] [Google Scholar]
- US-EPA, 2018a. Strategic Plan to Promote the Development and Implementation of Alternative Test Methods Within the TSCA Program.
- US-EPA, 2018b. Interim Science Policy: Use of Alternative Approaches for Skin Sensitization as a Replacement for Laboratory Animal Testing.
- US-EPA, 2016. Office of Pesticide Programs: Label Review Manual. Chapter 10: Worker Protection Labeling. [Google Scholar]
- US-EPA, 2015. USE OF AN ALTERNATE TESTING FRAMEWORK FOR CLASSIFICATION OF EYE IRRITATION POTENTIAL OF EPA PESTICIDE PRODUCTS.
- US-EPA, 1998. Health Effects Test Guidelines, OPPTS 870.2500 Acute Dermal Irritation.
- US-FDA, 2017. FDA’s Predictive Toxicology Roadmap.
- Weil CS, Scala RA, 1971. Study of intra- and interlaboratory variability in the results of rabbit eye and skin irritation tests. Toxicol. Appl. Pharmacol 19, 276–360. 10.1016/0041-008X(71)90112-8 [DOI] [PubMed] [Google Scholar]
- Worth AP, Cronin MT, 2001. The use of bootstrap resampling to assess the variability of Draize tissue scores. Altern. Lab. Anim. ATLA 29, 557–573. 10.1177/026119290102900511 [DOI] [PubMed] [Google Scholar]
Associated Data
This section collects any data citations, data availability statements, or supplementary materials included in this article.


