Abstract
To address how the microbiome might mediate the interaction between diet and cardiometabolic health, we analyzed longitudinal microbiome data from 307 male participants in the Health Professionals Follow-Up Study, together with long-term dietary information and measurements of biomarkers of glucose homeostasis, lipid metabolism, and inflammation from blood samples. We demonstrate that a healthy Mediterranean-style dietary pattern is associated with specific functional and taxonomic components of the gut microbiome, and that its protective associations with cardiometabolic health vary depending on microbial composition. In particular, the protective association between adherence to the Mediterranean diet and cardiometabolic disease risk was significantly stronger among participants with decreased abundance of Prevotella copri. Our findings advance the concept of precision nutrition and have the potential to inform more effective and precise dietary approaches for the prevention of cardiometabolic disease mediated through alterations in the gut microbiome.
Introduction
Cardiometabolic disease, including both cardiovascular disease (CVD) and type 2 diabetes (T2D), are top contributors to the burden of disease in the US1 and globally2. Recent studies in humans have linked personalized microbial metabolism and immune interactions of the gut microbiome with risk of cardiometabolic disease3–7. This leads to the hypothesis that specific diets can have highly variable effects on individual cardiometabolic disease risk as a result of the individualized nature of the gut microbiome8–10. However, few studies have formally tested not only whether gut microbial profiles respond to dietary interventions, but whether the gut microbiome can in turn modulate the association between diet and cardiometabolic disease risk.
Testing these hypotheses in an integrated manner is key for improving human health via dietary modification since the gut microbiome explicitly engages in a bidirectional relationship with diet. On one hand, gut microbial composition and biosynthetic capacity are responsive to host diet11,12; on the other, microbes in turn influence nutrients reaching the host through the metabolism of food13. In general, most short-term dietary changes tend to have very large effects in animal models14,15, while only extreme dietary changes induce modest effects in typical adult humans11,16. Dietary patterns can have larger effects on the early life, developing infant microbiome17,18 or in highly variable, traditional diet populations12,19, but these are unusual relative to the much smaller role that typical long-term dietary patterns play in shaping an individual’s gut microbial makeup16,20,21. Additionally, long-term diet is often of greatest interest in the study of chronic disease given the long induction periods for CVD and T2D. However, the lack of long-term dietary measurements in current diet-microbiome studies is a significant impediment to well-conducted studies exploring their two-way relationship.
Relatedly, the Mediterranean diet (MedDiet), characterized by intake of fruits, vegetables, nuts, legumes, and olive oil, fewer red meats and refined grains, and low-to-moderate wine consumption22, has been recommended for the prevention of CVD and T2D23,24. The randomized PREDIMED trial provided causal evidence that the MedDiet, compared to a low-fat diet, lowers risk of CVD by 30% at 5 years25. Several studies suggest that the MedDiet differs from typical Western dietary patterns in their associations with gut microbial taxonomy8,26,27. More recently, two intervention studies linked MedDiet to a number of taxonomic features, such as increased abundance of Faecalibacterium prausnitzii and Roseburia and decreased abundance of Ruminococcus gnavus, Collinsella aerofaciens, and Ruminococcus torques26,27. However, a majority of existing studies are limited by the use of 16S ribosomal RNA gene sequencing processed to yield only very general taxonomic profiling (e.g. phyla or genera) and, consequently, omit strain-specific diet-related biochemical functionality of microbes.
In this study, we analyze the interplay of a MedDiet, the gut microbiome, and cardiometabolic disease risk in a subpopulation of over 300 men from the long-running Health Professionals Follow-up Study28. The primary goal of this study is to understand whether the association between the adherence to the MedDiet and cardiometabolic disease risk varies in individuals with different gut microbial profiles, with a secondary goal of understanding the MedDiet’s influence on the gut microbiome. We first quantified each participant’s adherence to the MedDiet based on dietary information collected every four years across nearly three decades. Second, we combined this with taxonomic and functional profiling from stool metagenomes and metatranscriptomes collected longitudinally from up to four time points per individual. Third, we identified gut microbial species and functions, i.e., the enzymes and pathways encoded and transcribed by gut bacteria, differentially abundant among participants with varying degrees of adherence to the MedDiet. Lastly, we assessed each participant’s cardiometabolic disease risk using biomarkers of glucose homeostasis, lipid metabolism, and inflammation measured on blood samples. We found the protective association of the MedDiet with cardiometabolic disease risk was particularly strong in participants with gut microbiomes depleted of Prevotella copri. This represents one of the first demonstrations in human subjects of not only long-term diet’s influence on the gut microbiome, but also of diet-driven chronic disease risk being modulated by the gut microbiome.
Results
Diet, the gut microbiome, and cardiometabolic disease risk assayed in an epidemiological study with prolonged follow-up
To study the potential role of the gut microbiome in modulating the protective association of a MedDiet with cardiometabolic disease risk, we assessed a cohort of 307 generally healthy men from the Men’s Lifestyle Validation Study (MLVS) with detailed dietary assessments, stool, and blood samples (Fig. 1 and Methods). The MLVS is a subpopulation of the long-running Health Professionals Follow-Up Study (HPFS, https://sites.sph.harvard.edu/hpfs/).
Figure 1: Experimental strategy for linking diet, the gut microbiome, and cardiometabolic disease risk in the Men’s Lifestyle Validation Study.
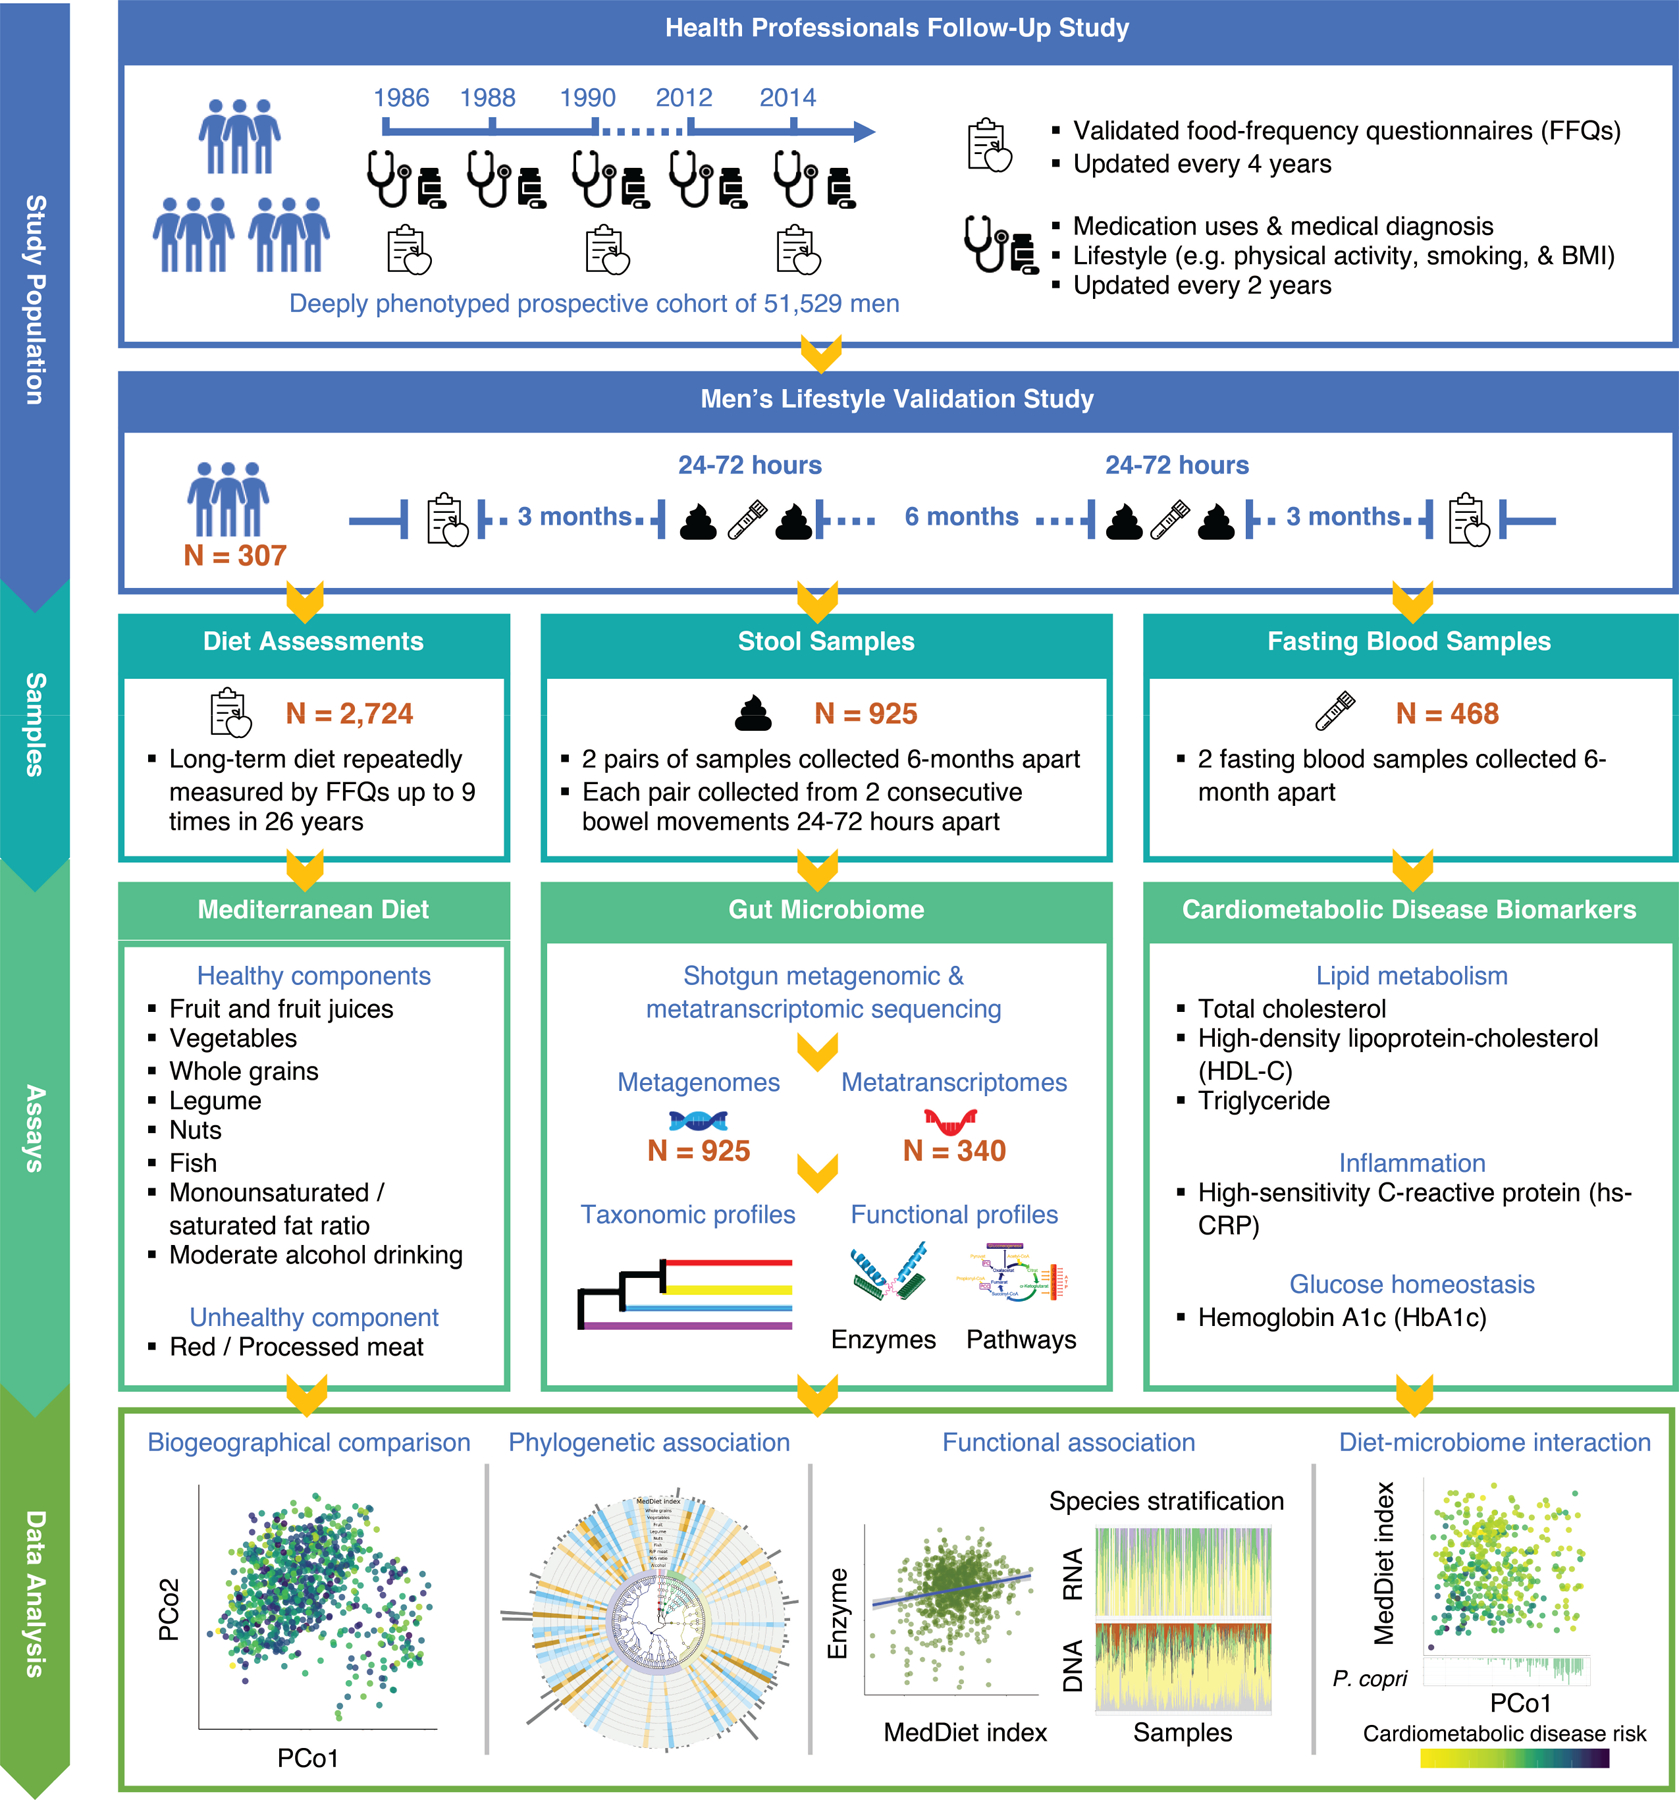
In order to associate gut microbiome features with diet and cardiometabolic disease risk, we profiled stool metagenomes, metatranscriptomes, and blood biomarkers of cardiometabolic disease from the Men’s Lifestyle Validation Study (MLVS). The MLVS is a sub-study of the Health Professionals Follow-up Study (HPFS), an ongoing prospective cohort totaling 51,529 men. The HPFS has repeatedly collected dietary information using validated food-frequency questionnaires (FFQs) and health-related information since 1986. In 2011 to 2013, the MLVS collected stool samples at up to four time points per individual, blood samples at up to two time points, and additional dietary information using FFQs from 307 participants. We applied MetaPhlAn 2 and HUMAnN 2 to perform taxonomic and functional profiling from stool shotgun metagenomes and metatranscriptomes. Plasma biomarkers of lipid metabolism, inflammation, and glucose homeostasis were measured using standard methods. We employed linear mixed models to account for within-subject correlation due to repeated sampling and occasional missing data (Methods).
To profile the microbiome in this population, 307 MLVS participants provided fecal samples from up to two paired collections six months apart from 2011 to 2013, which yielded 925 shotgun metagenomes and 340 shotgun metatranscriptomes (Fig. 1 and Methods)28. Taxonomic profiling using MetaPhlAn 229 quantified a total of 468 microbial species across all subjects (prior to quality control, Methods). Functional profiling using HUMAnN 230 assigned 75.3% of all DNA reads and 64.1% of all RNA reads to UniRef90 gene families, 54.8% and 58.1% of which possessed functional characterization, respectively, and 10.7% and 13.2% of characterized gene families were assigned to MetaCyc pathways as previously described28.
We repeatedly administered up to nine validated semi-quantitative food frequency questionnaires (FFQs) to collect dietary information during the preceding one year in our study participants from 1986 through 2013. From 1986 to 2010, dietary information was collected every four years. From 2011 to 2013, two FFQs were each administered three months before and after the biospecimen collections in the MLVS. A vast majority of the participants provided dietary information all nine times (n=271; Supplementary Table 1). To best represent long-term habitual diet, we calculated cumulative average intake by summing up the intake levels from all available FFQs and then dividing the sum by the number of FFQs.
The MLVS also collected blood samples at up to two time points and measured hemoglobin A1c (HbA1c) and plasma triglyceride, total cholesterol, high-density lipoprotein-cholesterol (HDL-C), and high-sensitivity C-reactive protein (hs-CRP, Methods). This study included 304 participants who provided 468 blood samples in the analyses that involve blood biomarkers (Supplementary Table 1).
Adherence to a Mediterranean-style healthy dietary pattern covaries with composition and function of the gut microbiome
Each participant’s adherence to the MedDiet was evaluated by a 9-dimensional MedDiet index with a possible range from 0 (non-adherence) to 9 (perfect adherence, Methods, Supplementary Table 2 and Extended Data Fig. 1a)22,31. As expected, participants who had a higher adherence to MedDiet consumed more beneficial components of the MedDiet, including whole grains, vegetables, fruit, nuts, legumes, fish, and monounsaturated fats (at the expense of saturated fats); they correspondingly consumed less red and processed meat, a detrimental component of the MedDiet index (Fig. 2a and Supplementary Table 3). The food and nutrient components of the MedDiet index were correlated with each other at weak to moderate magnitudes (Spearman correlation coefficient ranges from −0.44 to 0.45, Extended Data Fig. 1b). All participants were included in subsequent analyses regardless of their MedDiet index.
Figure 2: Mediterranean diet and taxonomic and functional profiles of the gut microbiome.
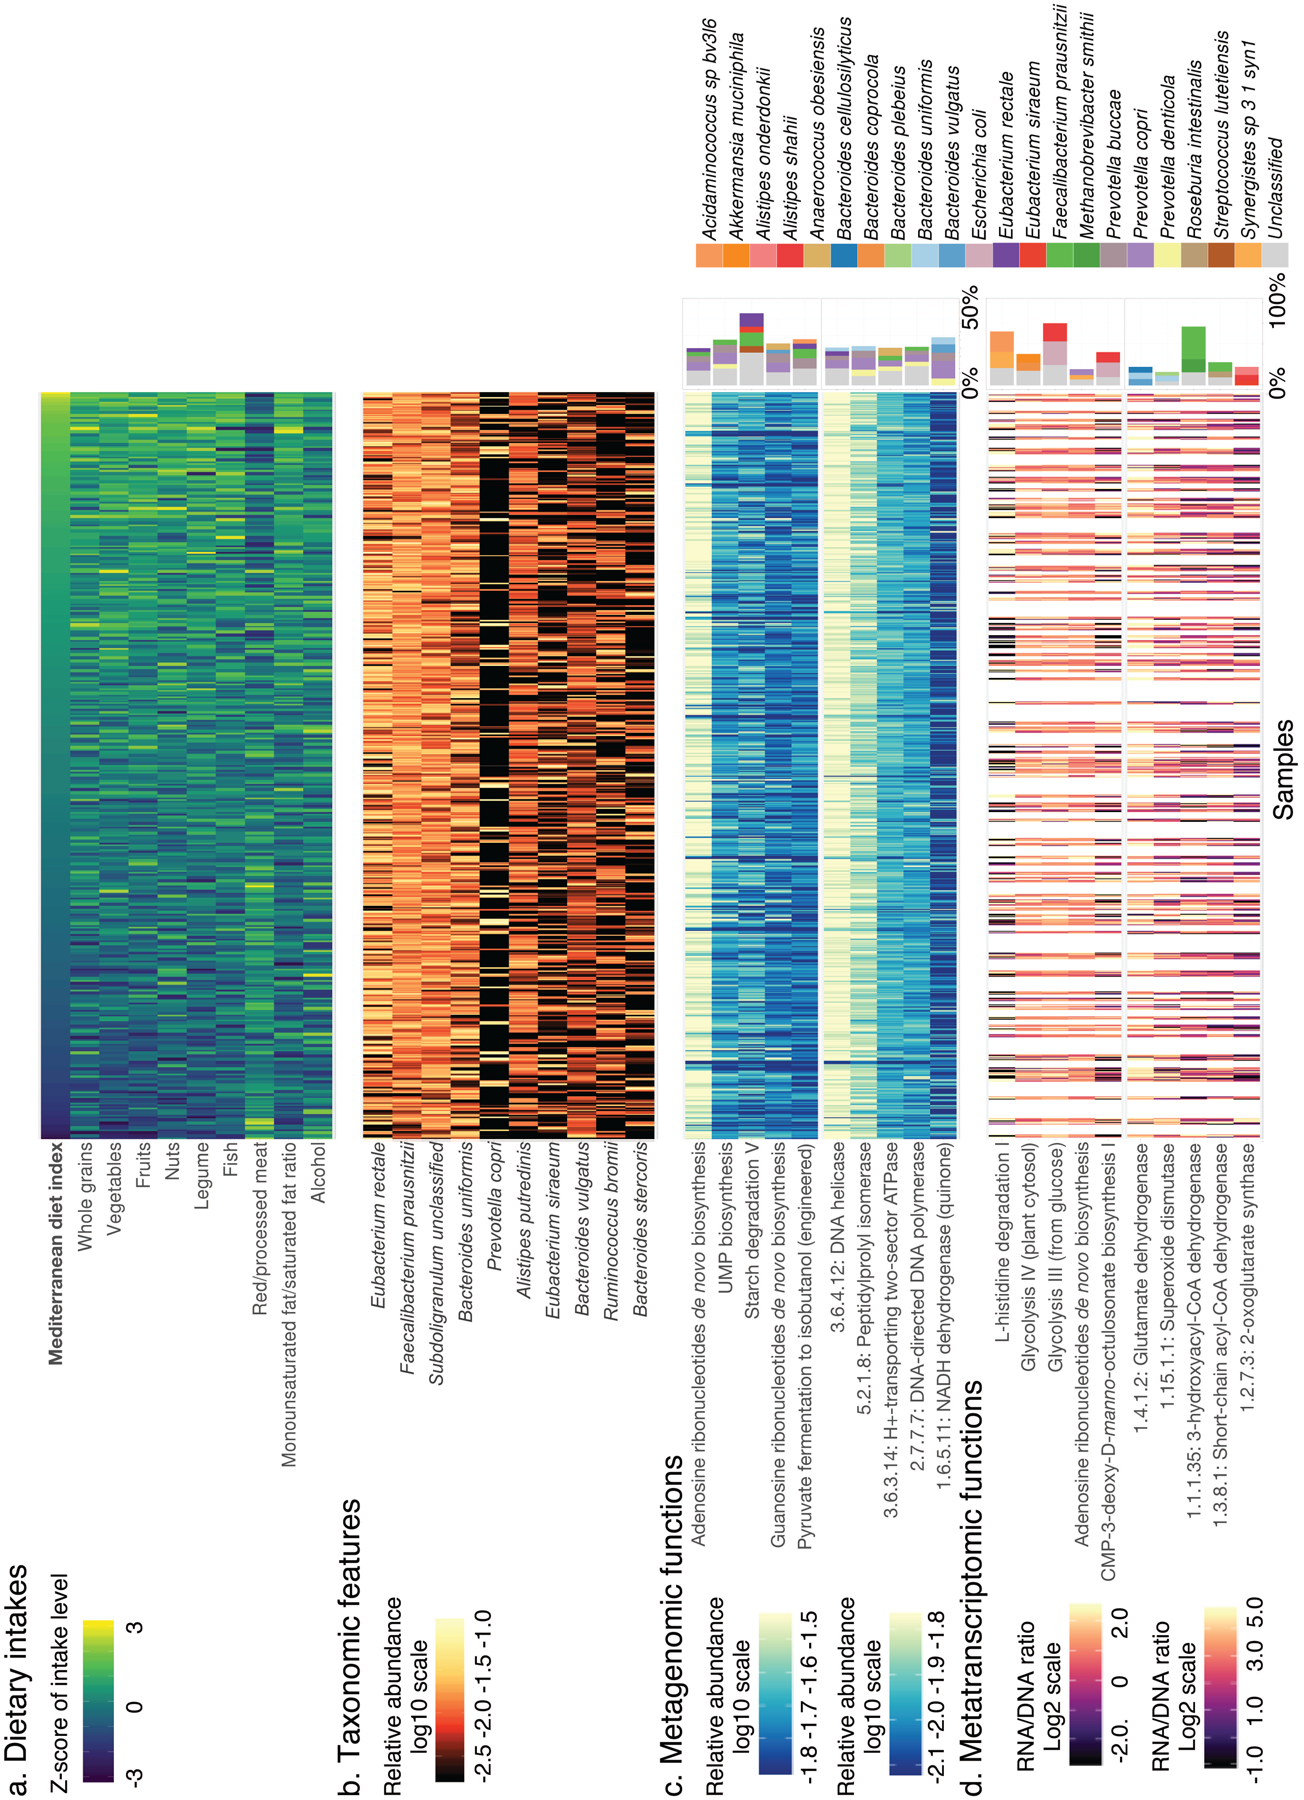
(a) Distributions of adherence to the Mediterranean dietary pattern and intake levels of constituent foods and nutrients among study participants (n=307, data in Supplementary Table 3). (b) Distributions of the 10 microbial species most abundant on average in analyzed metagenomes (based on 925 metagenomes, data in Supplementary Table 4). (c) Distributions of the five most metagenomically abundant DNA pathways (top) and enzymes (bottom), as well as the top five species contributing to each enzyme or pathway (right, also based on 925 metagenomes, data in Supplementary Tables 4 and 5). (d) Distributions of DNA-normalized transcript abundance for the five most metatranscriptomically abundant pathways (top) and enzymes (bottom), as well as the top three species contributing to each enzyme or pathway (right, based on 340 metatranscriptome and metagenome pairs, data in Supplementary Tables 4 and 5). Samples are ordered by the MedDiet index (from lowest to highest). A white column indicates that a metagenome or metatranscriptome was not available for the sample.
Overall, the 10 most abundant species together accounted for an average of 46% of community abundance (Fig. 2b and Supplementary Table 4). The most prominent patterns of gut microbial taxonomic variation in the population included the expected tradeoff between Bacteroidetes (e.g. Bacteroides uniformis) and Firmicutes (e.g. Subdoligranulum unclassified)32, as well as the expected P. copri-enriched subpopulation (Extended Data Fig. 2). P. copri has been previously observed to follow unusual ecological distribution patterns in Western populations, with the clade completely or near-absent in most individuals, but highly abundant in the remaining minority of carriers33–35. Here, this pattern was detected and proved to interact with the MedDiet and cardiometabolic disease risk in our study (see below). The most abundantly encoded and transcribed functions generally represented common housekeeping processes, such as the metabolism of carbohydrates, nucleic acids and nucleotides, vitamin biosynthesis, and genetic information processing (Fig. 2c–d and Supplementary Table 4). In general, the species encoding and transcribing these abundant pathways and enzymes were themselves highly prevalent and/or abundant, including F. prausnitzii, P. copri, B. uniformis, and Eubacterium rectale (Supplementary Table 5).
Mediterranean diet adherence has modest but significant effects on overall microbiome configuration and specific microbial species
Although the MedDiet index was not a major driver of overall structural variation of the gut microbiome (Fig. 3a), PERMANOVA testing (n =999 permutations) revealed that its association was significant with respect to both taxonomic [q (false discovery rate adjusted p-value) <0.005, Fig. 3b] and enzymatic structure (p =0.001), but not enzymatic transcription (p =0.16). This is concordant with long-term dietary intake exerting a gradual selective pressure on the adult gut microbiome, with transcriptional regulatory responses instead influenced by more localized stimuli. The small overall percentage of variation explained by the dietary pattern (0.7%) was comparable in magnitude with other large-scale investigations16,21. Among the dietary factors, covariables, and cardiometabolic biomarkers considered in this analysis, the MedDiet index accounted for the third largest proportion of variation in taxonomy (Fig. 3b). Furthermore, the MedDiet adherence was associated with a higher percentage of variation in taxonomy than several covariables previously reported to have strong influences on the gut microbial communities, such as antibiotic use36 (0.4%) and the Bristol stool scale16 (0.5%), although neither of these were commonly present or variable in this generally healthy population. In a secondary analysis, we found no medications explained more than 1%, with most <0.5%, of overall variation of the gut microbiome (Supplemental Fig. 1). We found no association between the adherence to the MedDiet and the diversity of the gut microbiome (p =0.21; Extended Data Fig. 3).
Figure 3: Associations of the Mediterranean diet with overall gut microbiome configuration and with individual gut microbial species abundances.
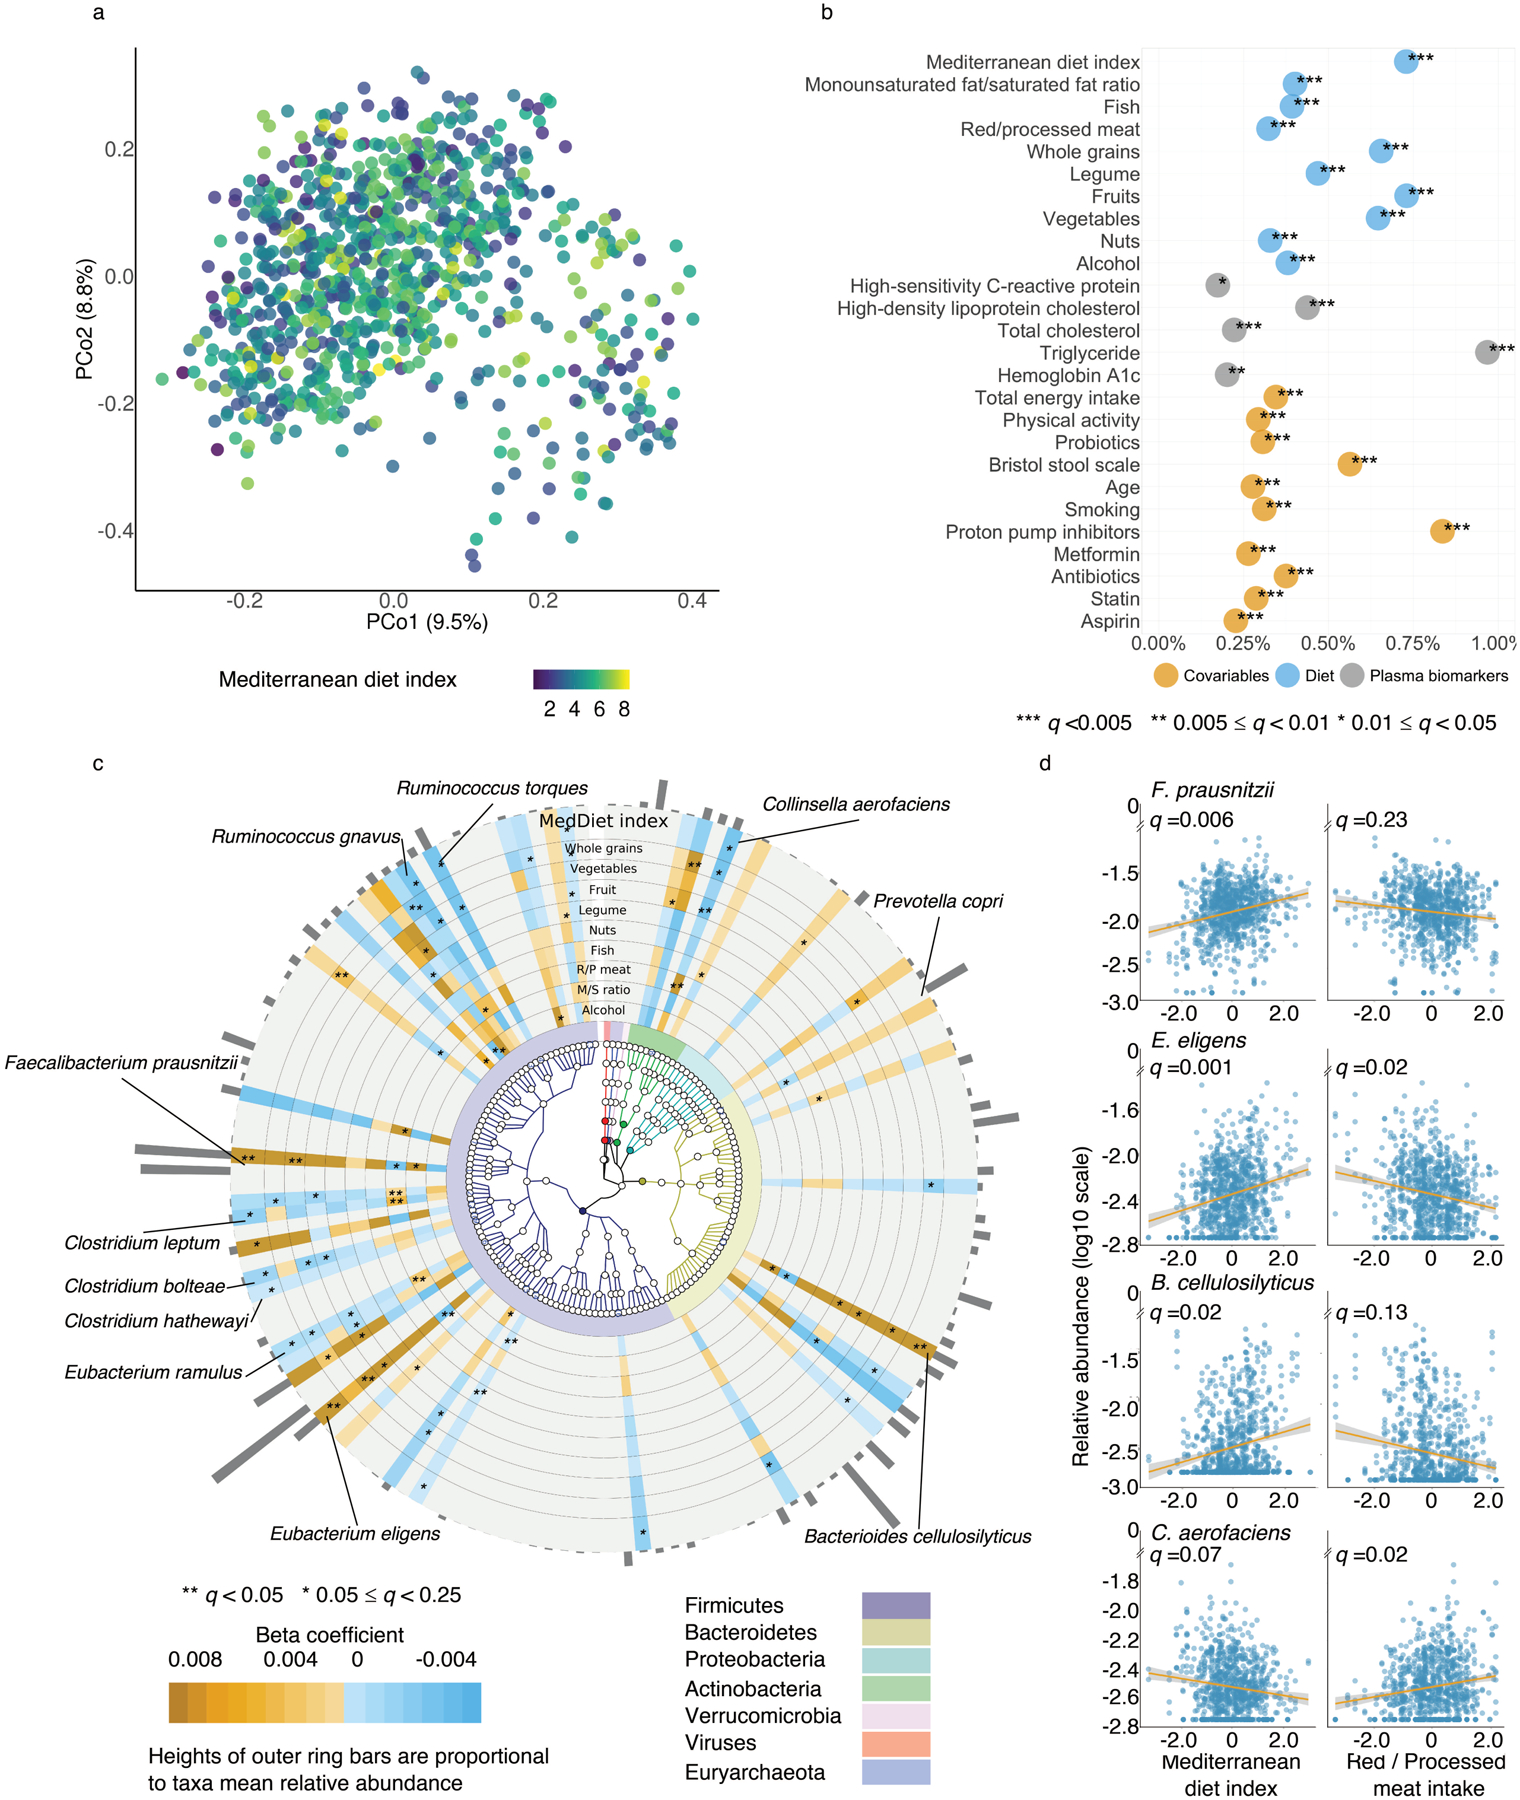
(a) Principal coordinate analysis of all samples using species-level Bray-Curtis dissimilarity. (b) Proportion of variation in taxonomy explained by the Mediterranean diet (MedDiet) index, dietary factors, plasma biomarkers and covariables based two-sided PERMANOVA testing (based on species-level Bray-Curtis dissimilarity). Q-values (false discovery rate adjusted p-value) were calculated using the Benjamini-Hochberg method with a target rate of 0.25. (c) Significant associations of the MedDiet and its constituent foods and nutrients with microbial species (q ≤0.25). This plot shows associations of dietary factors with specific microbial species overlaid onto their taxonomy. The blue-to-orange gradient in the outer rings represent the magnitude and direction of the associations between dietary factors and species’ abundances. The colors of the innermost ring and phylogenetic trees differentiate major phyla. Heights of the outmost bars are in proportion to the mean relative abundance of each microbial species. All models included each participant’s identifier as random effects and simultaneously adjusted for total energy intake, age, physical activity level, smoking, probiotic use, uses of medication including antibiotics, proton pump inhibitors, aspirin, statins and metformin, and the Bristol stool scale. (d) A subset of significant associations of plant-based foods and red/processed meat intake with microbial species (full results in Supplementary Table 6). Q-values (false discovery rate adjusted p-value) in (c) and (d) were derived from multivariable-adjusted linear mixed models as above, with multiple comparison adjustment also as above (Methods, exact q-values in Source Data). All the analyses in these panels were conducted based on all 925 metagenomes collected from 307 participants. All the statistical tests were two-sided.
We performed per-feature testing to identify microbial species associated with the MedDiet using linear mixed models in MaAsLin 2. These account for within-individual correlation from the study’s repeated sampling design, as well as occasional missing observations at some time points (Methods). All models included each participant’s identifier as random effects and simultaneously adjusted for potential confounders including total energy intake, age, physical activity level, smoking, probiotics use, medication use including antibiotics, proton pump inhibitors, aspirin, statins and metformin, and the Bristol stool scale as fixed effects. A total of 40 species-level features from four phyla were significantly associated with the MedDiet index or one of its components (q ≤0.25; Fig. 3c and Extended Data Fig. 4). Generally, the associations for plant-based foods were in the opposite direction compared the associations for red/processed meat intake (Fig. 3d and Supplementary Table 6). The MedDiet index was positively associated with several abundant dietary fiber metabolizers and short-chain fatty acid (SCFA) producers, including F. prausnitzii, Eubacterium eligens, and Bacteroides cellulosilyticus37. We observed inverse associations of the MedDiet index with species such as R. torques, Clostridium leptum and C. aerofaciens. Prior efforts have linked R. torques and select Collinsella and Clostridium species with Western-style diets and red meat intake, respectively38–41. We did not find that the MedDiet index or its components was significantly directly associated with the abundance of P. copri. Among the components of the MedDiet, whole grains, vegetables, fruits and red/processed meat were the major driving forces of the associations between the overall dietary pattern and the microbial features (Fig. 3c).
Mediterranean diet adherence particularly influences microbial plant polysaccharide degradation potential, short-chain fatty acid production, and pectin metabolism
We next investigated the MedDiet in relation to the functional potentials of the gut microbial communities, i.e., enzymes and metabolic pathways quantified from metagenomes. We found that the MedDiet or its components were significantly associated with 36 pathways (Extended Data Fig. 5) and 188 enzymes (Extended Data Fig. 6). Concordant with the fact that the MedDiet is a predominantly plant-based diet, the most prominent findings were enrichments of microbial functions for the degradation of specific dietary fibers and SCFA fermentation in individuals with greater MedDiet adherence. The MedDiet index was positively associated with the abundance of D-fructuronate degradation (PWY-7242, Fig. 4a), one mechanism for degrading pectin, a group of soluble fibers rich in fruits and some vegetables; this was also true for some individual constituent enzymes of the pathway, e.g., 2-dehydro-3-deoxygluconokinase (EC 2.7.1.45, Fig. 4b and Supplementary Table 6). Similarly, the mannan degradation pathway (PWY-7456) and an enzyme (EC 5.4.2.8: Phosphomannomutase) within the pathway were more abundant in individuals with greater MedDiet adherence; this is a component of hemicellulose degradation, an insoluble fiber embedded in almost all plant cell walls. Lignin is a group of non-carbohydrate phenolic polymers that is ubiquitously embedded in the plant cell wall and cross-links pectin, cellulose, and hemicellulose42. We identified a strong positive association between the MedDiet index and the abundance of a key enzyme in the breakdown of lignin-derived aromatics (EC 5.5.1.1: Muconate cycloisomerase), further supporting that the influence of the MedDiet on microbial functions could be attributed to its high-fiber content. Gut microbiomes in participants with a greater MedDiet adherence were also enriched for metabolic processes that yield SCFAs, end-products of fiber fermentation that act as signaling molecules and play important roles in regulating host metabolism, immunity, and cell proliferation43 (e.g., pyruvate fermentation to acetate and lactate II, PWY-5100). As expected, these pathways and their constituent enzymes were largely contributed by diverse anaerobic fiber metabolizers differing among subjects, such as F. prausnitzii and E. rectale, with several exceptions such as the pyruvate:ferredoxin oxidoreductase (EC 1.2.7.1) that was contributed by a multitude of organisms due to the fact that it is also involved in numerous other basic biochemical processes (Fig. 4b). Conversely, we found that a lower adherence to the MedDiet was associated with enrichment of the secondary bile acid biosynthesis potential. The bile-acid 7α-dehydroxylase (EC 1.17.98.1) that carries out the removal of the 7α-hydroxy group from primary bile acids44, encoded mainly by C. aerofaciens, was enriched in participants with low MedDiet adherence, especially those with high red/processed meat intake (Fig. 4b). The products of the enzyme, deoxycholate and lithocholate, are among the most well-studied secondary bile acids and can be hepatotoxic at elevated levels45,46. Interestingly, the lactose and galactose degradation pathway I (LACTOSECAT-PWY) and a constituent enzyme of the pathway (EC 3.2.1.85: 6-phospho-β-galactosidase) showed lower abundance in individuals with a higher MedDiet index (Fig. 4b), consistent with low dairy food consumption being a key feature of the MedDiet22 (Extended Data Fig. 1b).
Figure 4: The Mediterranean diet is associated with microbial processes involved in plant polysaccharide degradation and short-chain fatty acid production.
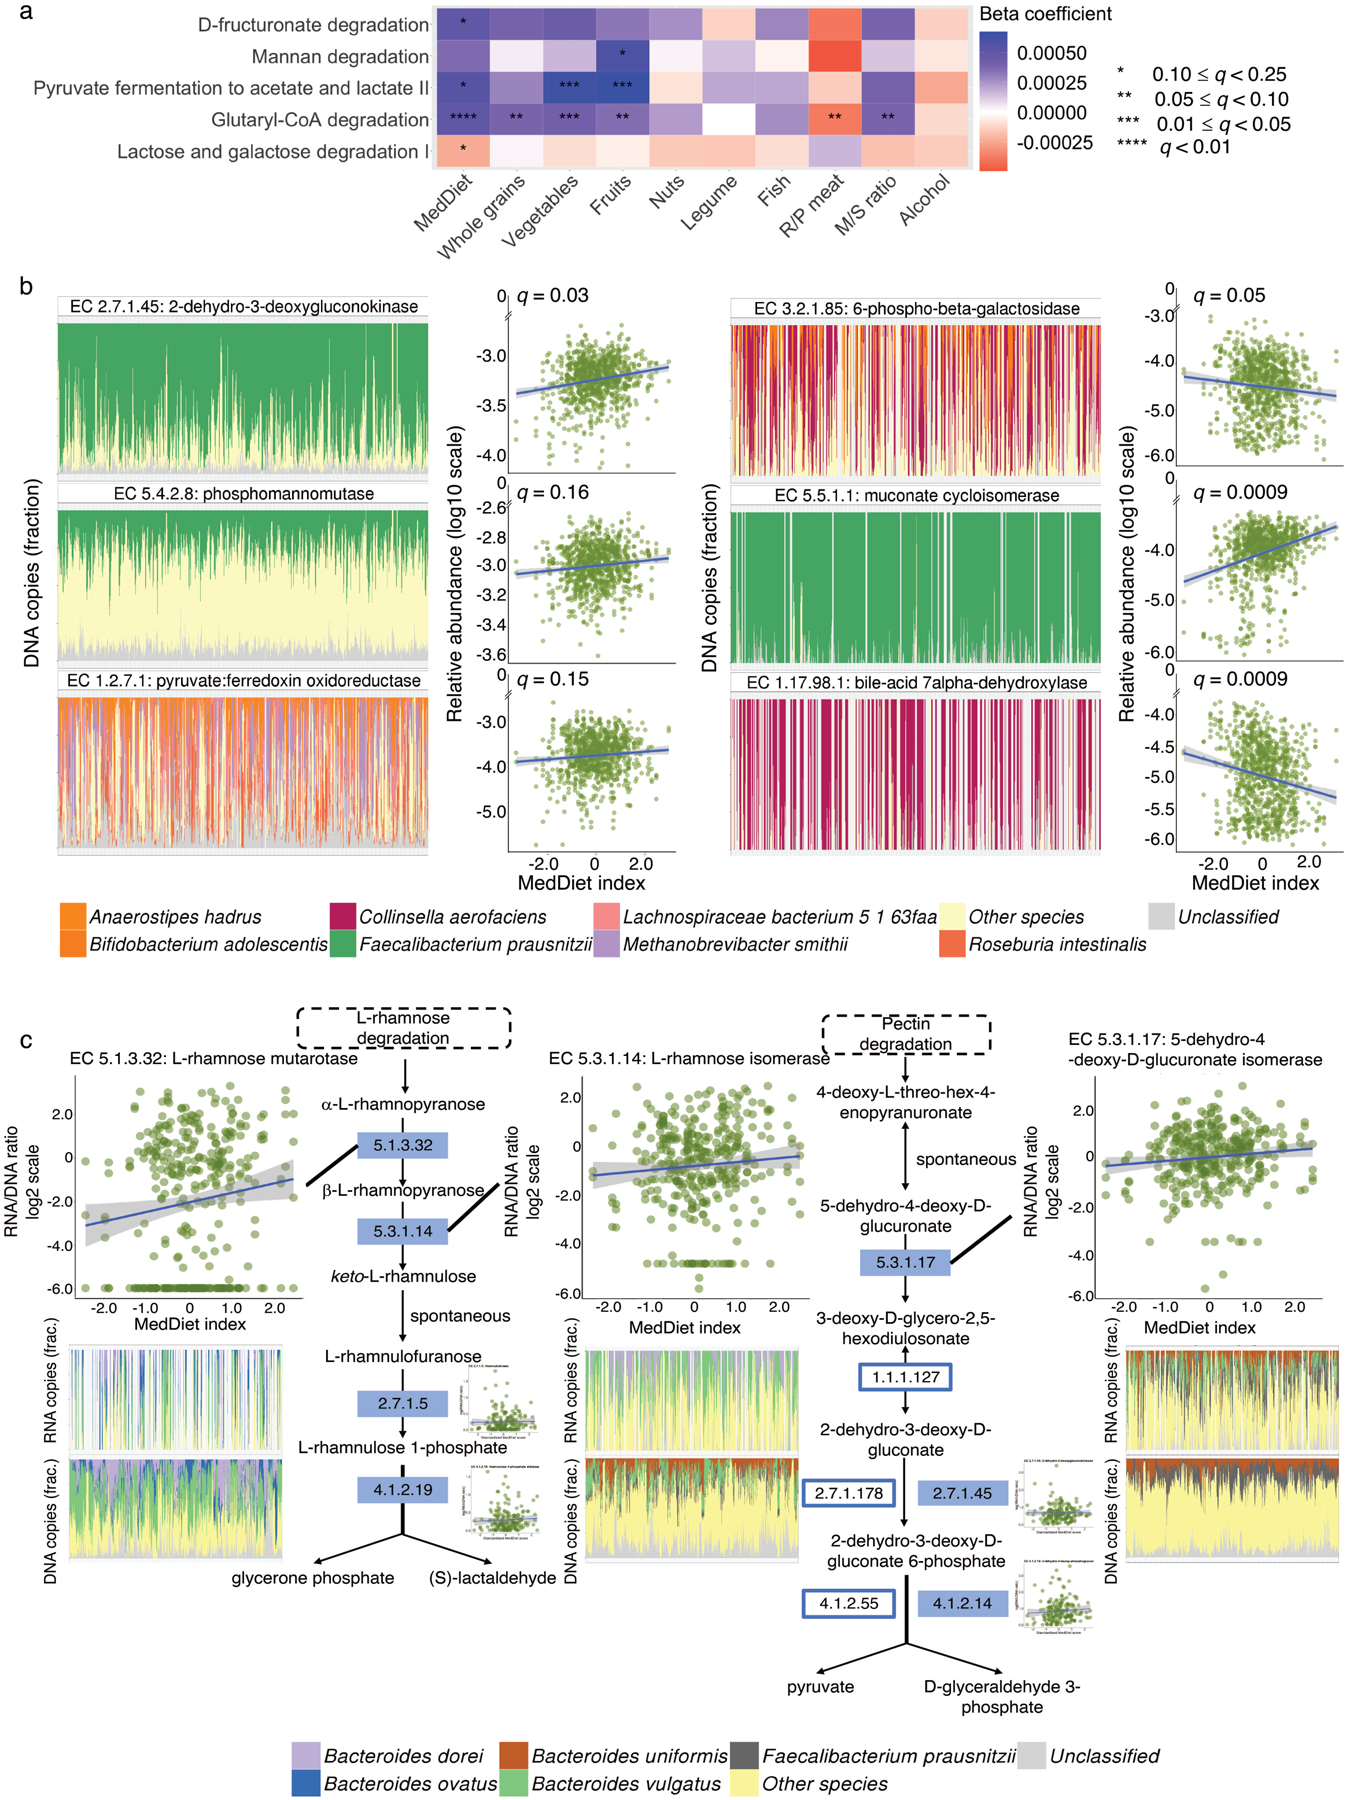
(a) Associations of the Mediterranean diet (MedDiet) and its constituent foods and nutrients with microbial functions (as MetaCyc pathways) involved in plant-derived polysaccharide degradation, short-chain fatty acid (SCFA) production, and lactose degradation. Beta coefficients are derived from multivariable-adjusted linear mixed models (Methods) that include the MedDiet index or a dietary factor as independent variable and abundance of microbial pathway as dependent variable (exact q-values in Source Data). (b) A subset of associations of the MedDiet with enzymes (as Enzyme Commission numbers) encoded in microbial genomes that are involved in plant-derived polysaccharide degradation, SCFA production, lignin degradation, secondary bile acid production, and lactose degradation (full results in Supplementary Table 6). Q-values (false discovery rate adjusted p-value) in (a) and (b) were derived from multivariable-adjusted linear mixed models, with multiple comparison adjustment using the Benjamini-Hochberg method with a target rate of 0.25 (Methods). Analyses in (a) and (b) use all 925 metagenomes. (c) Associations of the MedDiet with the transcription of enzymes within the pathways of L-rhamnose and pectin degradation, using 340 metatranscriptome and metagenome pairs from 96 participants. The plots in (c) are schematic representations of several pathways containing key enzymes for L-rhamnose and pectin degradation. Solid rectangles indicate those quantified from both metagenomes and metatranscriptomes. We used Enzyme Commission numbers in the rectangles to represent these enzymes. The scatter plots in (b) and (c) show the associations of the MedDiet index with relative abundance or transcription levels of microbial enzymes. The bar plots in (b) and (c) show the microbial species with the greatest contributions to each microbial enzyme, with metagenomic or metatranscriptomic samples along the X axes ordered by the MedDiet index (from the lowest to the highest). All the statistical tests were two-sided.
As above, long-term adherence to the MedDiet was generally associated with more substantial shifts in metagenomic functions than in metatranscriptomic responses, concordant with the latter typically regulating more short-term effects. Thus only a few microbial enzymes (n=46) were differentially transcribed relative to their genomic abundances with varying degrees of adherence to the MedDiet (Extended Data Fig. 7). This is also possibly attributable to decreased power, given our smaller subset of metatranscriptomic profiles. Nevertheless, MedDiet diet was associated with the transcription of several additional enzymes involved in the degradation of pectin (Fig. 4c). The positive associations were largely driven by the strong associations of higher intake of fruits, major food sources of pectin, with higher expression levels of the enzymes (Supplementary Table 6). Consistent with prior reports that dietary pectin was degraded by coordinated enzymic activities in Bacteroides spp.47, the pectinolytic enzymes were mainly encoded and transcribed by B. dorei, B. ovatus, B. uniformis, and B. vulgatus. with similar species compositions between metagenomes and metatranscriptomes. F. prausnitzii was also among the major contributors to the DNA profiles of L-rhamnose isomerase (EC 5.3.1.14) and 5-dehydro-4-deoxy-D-glucuronate isomerase (EC 5.3.1.17), but this species, compared to the Bacteroides spp., was less active in transcribing the two enzymes.
Prevotella copri carriage modulates the protective association of a Mediterranean diet with cardiometabolic health
To evaluate each participant’s cardiometabolic disease risk, we derived a composite score that summarized levels of biomarkers of three well-established mechanisms underlying the pathogenesis of CVD and T2D: dyslipidemia, hyperglycemia, and inflammation. In a prospectively designed case-control study of 396 myocardial infarction (MI) cases and 843 controls from the HPFS (10 years of follow-up; Methods), we showed significant and strong associations of all the biomarkers with the risk of incident MI, a clinical endpoint of CVD (Supplementary Table 7). We first categorized participants into quintiles of each blood biomarker level, ranking HbA1c and plasma levels of total cholesterol, triglyceride, and hs-CRP from lowest to highest with scores from 1 to 5. For HDL-C (“good” cholesterol), we reversed the scoring. A cardiometabolic disease risk score was then calculated by summing up these components, with a higher score indicating a higher risk of cardiometabolic disease. As expected, the cardiometabolic disease risk score was a strong predictor of incident MI in the case-control study described above. Participants in the highest quintile of the score had more than four times the risk of incident MI compared to those in the lowest quintile [risk ratio (RR) =4.05, 95% confidence interval (CI), 2.51–6.52, p trend = 9.3*10−9; Supplementary Table 7] during 10 years of follow-up. In addition, the adherence to the MedDiet was inversely associated with the cardiometabolic disease risk score as expected (p trend =0.04; Fig. 5a and Extended Data Fig. 8).
Figure 5: Prevotella copri carriage modulates the protective association of a Mediterranean diet with cardiometabolic disease risk.
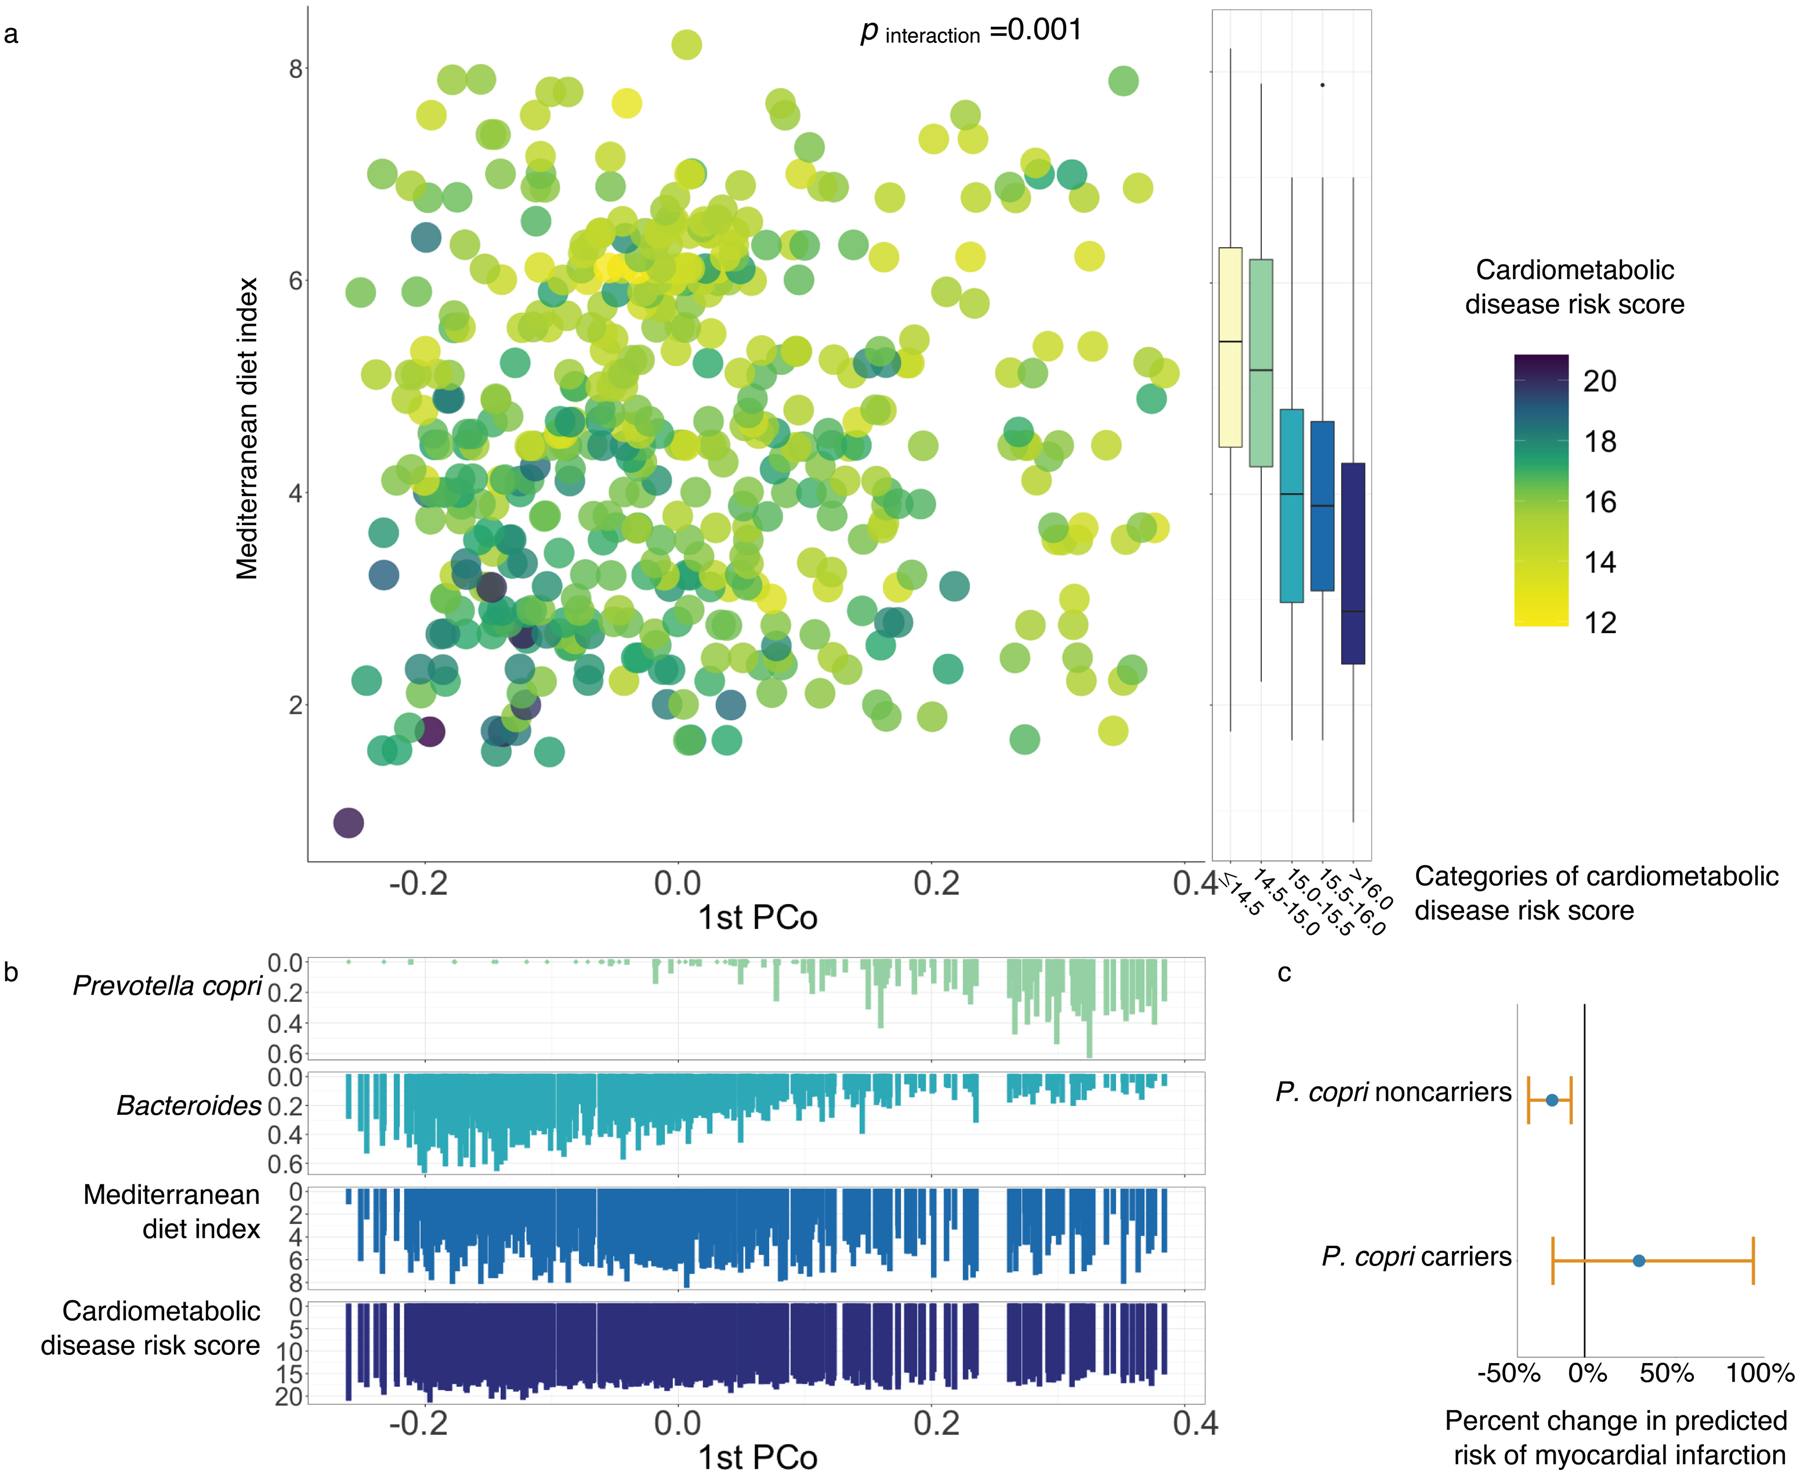
(a) The interaction between the Mediterranean diet (MedDiet) adherence and the first principal coordinates axis (PCo1) in relation to the score of cardiometabolic disease risk. The interactions between the MedDiet index and both PCo1 score and P. copri carriage (above 20th percentile) are significant (p for interaction =0.001 and 0.046, respectively). P for interaction was calculated from multivariable-adjusted linear mixed models (Methods). We performed two-sided likelihood ratio tests by comparing models with and without an interaction term to calculate p-values for interaction (degree of freedom =1, Methods). The score of cardiometabolic disease risk was derived based on biomarkers of lipid metabolism, including total cholesterol, high-density lipoprotein cholesterol, and triglyceride, glucose homeostasis, i.e., hemoglobin A1c, and inflammation, i.e., high-sensitive C-reactive protein. This analysis was based on 468 blood samples from 304 participants. Box plot centers show medians of the MedDiet index with boxes indicating their inter-quartile ranges (IQRs); upper and lower whiskers indicate 1.5 times the IQR from above the upper quartile and below the lower quartile, respectively. (b) Distributions of P. copri, Bacteroides, the MedDiet index and cardiometabolic disease risk score against PCo1 score. (c) Associations between the MedDiet adherence and the risk of myocardial infarction (MI) in P. copri noncarriers and carriers. The dots in the plot indicate percent changes in predicted risks of MI associated with a 4-unit increment in the MedDiet index, with error bars indicating upper and lower limits of their 95% confidence intervals. This analysis was based on 304 participants who donated 468 blood samples in the current study and an additional prospectively designed case-control study in 396 MI cases and 843 controls from the Health Professionals Follow-Up Study (Methods).
We then followed a statistical framework for testing interaction/effect modification widely used in population-based studies48,49 to examine whether the known association between the MedDiet and cardiometabolic disease risk differs in individuals with different gut microbial profiles. We initially carried out hypothesis generation by summarizing overall gut community structure using principal component loading scores and testing their potential interactions with the MedDiet index in a linear mixed model with the cardiometabolic disease risk score as outcome. We found that the inverse association of the MedDiet index with the cardiometabolic disease risk was more pronounced in participants with a lower PCo1, weaker in participants with a higher PCo1 (p interaction=0.001, Fig. 5a and Supplementary Table 8). Upon investigating this result more specifically, PCo1 loading was accounted for predominantly by P. copri abundance (Spearman correlation between PCo1 loading and P. copri abundance =0.61, Fig. 5b), and the interaction between MedDiet index and the carriage of P. copri in particular was independently significant (p for interaction =0.046), whereas we did not find significant interactions between the MedDiet index and other highly abundant species (Extended Data Fig. 9). Since P. copri is known to have distinct subspecies genetic architectures, primarily in non-Westernized populations33,34, we next tested whether this was a potential contributor to its interaction with the MedDiet index in our study population. Notably, since this population consists uniformly of adult white males, we would expect a preponderance of P. copri Clade A (in addition to more subtle between-subject strain variability). Based on a comparison of pangenome carriage between P. copri in this study population and that from controls in the Integrative Human Microbiome Project (Methods)50, both consisted entirely of Clade A as expected (Supplementary Fig. 2)33.
Notably, we found similar patterns of interactions between the MedDiet index and P. copri abundance in relation to several individual cardiometabolic biomarkers as well (Extended Data Fig. 10, p for interaction =0.03 for hs-CRP, 0.02 for total cholesterol, 0.25 for triglyceride, 0.009 for HbA1c, and 0.69 for HDL-C). To understand the clinical relevance of our findings, we quantified the predicted risk of MI associated with the MedDiet index in P. copri carriers vs. noncarriers by combining the association of the MedDiet index with the cardiometabolic disease risk score with the RR of MI associated with the cardiometabolic disease risk score estimated from the prospective case-control study of MI (Methods). A 4-unit increment in the MedDiet index was associated with a 18% lower risk of MI (RR =0.82, 95% CI, 0.69–0.95, p =0.02) in P. copri noncarriers, but a non-significant 30% increase in MI risk (RR =1.30, 95% CI: 0.83–2.07, p =0.26) in P. copri carriers (Fig. 5c). This finding provides evidence that gut microbial functions and taxa may not only respond to dietary intake, but specifically interact with it to modulate resilience to diet-induced cardiometabolic disease risk, supporting the promise of tailoring dietary interventions on the basis of individualized nature of gut microbiome to achieve more effective prevention of cardiometabolic disease.
Discussion
Here, we demonstrate that long-term adherence to a healthy Mediterranean-style dietary pattern was associated with small but significant effects on the overall gut microbiome profiles, composed of phylogenetically diverse organisms carrying pathways including plant-derived polysaccharide degradation, SCFA production, and secondary bile acid production. Several major dietary fiber metabolizers, such as F. prausnitzii and B. cellulosilyticus, as well as their functions that break down specific dietary fibers (particularly pectin), were enriched in the gut microbiomes of participants with greater adherence to the MedDiet. Our study also linked high MedDiet adherence (particularly in association with low red / processed meat intake) to the depletions of several niche- and subject-specific biochemical specialists such as C. leptum and C. aerofaciens, and functions including secondary bile acid biosynthesis. Notably, our study identified a significant interaction between a healthy dietary pattern and the gut microbiome in relation to the cardiometabolic disease risk. A particularly strong protective association between the MedDiet and risk of cardiometabolic disease among a subgroup of the participants could be explained by the absence of P. copri in their gut microbiomes. This finding supports the premise that dietary interventions or recommendations for cardiometabolic disease prevention could be tailored to an individual’s microbial profile. Future prevention approaches, for example, might emphasize healthy eating for individuals lacking substantial P. copri carriage, while physical activity or pharmaceuticals (e.g., statins) may be more effective for P. copri carriers.
Although it is not possible to determine whether the MedDiet causally selected for gut microbial features from this observational study, our data indirectly permit fairly specific speculation and hypothesis generation. For example, our findings support that the MedDiet plays a role in regulating conversion of primary to secondary bile acids39,51 and bile acid pool composition through negative selection of taxa including C. aerofaciens. Given the hormone-like functions of bile acids through activation of nuclear and G protein-coupled receptors, a dysregulated bile acid pool can lead to perturbations in multiple pathological processes underlying cardiometabolic disease such as lipoprotein metabolism and glucose homeostasis52. In addition, we find that high pectin content, particularly fruit-derived, may partially explain the MedDiet’s role in shaping gut microbial function53, as indicated by the enrichment of pathways for pectin degradation and transcription of pectinolytic enzymes in individuals with greater MedDiet adherence. The broadly microbiome-produced and immunomodulatory SCFAs are a prominent end-product of pectin fermentation43,54.
Importantly, the study also sheds important light on the emerging, unique role of Prevotella spp. in the human gut, particularly the ability of MedDiet to mitigate cardiometabolic disease risk in the absence of P. copri. P. copri has been of particular interest in the human gut microbiome for several reasons. First, P. copri is among the only discrete gut community “enterotypes” consistently identified in the human population55. Second, P. copri may either confer health benefits or associate with disease risk in different populations9,56. Related to our findings, the causal association of P. copri with upregulated biosynthesis of branched-chain amino acids in the gut and subsequent host insulin resistance identified by Pedersen et al6 may partially explain the null association of the MedDiet adherence with the risk of cardiometabolic disease in P. copri carriers, since they have already developed insulin resistance and are less sensitive to a healthy diet pattern. Third, P. copri possesses a unique global distribution of subspecies with different clades identified primarily by ethnogeographic backgrounds33 and each clade carrying distinct enzymes for degradation of dietary fiber and amino acids33,34. It is not clear whether the interaction between diet and P. copri carriage was caused by the microbe itself, for example due to an enhanced capacity for polysaccharide fermentation9. Alternatively, it could be attributable to jointly causal external dietary factors (e.g., an unhealthy dietary pattern that might simultaneously increase cardiometabolic disease risk and select for P. copri) or possibly completely independent factors (e.g., populations with culturally reduced cardiometabolic risk and P. copri exposure). Furthermore, because of the observational nature of our study, we cannot distinguish between two alternative hypotheses: in individuals who do not carry P. copri, the gut microbiome may metabolize components of the MedDiet more efficiently and effectively, leading to higher yields of cardioprotective chemical products; or individuals who adhere to the MedDiet are less likely to acquire or retain P. copri, which is then itself independently cardioprotective.
Notably, our analysis did not identify a significant association between the MedDiet and the abundance or carriage of P. copri, only the interaction between diet and P. copri carriage with cardiometabolic disease risk. This is concordant with, for example, pre-existing P. copri carriage (not necessarily itself influenced by recent diet) changing the metabolites produced in the gut from components of the MedDiet, which may in turn have cardioprotective roles. Simple carriage of P. copri in the gut microbiome has, on the other hand, been identified as enriched during adherence to a traditional Asian diet35, and its presence and exact genetic composition varies widely around the globe with respect to geographic origins and lifestyles33. Other subclades of P. copri may thus not interact with components of the MedDiet as do those in this population’s Clade A, for example, and there may be additional sub-clade genetic variation in enzymatic potential for polysaccharide degradation that further modifies this behavior within individuals33,34. Importantly, our finding of the interaction between a dietary pattern and P. copri has the potential to explain conflicting prior results regarding its ability to improve glucose homeostasis6,9,56 and inflammation status57, since these properties now appear to be diet-dependent6.
Nevertheless, we again stress that this study is observational in nature, a limitation shared by many such molecular epidemiological investigations. As with similar microbiome epidemiology profiles, even though we adjusted for many potential confounders in our statistical models, we were unable to assess covariates such as specific prebiotic usage, and even when these covariates are included most inter-individual variation in microbiome remains unaccounted for16,21,58. Additionally, our study focused on biomarkers of cardiometabolic disease rather than “hard” clinical endpoints of type 2 diabetes and cardiovascular disease, which might limit the directly translational potential of our findings, although these biomarkers are among the best available predictors of the diseases and sometimes included in diagnosis criteria (e.g. HbA1c). Our study also provided empirical data to show the strong predictive ability of these biomarkers for incident myocardial infarction and the translational potential of these findings. Even if the resulting microbial biomarkers are not used directly in the clinic, however, they provide valuable insights into the mechanisms underlying host-microbiome interaction and disease severity and progression.
These limitations could be addressed by following this work with a combination of “top down” human interventional studies and “bottom up” model system experiments. The former could assess both changes in the risk of cardiometabolic disease in subjects with diverse baseline microbiomes (with and without P. copri) after a MedDiet intervention, as well as microbiome changes after such an intervention. The latter could include perturbing multiple different subtypes of P. copri in culture with alternate plant-derived polysaccharide sources (e.g., pectin, cellulose, lignin, resistant vs. regular starches vs. monosaccharides) to assess growth or metabolism or doing the same in monocolonized or humanized gnotobiotic mice. Together, such work would characterize both the specific microbial biochemistry responsible for P. copri-linked MedDiet cardiometabolic risk, and its in vivo health relevance. Furthermore, it is likely that this diet-microbe-phenotype interaction is only one instance of a pattern that may recur between many microbial functions, dietary elements, and health outcomes, enabling a clearer overall paradigm for personalized microbially-mediated health maintenance and, eventually, disease therapy.
Methods
Study population and stool sample collection
The Men’s Lifestyle Validation Study (MLVS) consisted of 914 men aged 45 to 80 years and free from coronary heart disease, stroke, cancer, or major neurological disease at recruitment in 2011. The MLVS study population was randomly sampled from the Health Professionals Follow-up Study (HPFS), an ongoing prospective cohort study of 51,529 US male health professionals initiated in 1986 (https://sites.sph.harvard.edu/hpfs/). From 2011 to 2013, 307 participants provided up to two pairs of self-collected stool samples in the MLVS. Each pair of stool samples were collected from two consecutive bowel movements 24–72 hours apart. The second pair of samples was collected approximately six months after the first collection. Details on stool sample collection and immediate ex-situ conservation of metagenomic and metatranscriptomic components, laboratory handling, and paired-end shotgun sequencing of RNA and DNA can be found in our previous publications28,59,60. Briefly, each participant placed each bowel movement into a container with RNAlater and completed a questionnaire detailing the date and time of evacuation and other relevant exposures. The study participants classified the form of their bowel movements according to the Bristol stool scale at time of fecal sample collection. The stool samples were shipped overnight to the sequencing center at the Broad Institute of MIT and Harvard and stored in −80 °C freezers until nucleic acid extraction. Metagenomes and metatranscriptomes were obtained by using Illumina HiSeq paired-end (2 × 101 nucleotides) shotgun sequencing platform. DNA was extracted from all 929 resulting samples, in addition to RNA from a subset of 372 samples spanning 96 participants who provided samples during both sampling periods and did not report the use of antibiotics within the past year. Our study included data from 307 participants in the analysis on diet and gut microbiome. Among 307 participants, 152, 14, 134 and 7 participants provided four, three, two and one stool samples, respectively. Additional details on study design can be found in the Life Sciences Reporting Summary. The study protocol was approved by the Institutional Review Boards of the Brigham and Women’s Hospital and the Harvard T.H. Chan School of Public Health (IRB protocol number: HSPH 22067-102). The MLVS obtained written informed consent from all participants.
Dietary assessment and covariate measurement
In the HPFS, dietary information was collected at baseline of 1986 and updated every 4 years thereafter with validated semi-quantitative food frequency questionnaires (SFFQs) developed by Willett et al61. From 2011 to 2013, two FFQs were each administered three months before and after the biospecimen collection in the MLVS. Among 307 study participants, 271 and 35 individuals provided nine and eight SFFQs, respectively. Only one participant provided five SFFQs (Table S1). Participants reported their usual dietary intake (from never to ≥6 times per day) of a standard portion size (e.g., 0.5 cup of strawberries, 1 banana and 0.5 cup of cooked spinach) during the preceding one year on each SFFQ. Frequencies and portions of each individual food item were converted to average daily intake for each participant. The reproducibility and validity of these SFFQs in measuring dietary intake have been documented in detail61–63. Nutrient values were calculated based on the Harvard University Food Composition Database, which is updated every 4 years (https://regepi.bwh.harvard.edu/health/nutrition/). We calculated average daily nutrient and total energy intakes by multiplying the frequency of consumption of each item by its nutrient content and summing across all foods. For this analysis, we calculated cumulative average dietary intake for each participant by summing up the intake levels from all available FFQs and then dividing the sum by the number of FFQs. We applied a validated standard questionnaire64 to collect detailed information on physical activity level, and a questionnaire inquiring each participant’s medication use in the past year. Smoking status and prebiotic use were also self-reported by the participants.
Measurement of adherence to a Mediterranean dietary pattern
We applied a Mediterranean diet (MedDiet) index to measure the degree of adherence to the traditional dietary pattern consumed in the Mediterranean region. The MedDiet index was created based on the Mediterranean diet pyramid that captures food patterns typical of Crete, much of the rest of Greece, and southern Italy in the early 1960s, where adult life expectancy was among the highest in the world and rates of coronary heart disease, certain cancers, and other diet-related chronic diseases were among the lowest22.The MedDiet index was initially developed by Willett et al.22 and Trichopoulou et al.65 and then modified by Fung et al.31. The index was based on the intake of 9 items: vegetables, legumes, fruit, nuts, whole grains, red/processed meat, fish, alcohol, and the ratio of monounsaturated to saturated fat. For beneficial components (vegetables, legumes, fruit, nuts, whole grains, fish, and the ratio of monounsaturated to saturated fat), individuals whose consumption was below the median were assigned a value of 0, and those whose consumption was at or above the median were assigned a value of 1. For red/processed meat intake, participants whose consumption was below the median were assigned a value of 1, and those whose consumption was at or above the median were assigned a value of 0. For alcohol consumption, a value of 1 was assigned to men who consumed between 10 and 25 g per day per day, and those whose consumption was in other ranges were assigned a value of 0. The MedDiet index opted to use the ratio of monounsaturated to saturated fat, rather than polyunsaturated to saturated fat ratio, to measure quality of fat intake because monounsaturated fats, primarily from olive oils, are consumed in much higher quantities than polyunsaturated fats (major sources include soybean and canola oils) in Mediterranean region. The total MedDiet index ranged from 0 (minimal adherence) to 9 (perfect adherence).
Taxonomic and functional profiling of metagenomic and metatranscriptomic samples
Taxonomic and functional profiles were generated by applying the bioBakery meta’omics workflow66. All the microbiome measurements were taken from distinct stool samples. Sequence reads were passed through the KneadData 0.3 quality control pipeline (http://huttenhower.sph.harvard.edu/kneaddata) with default parameters to filter out low-quality read bases and reads of human origin. Taxonomic profiling was performed using MetaPhlAn 2.6.029 (http://huttenhower.sph.harvard.edu/metaphlan). MetaPhlAn classifies metagenomic reads to taxa and yields their relative abundances in each sample based on approximately 1 M clade-specific marker genes derived from 17,000 microbial genomes (corresponding to >7,500 bacterial, viral, archaeal, and eukaryotic species).
We performed functional profiling for both metagenomes and metatranscriptomes by applying HUMAnN 2.8.030 (http://huttenhower.sph.harvard.edu/humann). Briefly, for each sample, taxonomic profiling is used to identify detectable organisms. Reads are recruited to sample-specific pangenomes including all gene families in any detected microbes using Bowtie267. Unmapped reads are aligned against UniRef9068 using DIAMOND translated search69. Hits are counted per gene family and normalized for length and alignment quality. For calculating abundances from reads that map to more than one reference sequence, search hits are weighted by significance (alignment quality, gene length, and gene coverage). UniRef90 abundances from both the nucleotide and protein levels were then i) mapped to level 4 Enzyme Commission nomenclature and ii) combined into structured pathways from MetaCyc70. We used the MinPath71 and gap filling options in HUMAnN 2.8.0. More details about functional profiling in the MLVS can be found in our previous publications28,60.
Blood sample collection and cardiometabolic disease biomarker measurements
MLVS participants donated fasting blood samples twice, six months apart, during the same period as fecal samples collection. The blood samples were collected by nursing practitioners at a clinical laboratory. Participants were cannulated in the forearm (antecubital vein) to collect a blood sample after fasting for 12 hours. The first blood collection was 30 mL consisting of three 10 mL Heparin tubes, and the second blood collection was 40 mL consisting of four 10 mL Heparin blood tubes. For each blood sample, information on fasting status, blood collection time and date, smoking status, physical activity, and body weight, was recorded. After collection, blood samples were placed on ice packs, stored in Styrofoam containers, returned to the laboratory via overnight courier, and centrifuged and aliquoted for storage in liquid nitrogen freezers (−130°C or colder). Hemoglobin A1c was measured by turbidimetric immunoinhibition using packed red cells (Roche Diagnostics), which is a standard approved by the US National Glycohemoglobin Standardization Program and FDA for clinical use. High-sensitive C-reactive protein concentrations were determined in plasma using an immunoturbidimetric high sensitivity assay using reagents and calibrators from Denka Seiken (Niigata, Japan) with assay day-to-day variability between 1 and 2%. Total and high-density lipoprotein cholesterol, and triglycerides were measured using standard methods with reagents from Roche Diagnostics (Indianapolis, IN) and Genzyme (Cambridge, MA). Our study included 304 participants in the analysis that includes blood biomarkers. Among 304 participants, 164 and 140 participants provided two and one blood samples, respectively. All the biomarker measurements were taken from distinct blood samples.
Nested Case-Control Study of Myocardial Infarction
We conducted a prospectively designed nested case-control study in 396 myocardial infarction (MI) cases and 843 healthy controls from the HPFS to quantify the associations of the cardiometabolic disease risk score and individual plasma biomarkers with the risk of MI. Between 1993 and 1995, 18,225 participants in the HPFS donated blood samples. Blood samples were collected in EDTA tubes, placed on ice packs, stored in Styrofoam containers, returned to the laboratory via overnight courier, and centrifuged and aliquoted for storage in liquid nitrogen freezers (−130°C or colder). Participants who provided blood samples were similar to those who did not, albeit somewhat younger. Both this case-control study and the gut microbiome study in the MLVS recruited subpopulations of the HPFS. The two studies were largely independent: among the healthy controls of the nested case-control study, 11 were also participants in the MLVS.
We identified participants with incident nonfatal MI or fatal coronary heart disease (CHD) between the date of blood draw and the return of the 2004 questionnaire (10 years of follow-up). Using risk-set sampling, we randomly selected controls in a roughly 2:1 ratio who were matched for age, smoking status, and date of blood sampling from the subgroup of participants who were free of cardiovascular disease at the time of diagnosis in the cases. MI was confirmed by study physicians blinded to participant’s exposure status if it met the World Health Organization’s criteria (symptoms plus either diagnostic electrocardiographic changes or elevated levels of cardiac enzymes). Deaths were identified from state vital records and the National Death Index or reported by the participant’s next of kin or the postal system. Fatal CHD was confirmed by hospital records or on autopsy, or if CHD was listed as the cause of death on the death certificate, if it was the underlying and most plausible cause, and if evidence of previous CHD was available. We used the same tools and methods to collect lifestyle and dietary information and similar methods to measure blood cardiometabolic disease biomarkers as we described above.
Statistical analysis
Using the raw functional profiling abundances calculated for metagenomes and metatranscriptomes above, we quantified functional activity of gut microbial transcripts by calculating RNA/DNA ratio of microbial enzymes, which provides an index of over/under-transcription (relative to DNA copy number) within each individual microbiome sample30. Pathways and enzymes that had <1 RPK (reads per kilobase) of either RNA or DNA were treated as not detected in this calculation. To determine variability in the relative abundance of taxonomy, functional potential (DNA enzyme) and functional activity (RNA/DNA ratio), we calculated the Bray-Curtis (BC) dissimilarity metric for each sample. We applied permutational multivariate analysis of variance (PERMANOVA) to quantify percentage of variance in each data type of microbial communities explained by dietary variables, plasma biomarkers and covariables based on the BC dissimilarity metric using adonis function in the R package vegan 2.5–6. All the p-values from the PERMANOVA and corrected for multiple comparisons using the Benjamini-Hochberg procedure. All the PERMANOVA tests were two-sided with degree of freedom of 1.
For per-feature tests, we first performed quality control filtering for taxonomic and functional features before including them in the subsequent analyses. To be qualified for downstream analyses, a taxonomic feature or a pathway needed to be detected at a minimum relative abundance of 0.01% in at least 10% of samples. Similarly, we filtered all enzyme commissions with a relative abundance less than 0.001% in greater than 10% of all samples. This analysis yielded 139 microbial species that met the criteria. In addition to the filters of minimum abundance and prevalence, functional features with high correlations with others were removed by taking the most abundant feature from each such cluster as its representative. We employed the R package MaAsLin 2 1.0.0 to perform per-feature tests7 (https://huttenhower.sph.harvard.edu/maaslin2). We log-transformed relative abundances of microbial features and standardized the dietary data into Z-scores of intake level before including them in the MaAsLin models. In the per-feature tests, unless otherwise noted, all high-dimensional tests were corrected for multiple hypothesis testing by controlling the false discovery rate (FDR) using the Benjamini-Hochberg method with a target rate of 0.25 for q values estimated from the per-feature tests.
We used linear mixed models for all association analyses, which provide a convenient way to account both for repeated measures (multiple time points per participant) and a small amount of missingness. These incorporated data measured from all available blood and fecal samples from each participant. All linear mixed models included identifiers of participants as random effects to account for within-subject correlation due to repeated sampling, plus dietary exposure variables and covariables as fixed effects. Specifically, with covariates as listed below, the model takes the form:
In such a model, the response for the ith subject at the jth measurement is assumed to differ from the population mean:
by a subject effect,bi, and a within-subject measurement error,∈ij.Furthermore, it is assumed that:
and that bi and ∈ij are mutually independent.
To test for a statistical interaction (i.e., effect modification) between the MedDiet index and gut microbiome with respect to cardiometabolic risk score (and MI, see below), we followed the standard statistical framework to test interaction between two exposures. This methodology is widely used in population-based studies, e.g. GWAS and other molecular epidemiology, that apply this approach to test effect modifications such as gene-environment and gene-gene interactions48,49. To test for a diet-microbiome interaction in cardiometabolic risk, we built up a linear mixed model that simultaneously includes the main effects of the MedDiet index and abundances of microbial species, as well as the product term of the two main effects, in addition to confounding variables (fixed effects) and per-subject random effects. When used with a potential interactor such as P. copri abundance, this becomes:
We then tested the significance level of the beta coefficient of the product term (β4 in this example) using a two-sided likelihood ratio test by comparing models with and without an interaction term to calculate p for interaction (degree of freedom =1). A significant p-value of the product term can be interpreted as a significant interaction between diet and gut microbiome, referred to as a modification. In addition, we performed stratified analysis to quantify the associations of the MedDiet index with the cardiometabolic disease risk score and biomarker levels in subgroups defined by different levels of PCo loadings and microbe abundances separately. The linear mixed models included participant’s identifier as random effects and simultaneously adjusting for total energy intake, age, physical activity level, smoking, probiotics use, Bristol stool scale, and uses of antibiotics, proton pump inhibitors, aspirin, statins and metformin. To compare the genetic architecture of P. copri in this study population and that of controls from the Integrative Human Microbiome Project50, we first joined HUMAnN gene family profiles within P. copri from the two populations and then performed PCoA analysis of gene family dissimilarity (as quantified by the Bray-Curtis dissimilarity) using the R package vegan 2.5–6.
We quantified the associations of the cardiometabolic disease risk score and biomarkers with the risk of MI in the nested case-control study. We first categorized all the participants into quartiles of the cardiometabolic disease risk score and biomarker levels. We then applied logistic regression models to estimate odds ratios and their 95% confidence intervals (CIs) of MI comparing participants in each quartile to the lowest quartile. To quantify a linear trend, we assigned the median value of each quartile and modeled this variable continuously and calculated p for linear trend using the two-sided Wald test (degree of freedom =1). With risk-set sampling, the odds ratio derived from the logistic regression directly estimated the risk ratio (RR). We also calculated RRs and 95% CIs of MI associated with a 1-standard deviation (SD) increment in the cardiometabolic disease risk score and biomarker levels. For the cardiometabolic disease risk score, we additionally calculated RRs and 95% CIs of MI associated with a 1-unit increment in the score. All multivariable models were simultaneously adjusted for matching factors including age, smoking status, and month of blood sampling, family history of MI before the age of 60 years, alcohol intake, level of physical activity, and body mass index. The RRs of MI associated with a 4-unit increment in the MedDiet index were calculated by multiplying multivariable-adjusted changes in the cardiometabolic disease risk score associated with a 4-unit increment in the MedDiet index by the multivariable-adjusted RR of MI associated with 1-unit increment in the cardiometabolic disease risk score. The calculations were conducted in subgroups defined by P. copri carriage and non-carriage separately. To estimate the uncertainty of the RRs, we used Monte Carlo simulations to take 1000 draws from the distribution of changes in the MedDiet index and the RRs of the MI simultaneously, propagating the uncertainty in the dietary index and estimated biological effects (RRs) of the MedDiet index into the final estimates. All the statistical tests were two-sided.
Data availability statement
All the microbiome data are previously published28,60 and publicly available (https://www.nature.com/articles/s41564-017-0084-4#Sec22). All the meta data from the Health Professionals Follow-Up Study are available through a request for external collaboration and upon approvals of a letter of intent and a research proposal. Details for how to request an external collaboration with the Health Professionals Follow-Up Study can be found at https://sites.sph.harvard.edu/hpfs/for-collaborators/. Harvard University Food Composition Database is publicly available at https://regepi.bwh.harvard.edu/health/nutrition/. Figures 2–5, Extended Data Figures 1–10, Supplementary Tables 1 and 3–8, and Supplementary Figures 1 and 2 are associated with the microbiome and metadata.
Code availability statement
This study mainly relies on open source bioBakery tools, particularly MetaPhlAn 2, HUMAnN 2, and MaAsLin 2, available at https://huttenhower.sph.harvard.edu/tools/. The analysis-specific programs are available through http://huttenhower.sph.harvard.edu/meddiet2020.
Extended Data
Extended Data Figure 1: Mediterranean diet index and its individual components.
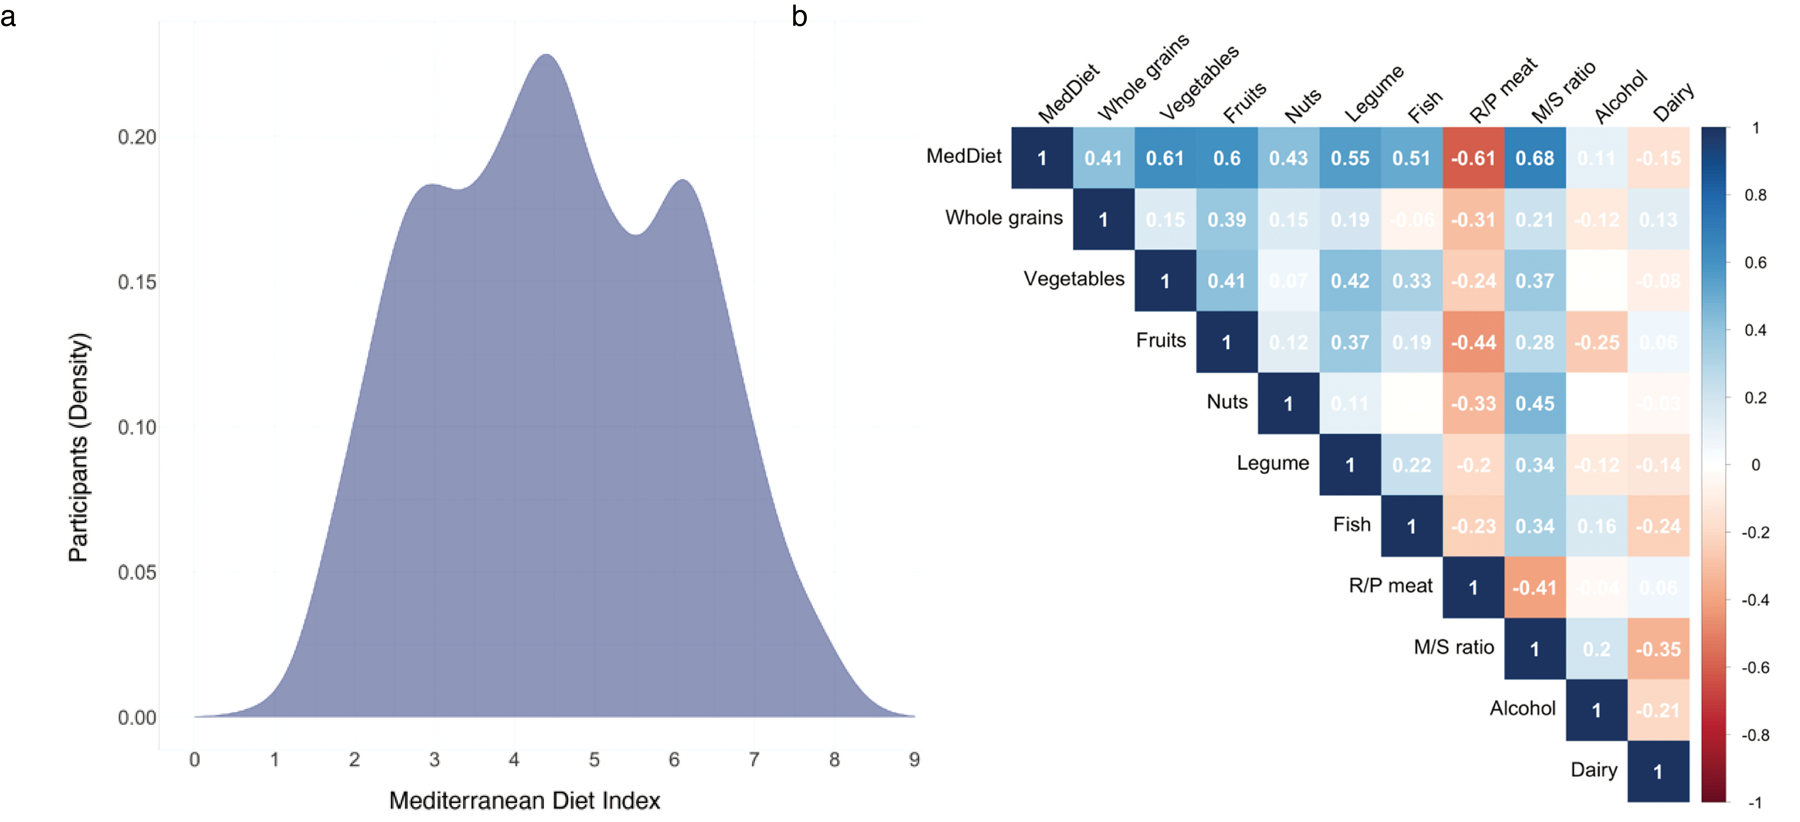
(a) Distribution of the Mediterranean diet (MedDiet) index in the study population. Each participant’s adherence to the MedDiet was evaluated by a 9-dimensional MedDiet index (Supplementary Table 2 and Methods) as previously described24,36,78. The total MedDiet index ranged from 0 (non-adherence) to 9 (perfect adherence). The index was based on the intakes of 9 items: vegetables, legumes, fruit, nuts, whole grains, red/processed meat (R/P meat), fish, alcohol, and the ratio of monounsaturated to saturated fat (M/S ratio). Participants who had a higher adherence to MedDiet consumed more beneficial components of the dietary pattern, including whole grains, vegetables, fruit, nuts, legumes, fish, monounsaturated fats (at the expense of saturated fats) and moderate alcohol drinking, but less red and processed meat, a detrimental component of the MedDiet index. (b) Correlations between the MedDiet index, its individual constituent food and nutrient contributors, and dairy food. Values in the figure are partial Spearman correlation coefficients with adjustment for total energy intake. As expected, the composite MedDiet score was positively correlated with “healthy” contributing factors, negatively correlated with “unhealthy” factors, and, importantly, not dominated by any one component.
Extended Data Figure 2: Principal coordinate analysis of species-level Bray-Curtis dissimilarity colored by the relative abundance of major taxonomic features.
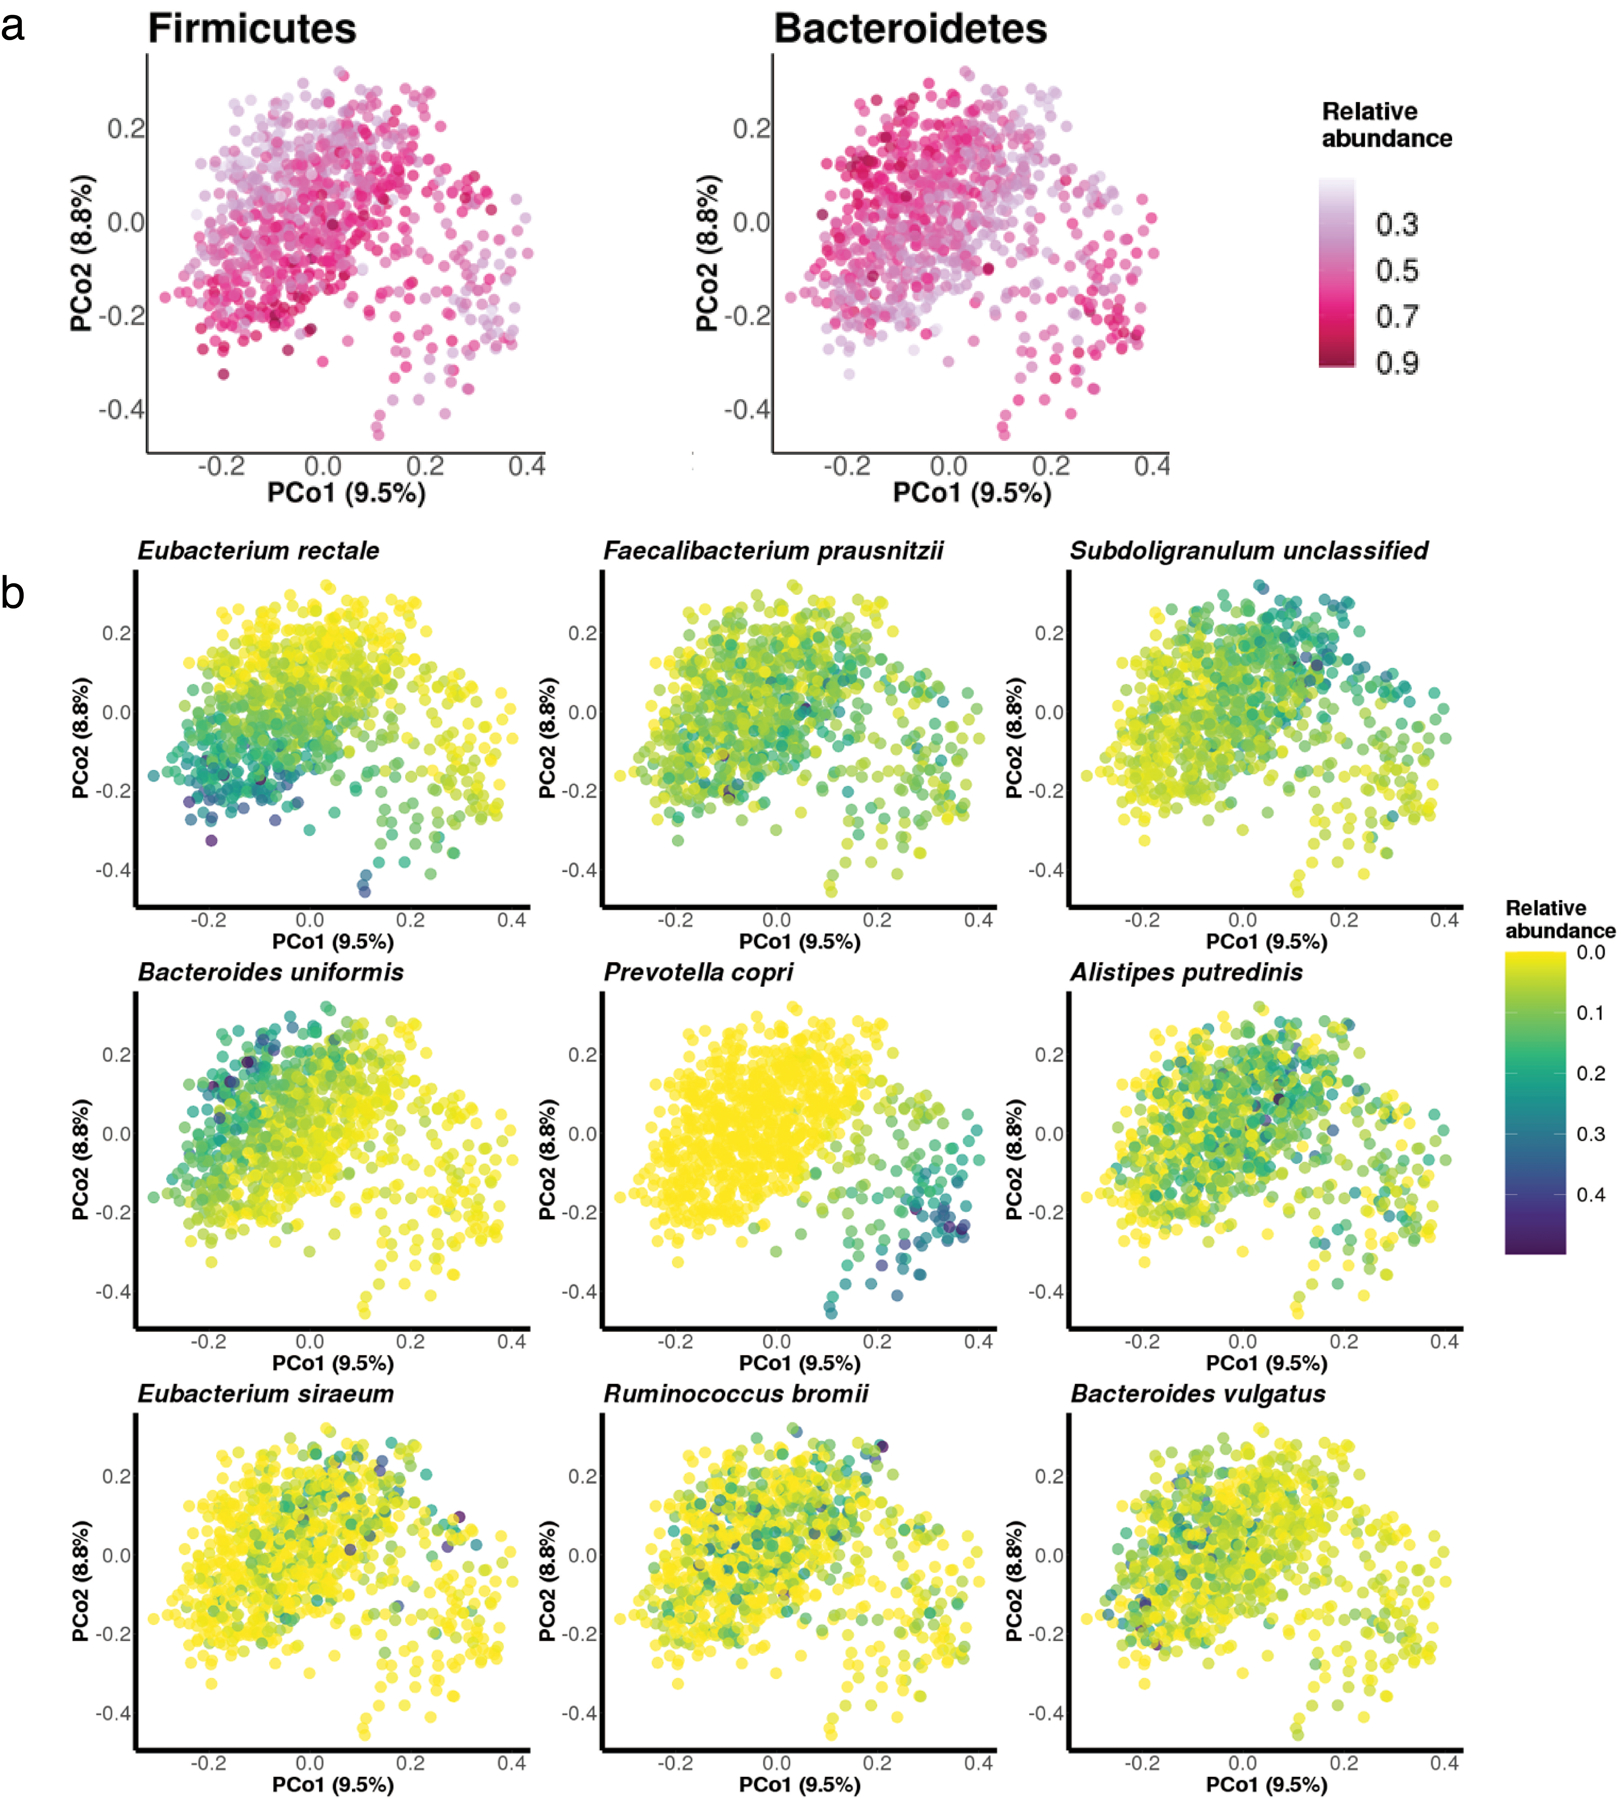
(a) Principal coordinate analysis of species-level Bray-Curtis dissimilarity colored in correspondence to the relative abundance of Bacteroidetes and Firmicutes phyla. As expected, a majority of variation in the species-level compositional structure of the gut microbiome was driven by a tradeoff between Bacteroidetes versus Firmicutes phyla. (b) Principal coordinate analysis of species-level Bray-Curtis dissimilarity colored in correspondence to the relative abundance of 9 most abundant species-level features. The most prominent patterns of gut microbial taxonomic variation in the population included tradeoffs between the abundances of Eubacterium rectale and Bacteroides uniformis vs. Subdoligranulum unclassified and P. copri.
Extended Data Figure 3: Association between the adherence to a Mediterranean dietary pattern and microbiome taxonomic diversity.
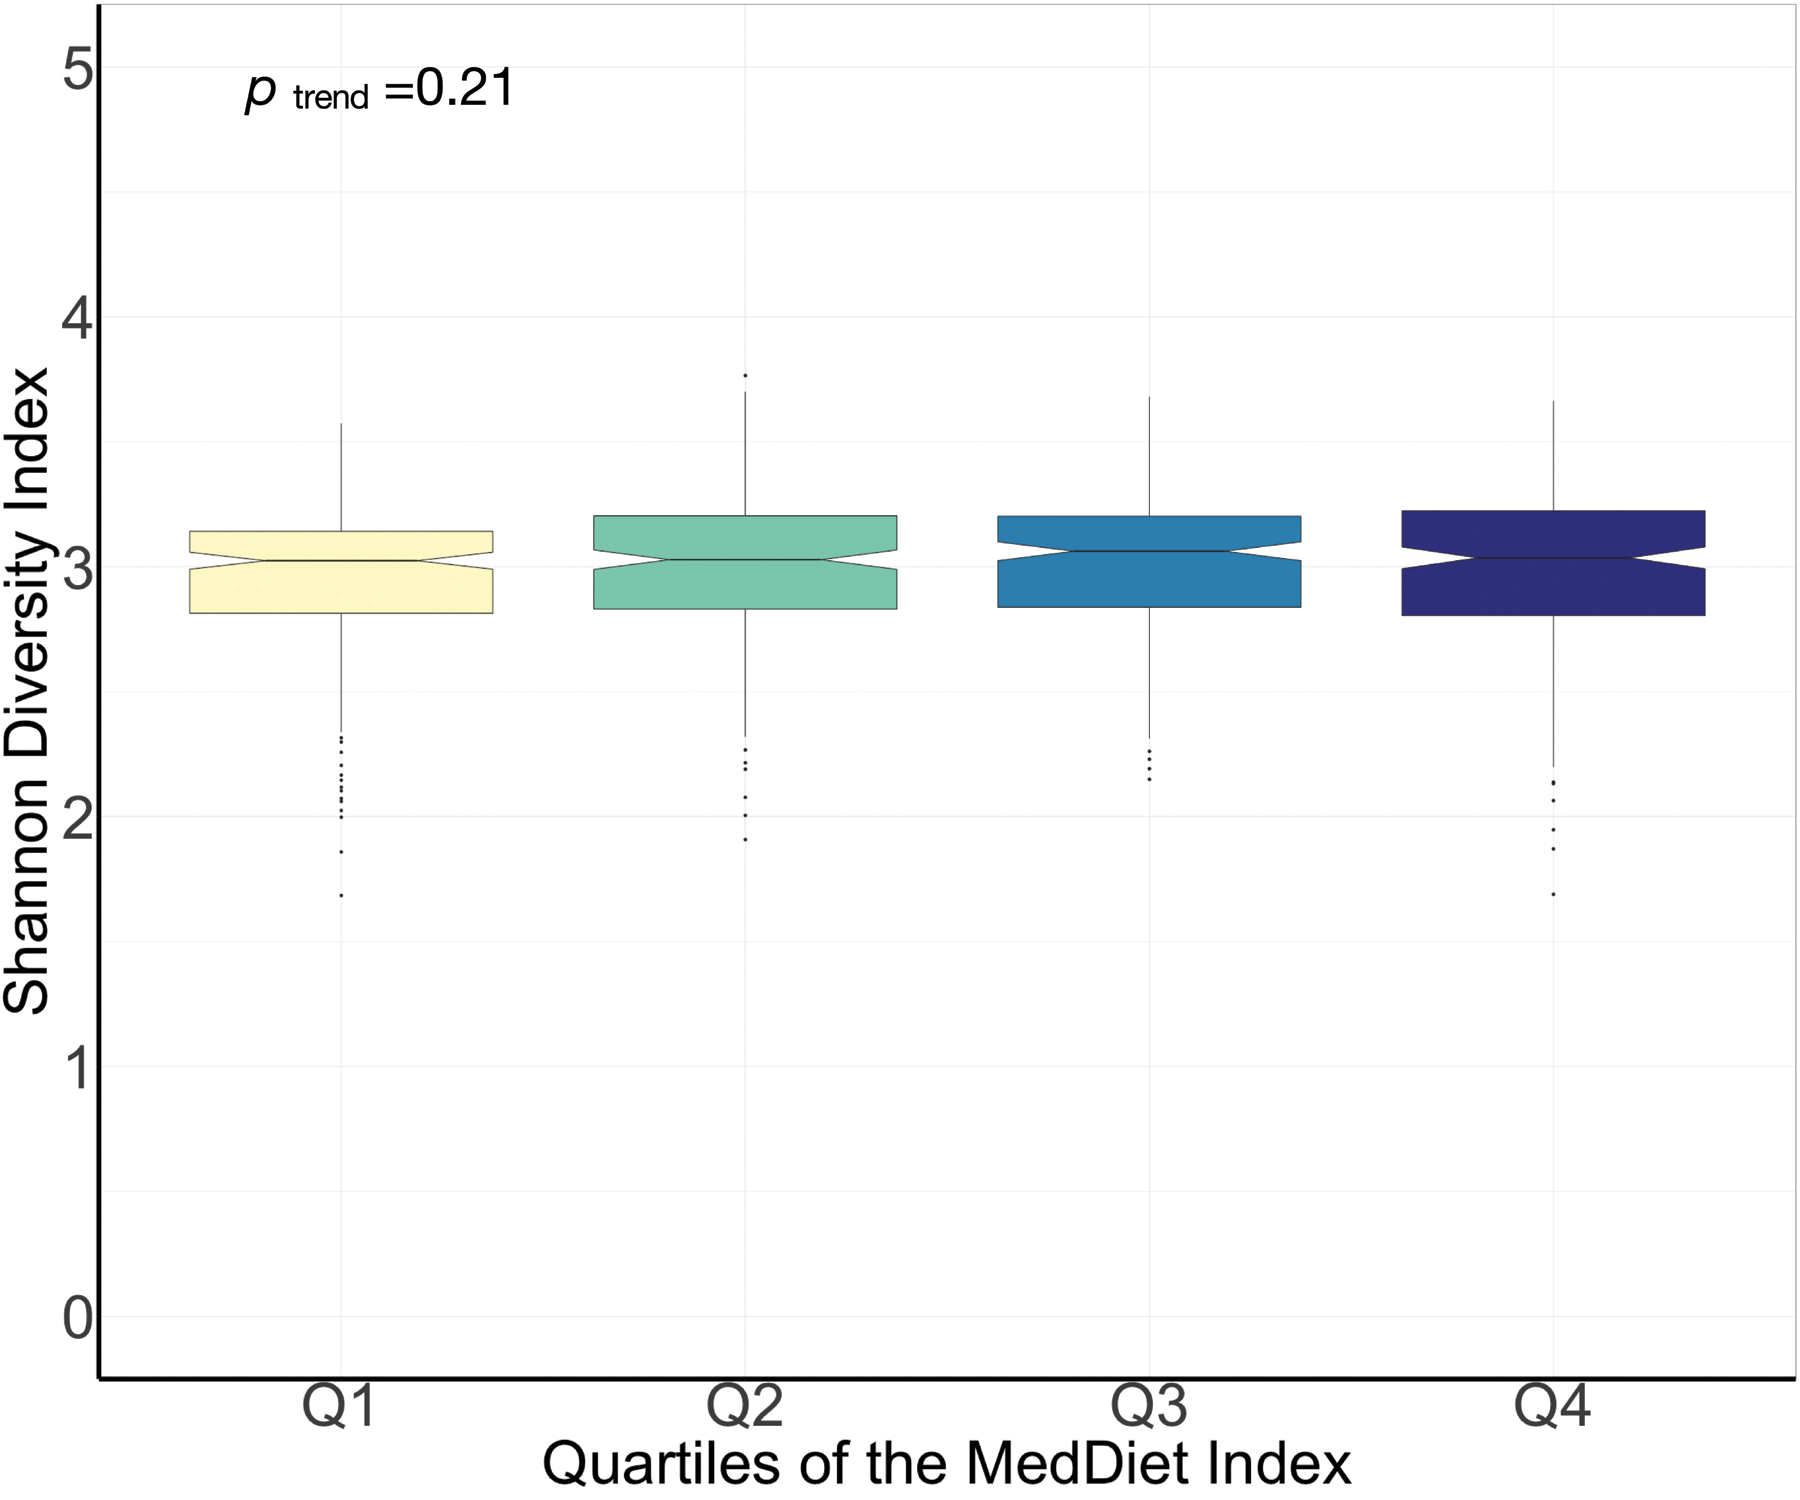
The diversity of gut microbiome was quantified by Shannon diversity index. P for linear trend was derived from a general linear model with the Shannon diversity index as the dependent variable and the quartiles of the Mediterranean diet index as independent variables. The significance test was two-sided. Box plot centers show medians of the Shannon diversity index with boxes indicating their inter-quartile ranges (IQRs); upper and lower whiskers indicate 1.5 times the IQR from above the upper quartile and below the lower quartile, respectively. This analysis was conducted based on 925 metagenomes from 307 participants.
Extended Data Figure 4: Associations of the Mediterranean diet index and its components with species-level features.
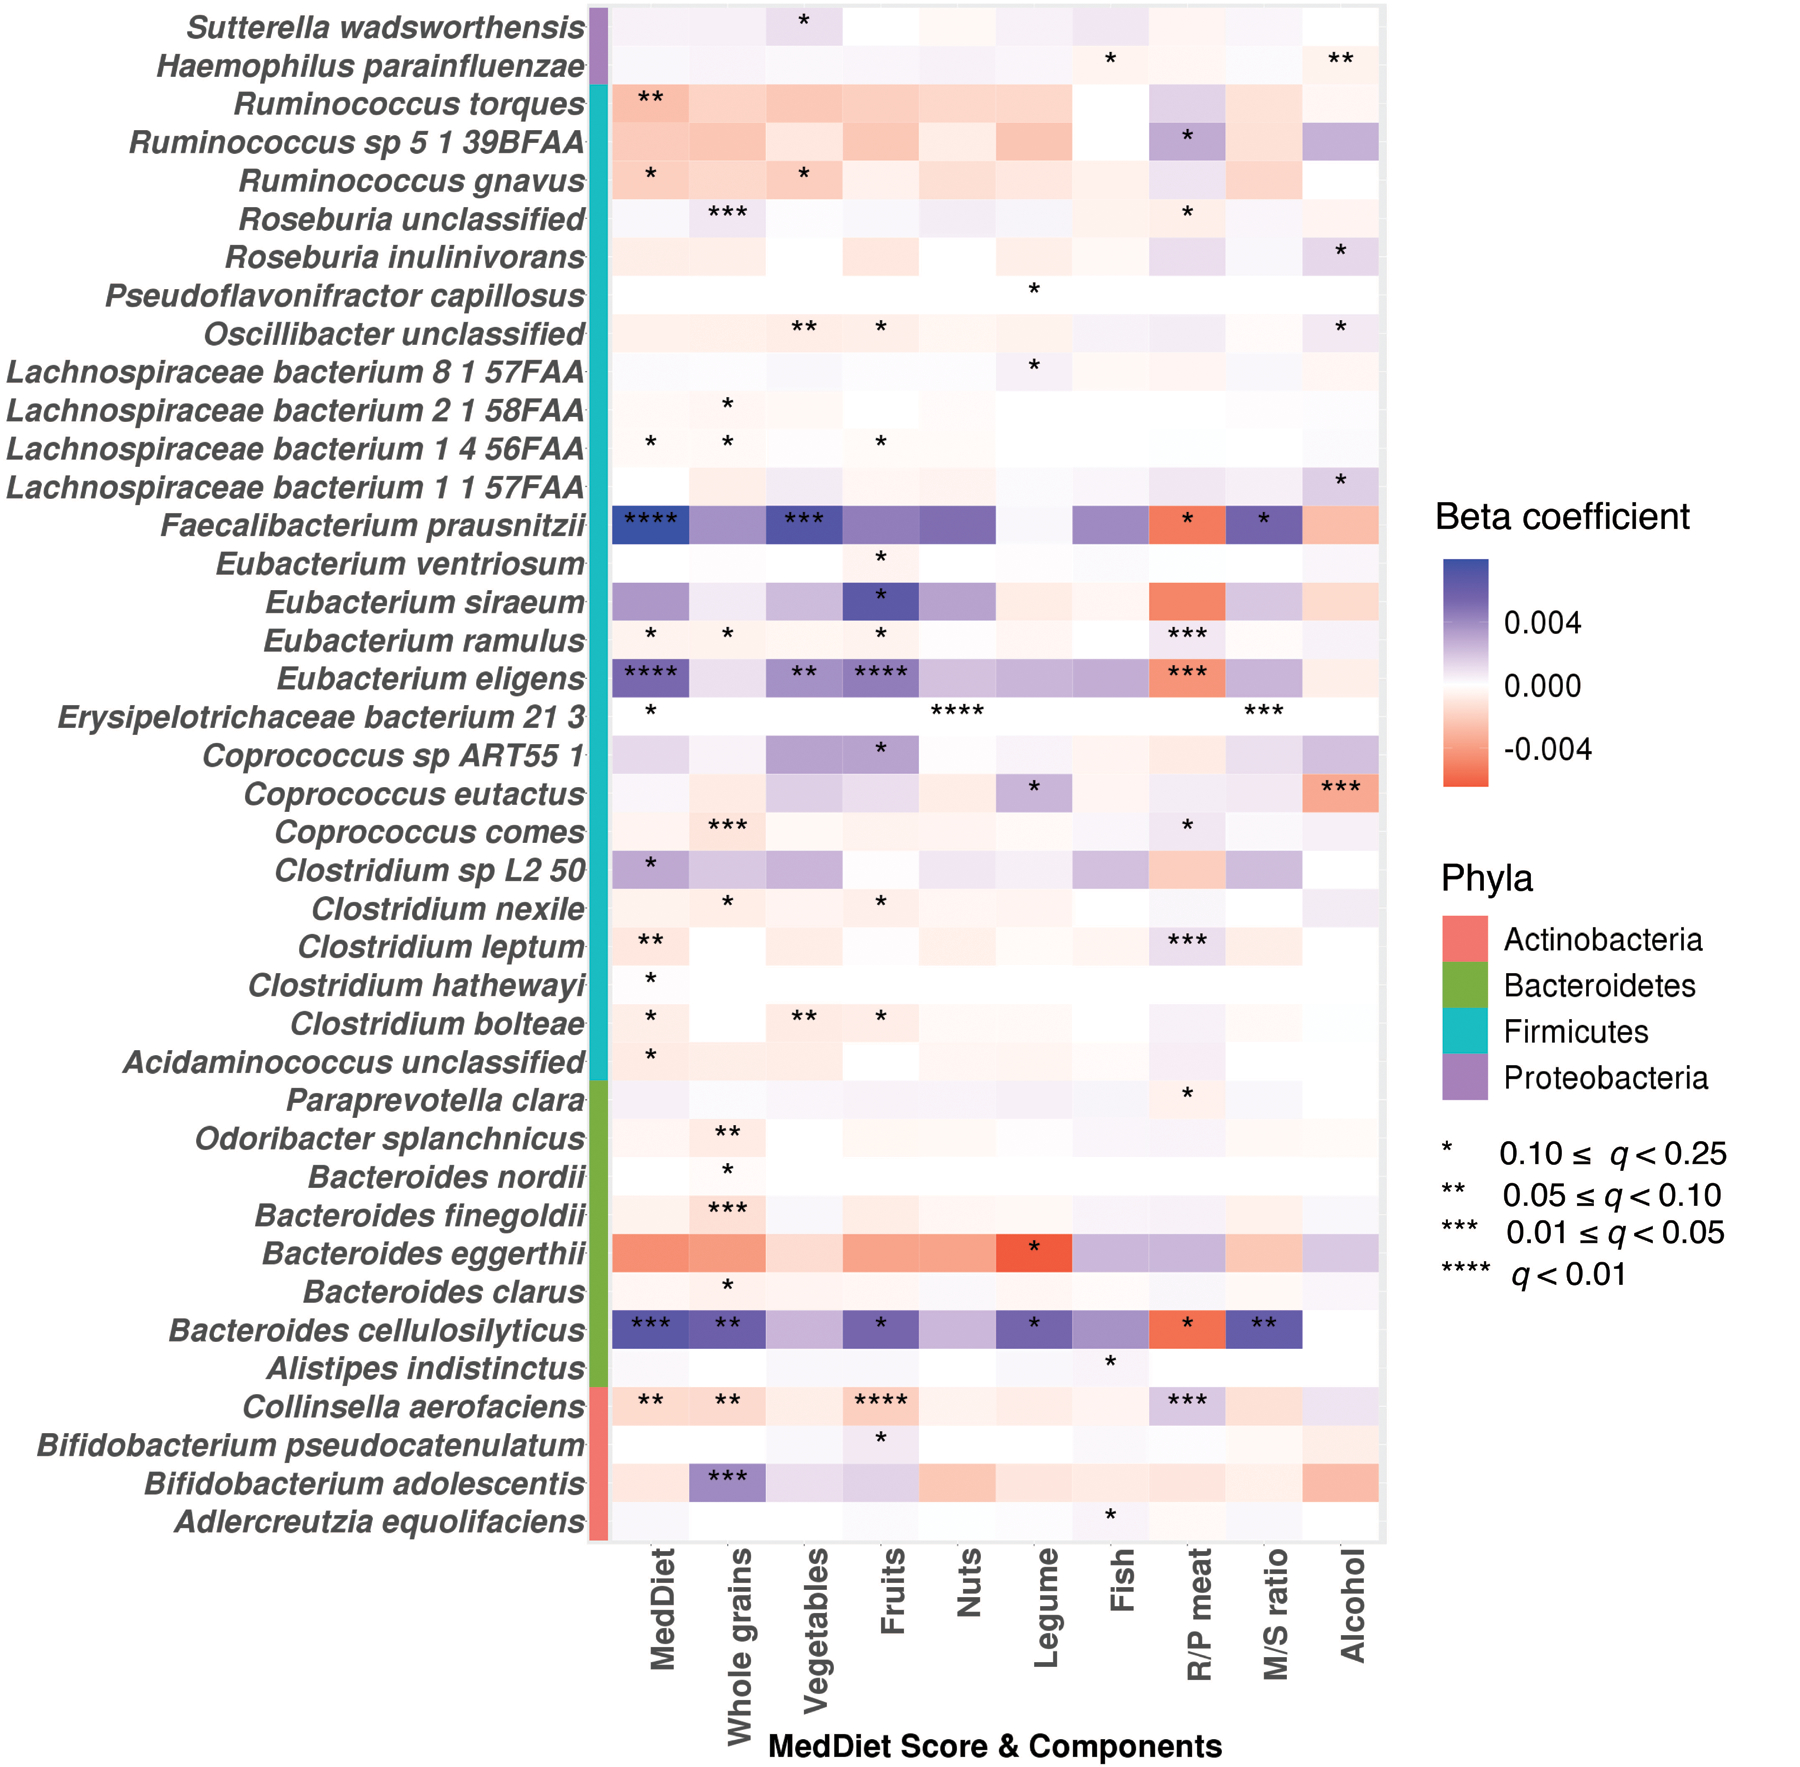
Colors of the heatmap are in correspondence to the beta coefficient for dietary variables from linear mixed models in MaAsLin 2 with species-level feature as outcomes. All models included each participant’s identifier as random effects and simultaneously adjusted for total energy intake, age, physical activity level, smoking, probiotic use, uses of antibiotics, proton pump inhibitors, aspirin, statins and metformin, and the Bristol stool scale. Statistical significance is from the linear mixed model with multiple comparison adjustment using the Benjamini-Hochberg method to calculate q-values (false discovery rate adjusted p-value, exact q-values in Source Data). These analyses were based on 925 metagenomes collected from 307 participants. All the statistical tests were two-sided.
Extended Data Figure 5: Associations of the Mediterranean diet index and its components with metagenomic pathways.
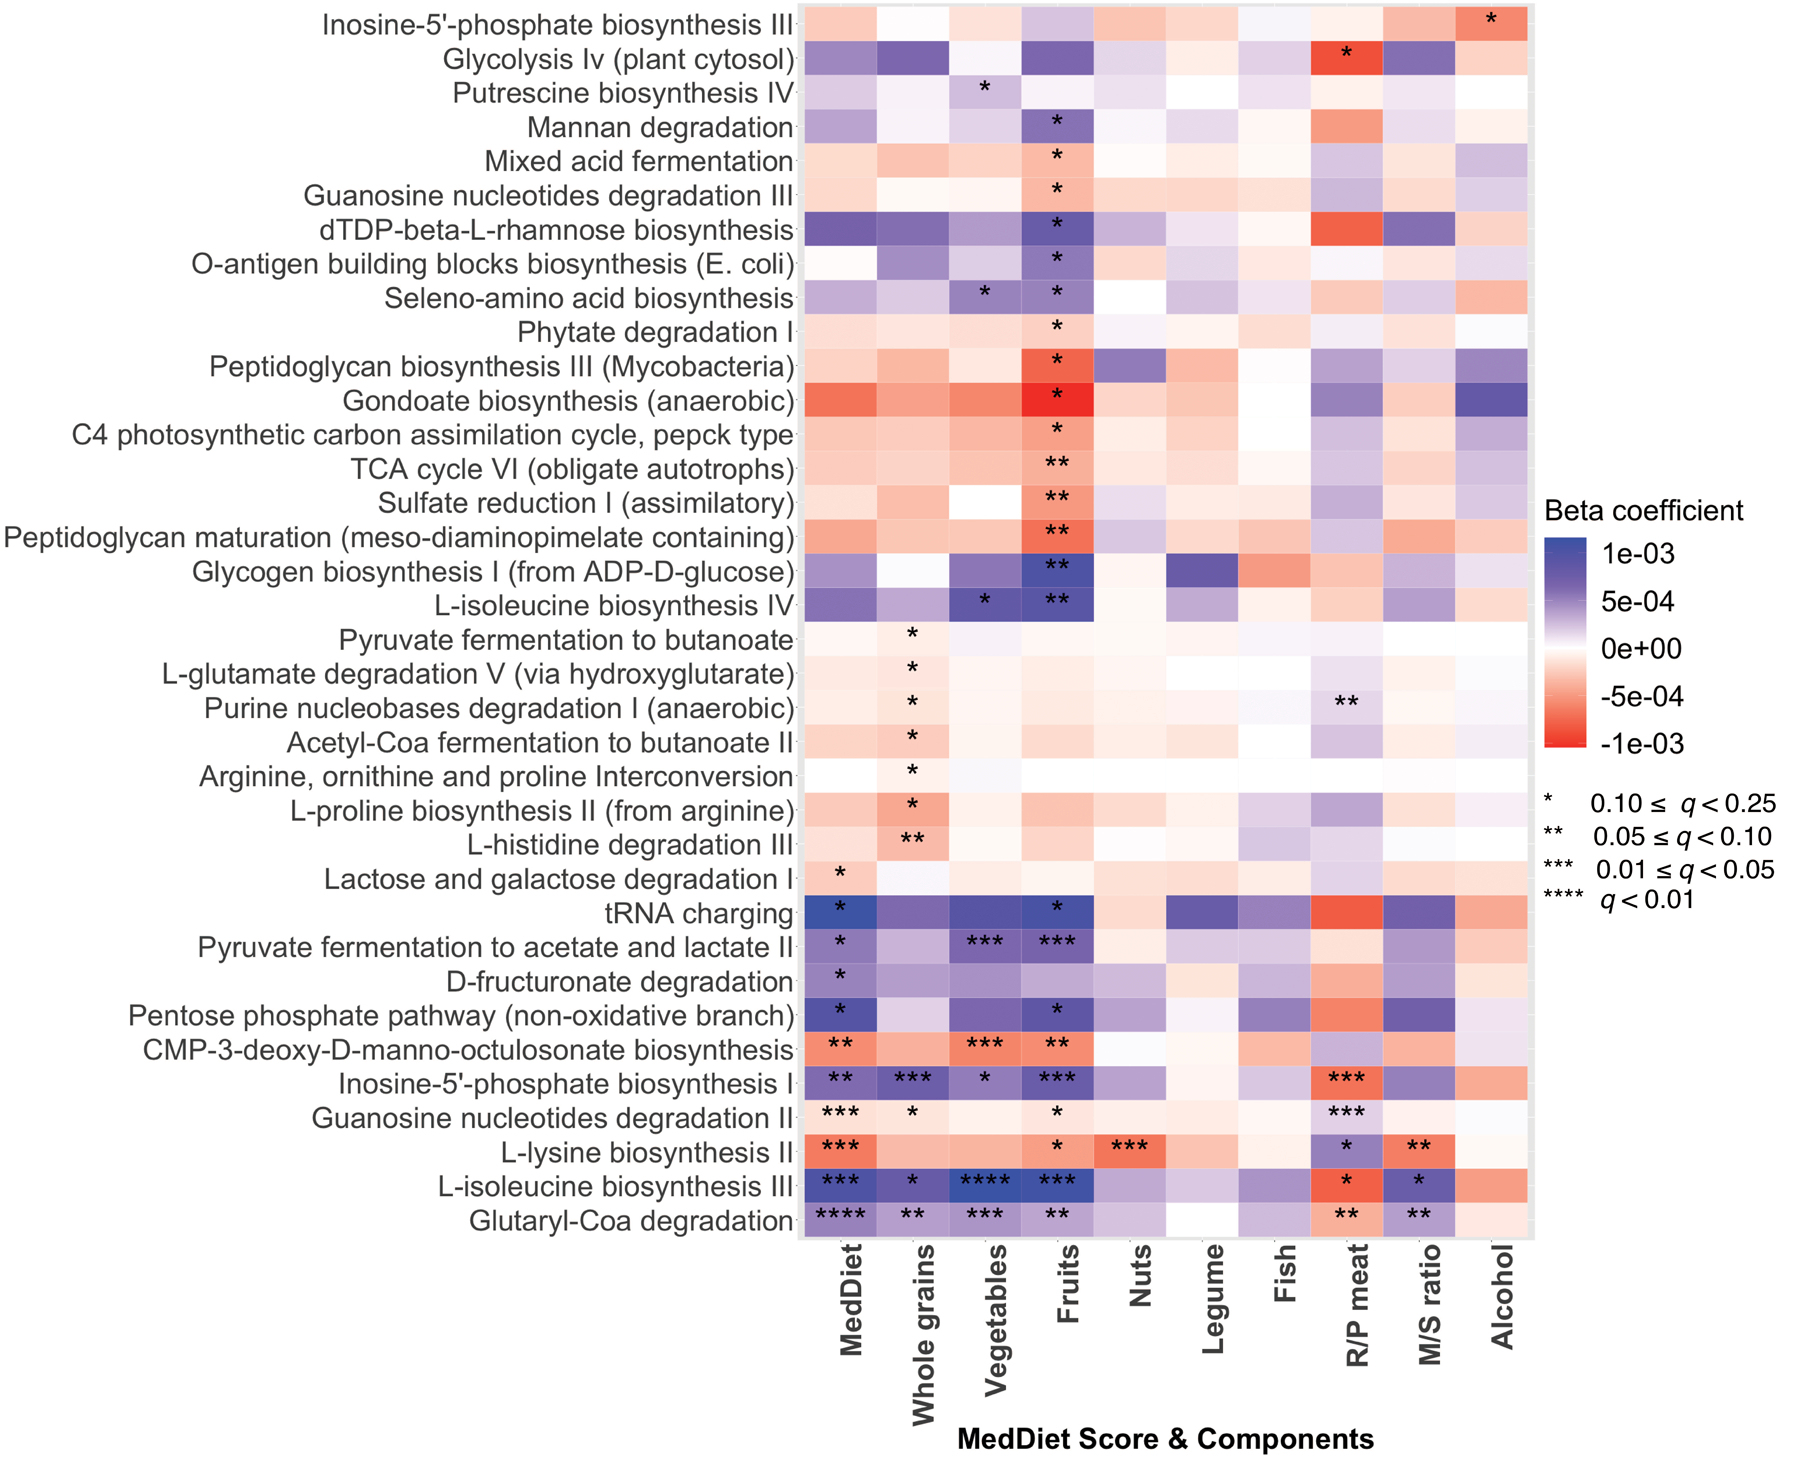
Colors of the heatmap are in correspondence to the beta coefficient for dietary variables from linear mixed models in MaAsLin 2 with metagenomic pathways as outcomes. All models included each participant’s identifier as random effects and simultaneously adjusted for total energy intake, age, physical activity level, smoking, probiotic use, uses of antibiotics, proton pump inhibitors, statins, aspirin and metformin, and Bristol stool scale. Statistical significance is from the linear mixed model with multiple comparison adjustment using the Benjamini-Hochberg method to calculate q-values (false discovery rate adjusted p-value, exact q-values in Source Data). These analyses were based on 925 metagenomes collected from 307 participants. All the statistical tests were two-sided.
Extended Data Figure 6: Associations of the Mediterranean diet index and its components with metagenomic enzymes.
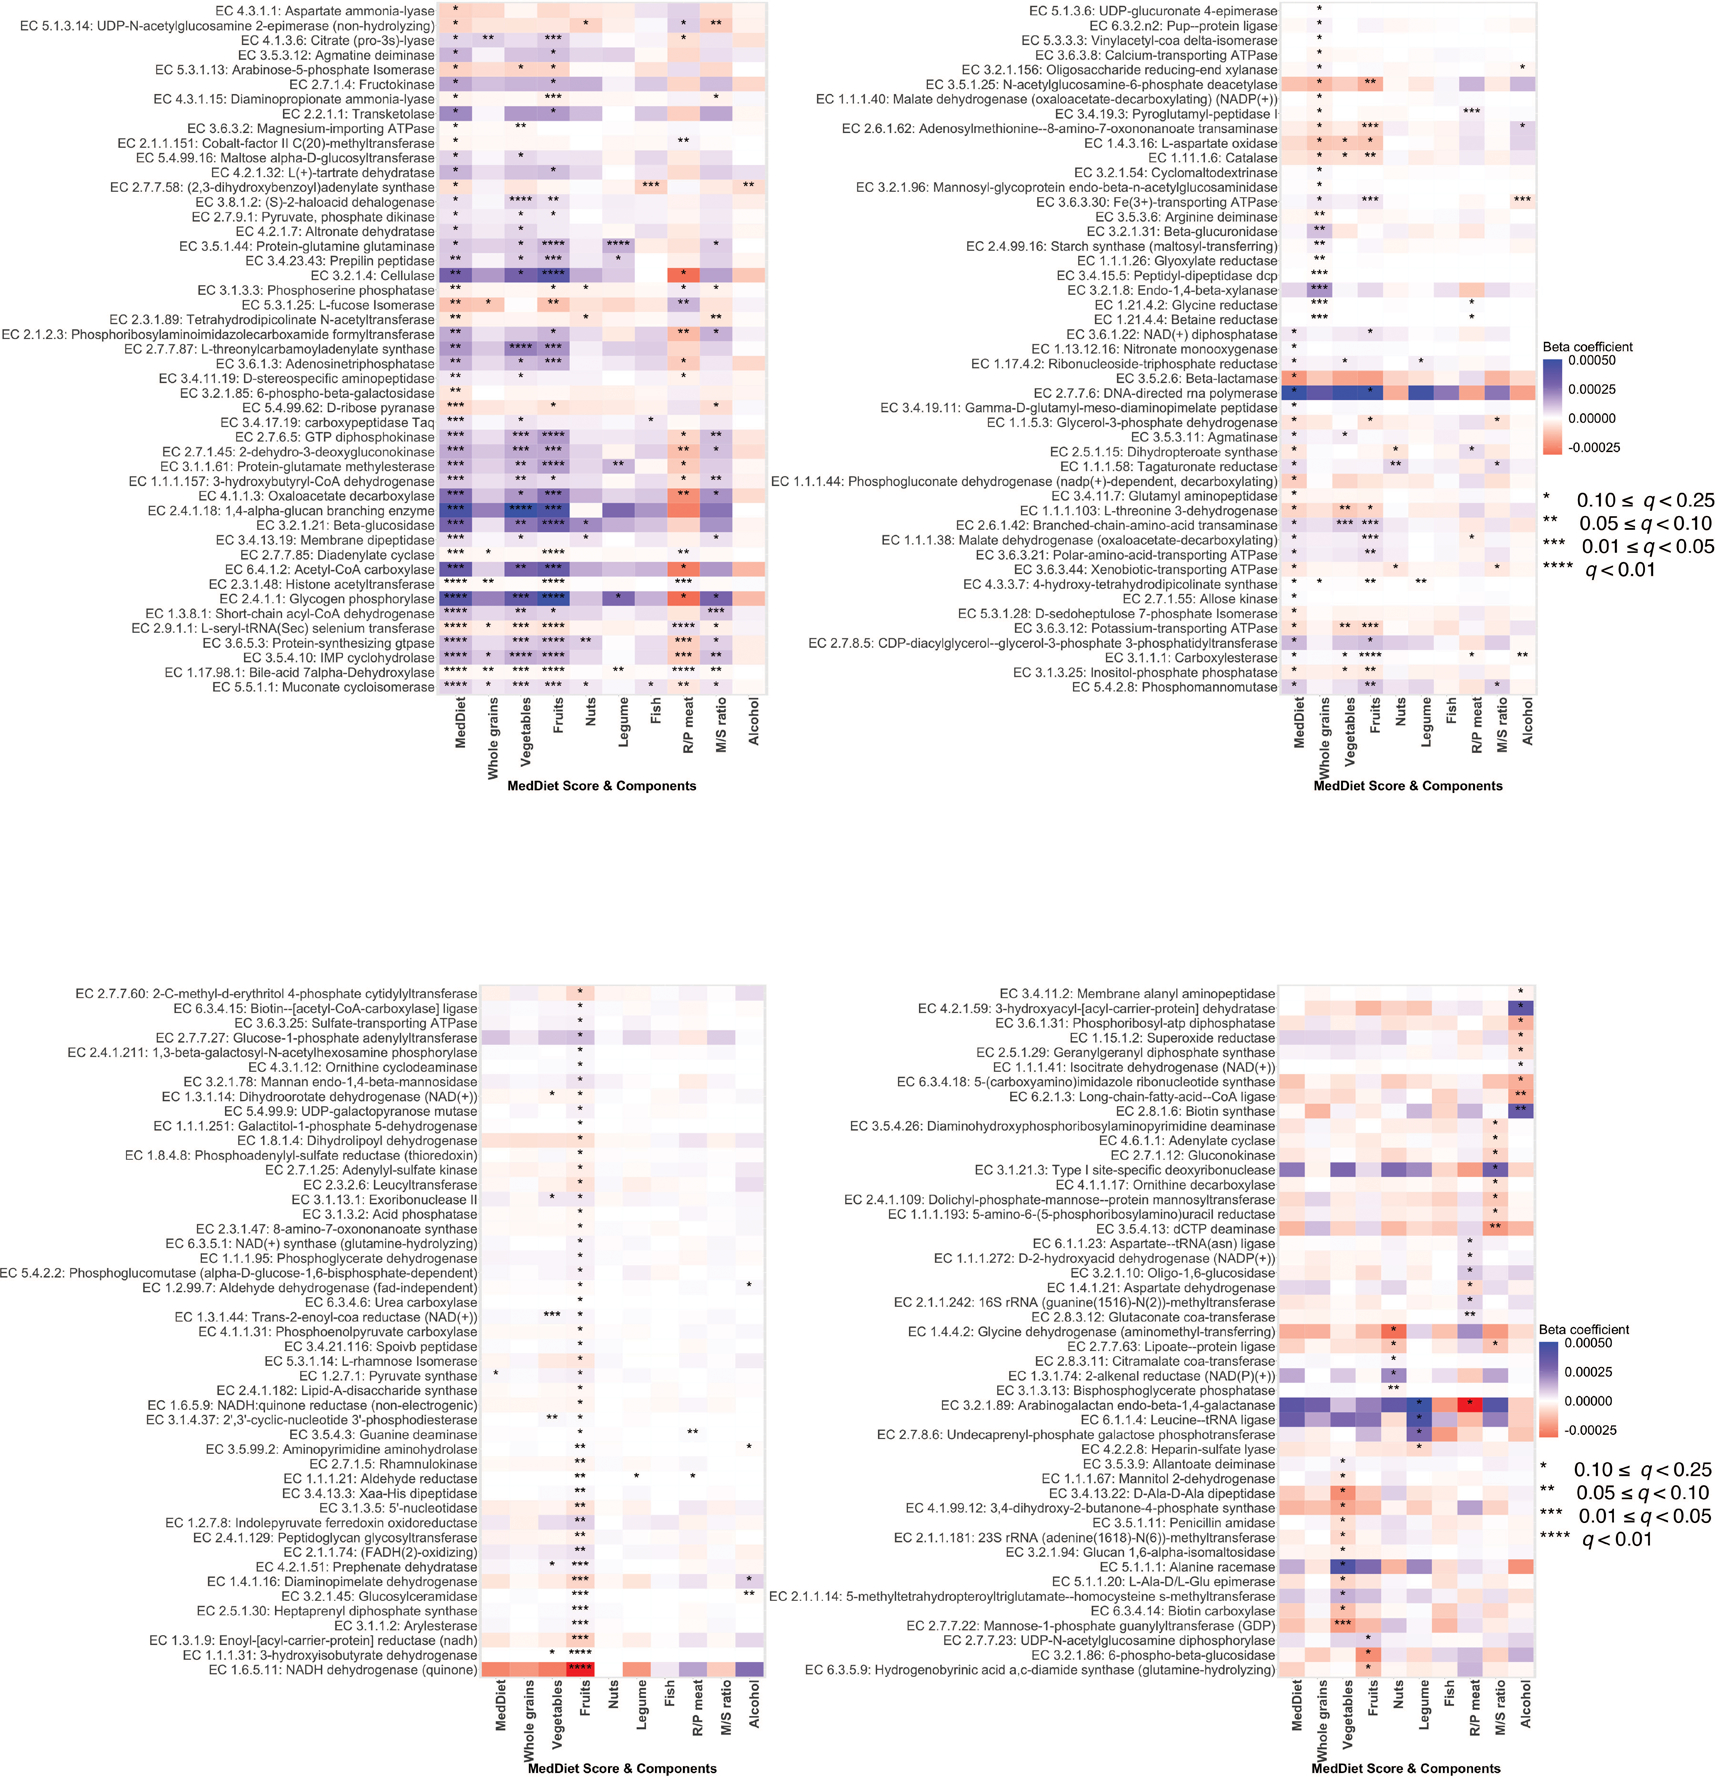
Colors of the heatmap are in correspondence to the beta coefficient for dietary variables from linear mixed models in MaAsLin 2 with metagenomic enzymes as outcomes. All models included each participant’s identifier as random effects and simultaneously adjusted for total energy intake, age, physical activity level, smoking, probiotic use, uses of antibiotics, proton pump inhibitors, statins, aspirin and metformin, and Bristol stool scale. Statistical significance is from the linear mixed model with multiple comparison adjustment using the Benjamini-Hochberg method to calculate q-values (false discovery rate adjusted p-value, exact q-values in Source Data). These analyses were based on 925 metagenomes collected from 307 participants. All the statistical tests were two-sided.
Extended Data Figure 7: Associations of the Mediterranean diet index and its components with transcription levels of microbial enzymes.
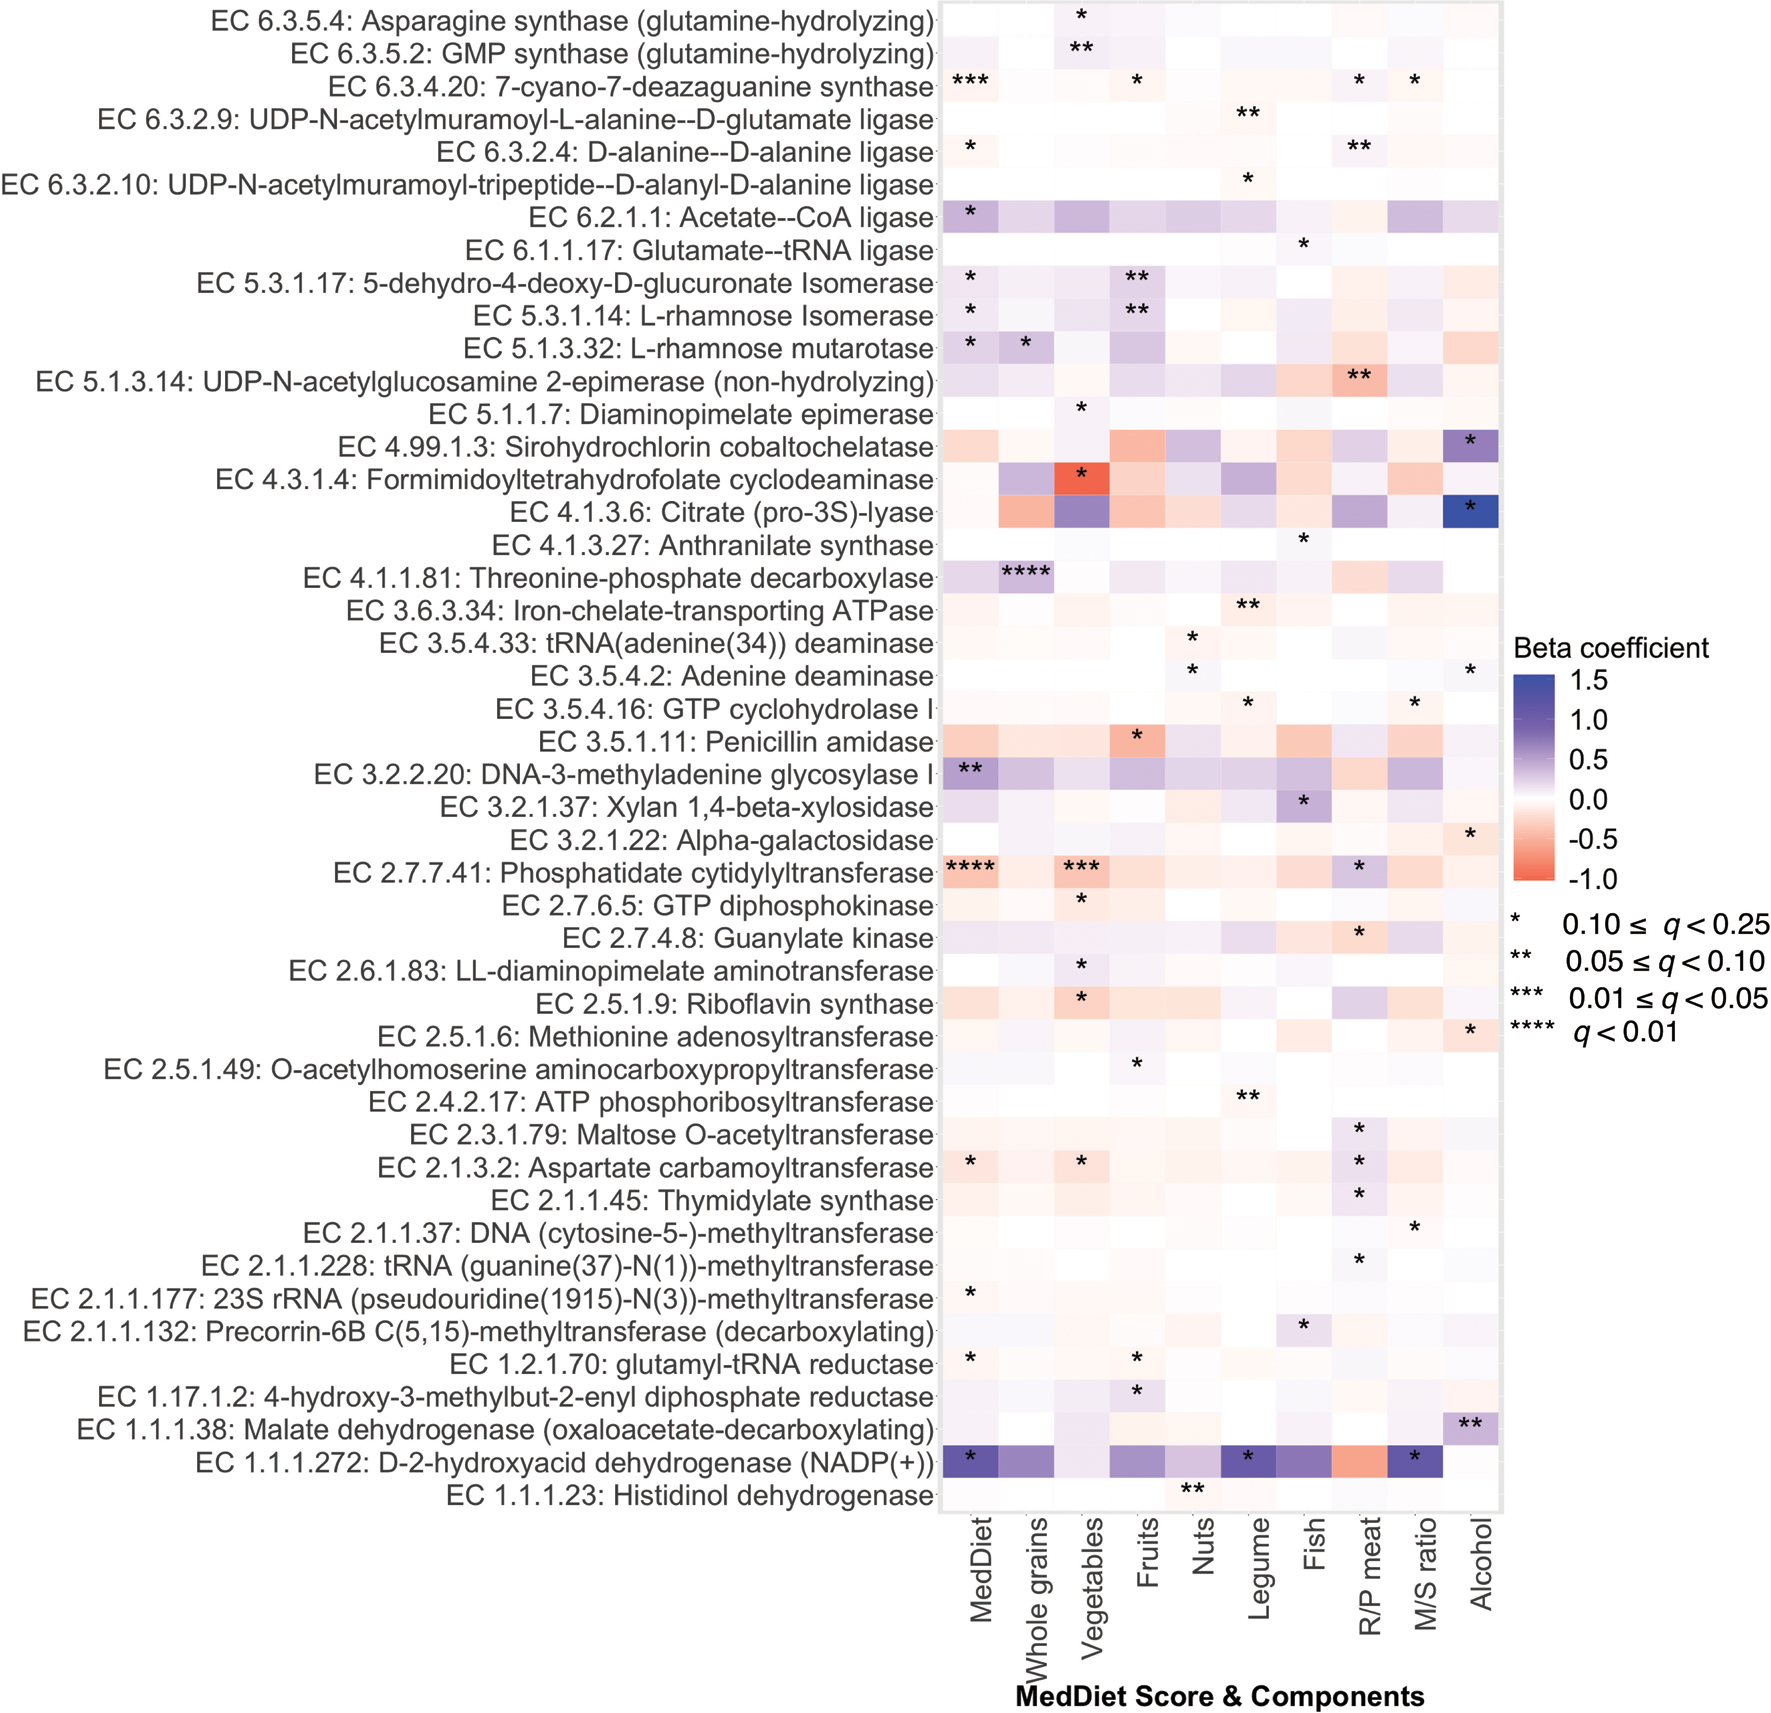
Colors of the heatmap are in correspondence to the beta coefficient for dietary variables from linear mixed models in MaAsLin 2 with transcription levels of microbial enzymes (RNA/DNA ratio) as outcomes. All models included each participant’s identifier as random effects and simultaneously adjusted for total energy intake, age, physical activity level, smoking, probiotic use, and Bristol stool scale. Statistical significance is from the linear mixed model with multiple comparison adjustment using the Benjamini-Hochberg method to calculate q-values (false discovery rate adjusted p-value, exact q-values in Source Data). These analyses were based on 340 metatranscriptome and metagenome pairs from 96 participants. All the statistical tests were two-sided.
Extended Data Figure 8: Associations of the Mediterranean diet index with the cardiometabolic disease risk score and biomarkers.
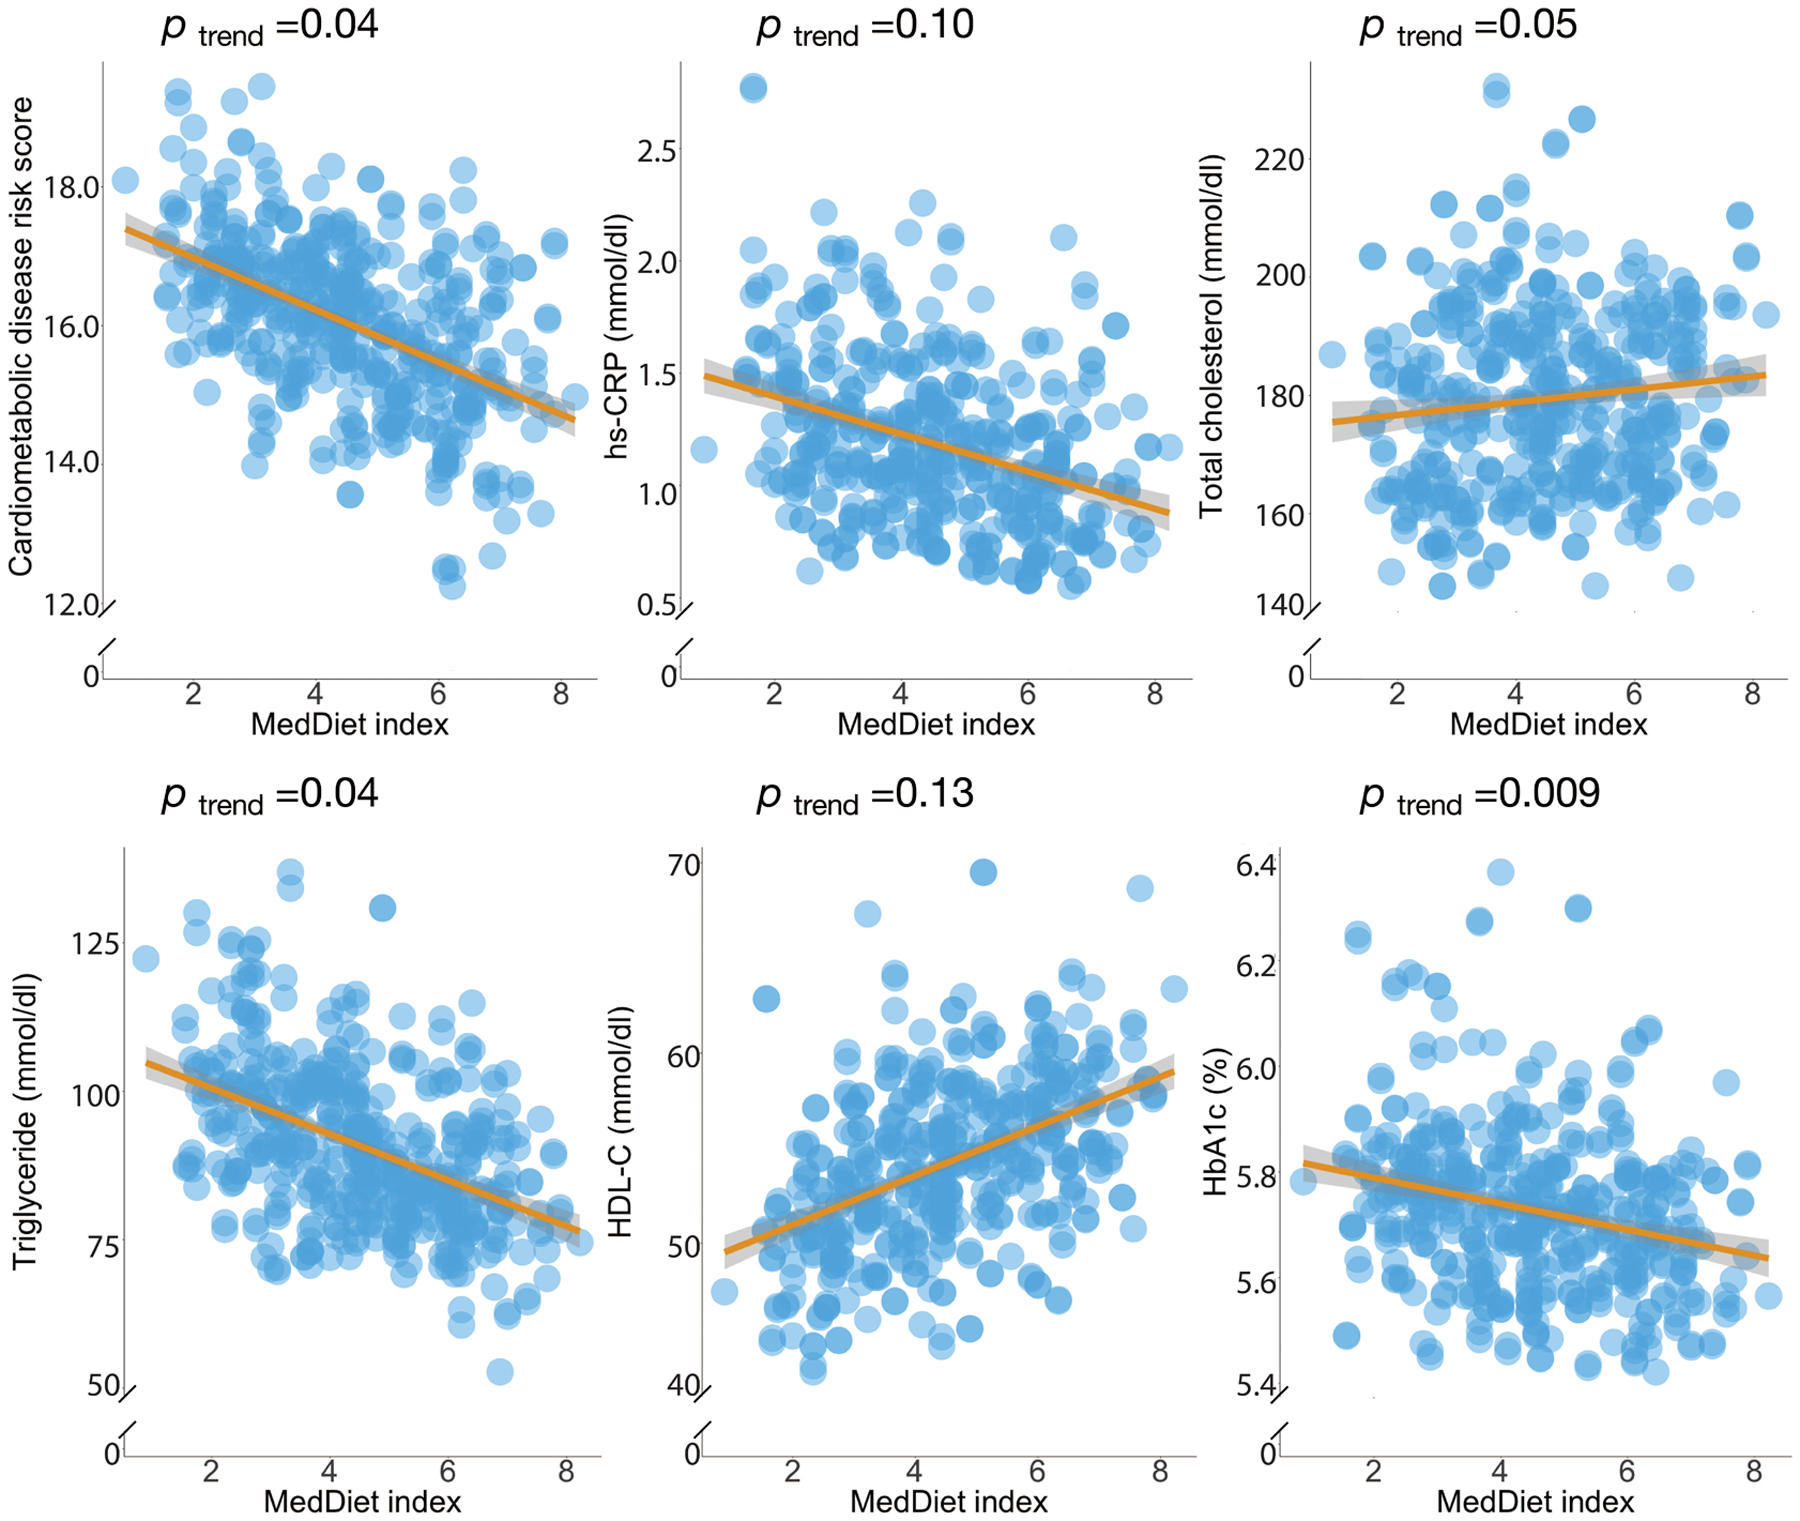
P-values were estimated from linear mixed model that included each participant’s identifier as random effects and simultaneously adjusted for total energy intake, age, physical activity level, smoking, probiotic use, Bristol stool scale, uses of antibiotics, statins, aspirin, proton pump inhibitors and metformin and the 1st principal coordinate analysis loading as fixed effects. This analysis was based on 468 blood samples from 304 participants. The shaded areas indicate 95% confidence intervals of values on the fitted linear trend lines. All the statistical tests were two-sided.
Extended Data Figure 9: Interaction between adherence to the Mediterranean diet and the abundance of highly abundant microbial species in relation to the score of cardiometabolic disease risk.
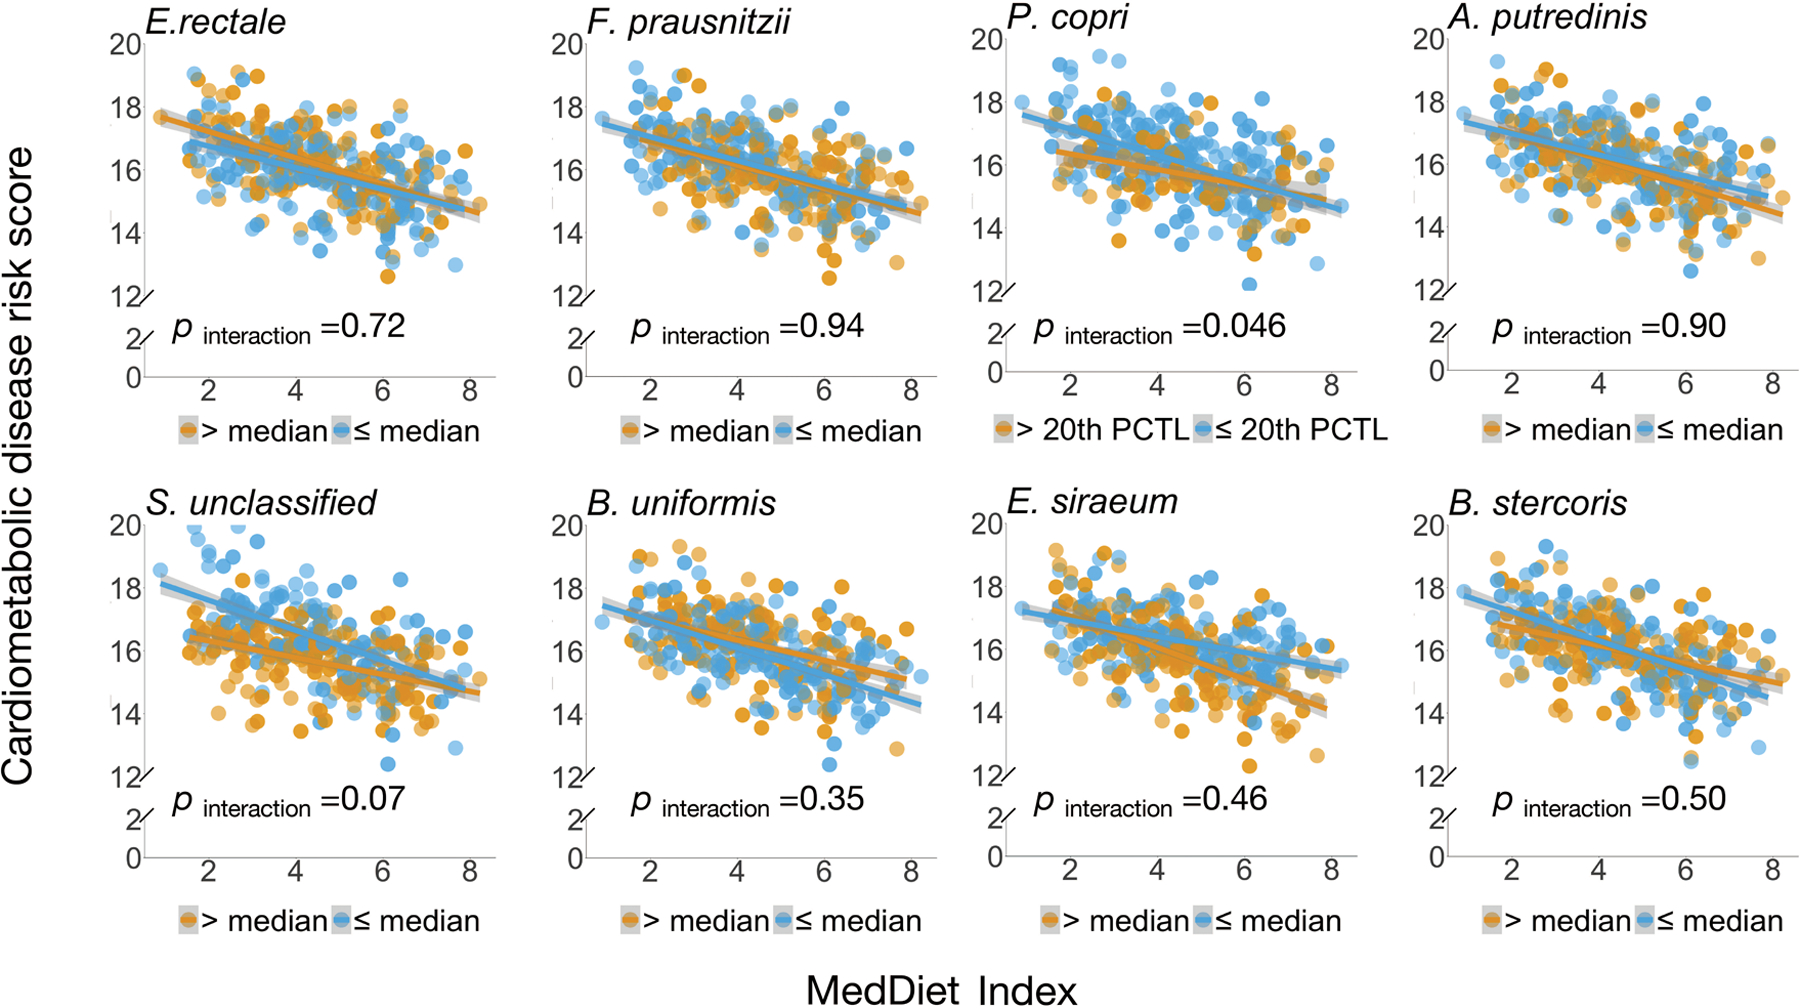
P for interaction was derived from linear mixed models that included participant’s identifier as random effects, the Mediterranean diet index, individual microbial species and their product term, and simultaneously adjusted for total energy intake, age, physical activity level, smoking, probiotic use, Bristol stool scale, and uses of antibiotics, statins, aspirin, proton pump inhibitors and metformin as fixed effects. We performed two-sided likelihood ratio tests by comparing models with and without an interaction term to calculate p-values for interaction (degree of freedom =1). This analysis was based on 468 blood samples from 304 participants. The shaded areas indicate 95% confidence intervals of values on the fitted linear trend lines.
Extended Data Figure 10: The gut microbial profile modifies associations of the MedDiet with individual biomarkers of cardiometabolic disease risk.
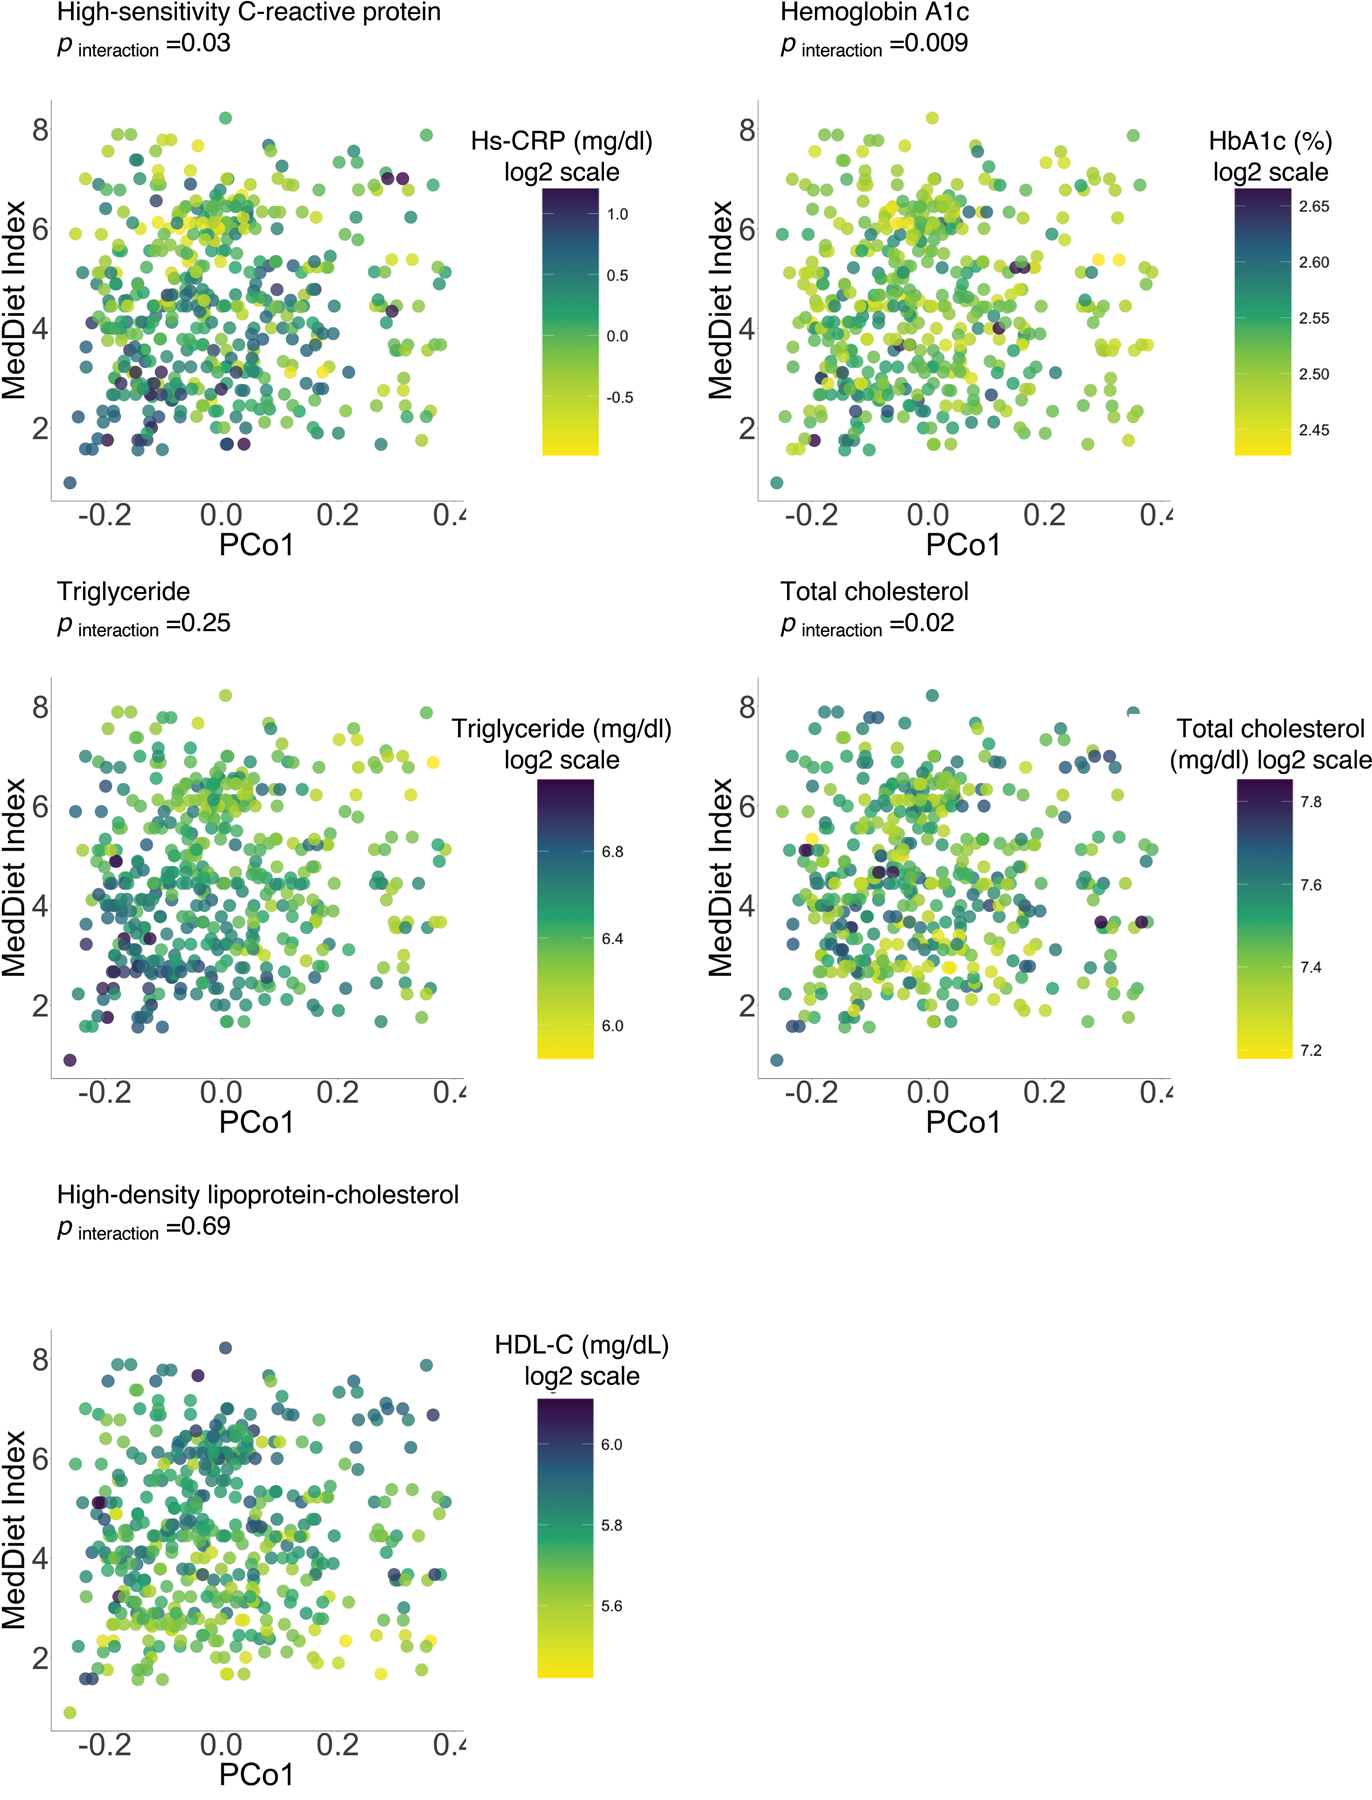
P for interaction was derived from a linear mixed model that included participant’s identifier as random effects, the MedDiet index, individual microbial species and their product term, and simultaneously adjusted for total energy intake, age, physical activity level, smoking, probiotic use, Bristol stool scale, and uses of antibiotics, statins, aspirin, proton pump inhibitors and metformin as fixed effects. We performed two-sided likelihood ratio tests by comparing models with and without an interaction term to calculate p-values for interaction (degree of freedom =1). This analysis was based on 468 blood samples from 304 participants.
Supplementary Material
Acknowledgements
Funding/Support:
This work was supported by R00DK119412 (DDW), R01HL060712 (FBH), P30DK046200 (FBH), R01CA202704 (ATC, CH), K24DK098311 (ATC), and U54DE023798 (CH) from the National Institutes of Health (NIH), STARR Cancer Consortium Award #I7-A714 to CH, and a Pilot and Feasibility award to DDW from the Boston Nutrition and Obesity Research Center funded by the National Institute of Diabetes and Digestive and Kidney Diseases (P30DK046200). The Men’s Lifestyle Validation Study was supported by U01CA152904 from the National Cancer Institute. The Health Professionals Follow-Up Study is supported by research grants U01CA167552 and R01HL035464 from the NIH.
Role of the Funder/Sponsor:
The funding source had no role in the design and conduct of the study; collection, management, analysis, and interpretation of the data; preparation, review, or approval of the manuscript; and the decision to submit the manuscript for publication. The content is solely the responsibility of the authors and does not necessarily represent the official views of the National Institutes of Health.
The authors declare the following competing interests:
CH is a scientific advisor for Seres Therapeutics, Empress Therapeutics, and ZOE Nutrition. YL has received research support from the California Walnut Commission and SwissRe Management Ltd. The remaining authors disclose no conflicts.
References
- 1.Collaborators U.S.B.o.D., et al. The State of US Health, 1990–2016: Burden of Diseases, Injuries, and Risk Factors Among US States. JAMA 319, 1444–1472 (2018). [DOI] [PMC free article] [PubMed] [Google Scholar]
- 2.DALYs G.B.D. & Collaborators H. Global, regional, and national disability-adjusted life-years (DALYs) for 359 diseases and injuries and healthy life expectancy (HALE) for 195 countries and territories, 1990–2017: a systematic analysis for the Global Burden of Disease Study 2017. Lancet 392, 1859–1922 (2018). [DOI] [PMC free article] [PubMed] [Google Scholar]
- 3.Koeth RA, et al. Intestinal microbiota metabolism of L-carnitine, a nutrient in red meat, promotes atherosclerosis. Nat Med 19, 576–585 (2013). [DOI] [PMC free article] [PubMed] [Google Scholar]
- 4.Kurilshikov A, et al. Gut Microbial Associations to Plasma Metabolites Linked to Cardiovascular Phenotypes and Risk. Circ Res 124, 1808–1820 (2019). [DOI] [PubMed] [Google Scholar]
- 5.Forslund K, et al. Disentangling type 2 diabetes and metformin treatment signatures in the human gut microbiota. Nature 528, 262–266 (2015). [DOI] [PMC free article] [PubMed] [Google Scholar]
- 6.Pedersen HK, et al. Human gut microbes impact host serum metabolome and insulin sensitivity. Nature 535, 376–381 (2016). [DOI] [PubMed] [Google Scholar]
- 7.Thingholm LB, et al. Obese Individuals with and without Type 2 Diabetes Show Different Gut Microbial Functional Capacity and Composition. Cell Host Microbe 26, 252–264.e210 (2019). [DOI] [PMC free article] [PubMed] [Google Scholar]
- 8.Haro C, et al. Two Healthy Diets Modulate Gut Microbial Community Improving Insulin Sensitivity in a Human Obese Population. The Journal of clinical endocrinology and metabolism 101, 233–242 (2016). [DOI] [PubMed] [Google Scholar]
- 9.Kovatcheva-Datchary P, et al. Dietary Fiber-Induced Improvement in Glucose Metabolism Is Associated with Increased Abundance of Prevotella. Cell Metab 22, 971–982 (2015). [DOI] [PubMed] [Google Scholar]
- 10.Zeevi D, et al. Personalized Nutrition by Prediction of Glycemic Responses. Cell 163, 1079–1094 (2015). [DOI] [PubMed] [Google Scholar]
- 11.David LA, et al. Diet rapidly and reproducibly alters the human gut microbiome. Nature 505, 559–563 (2014). [DOI] [PMC free article] [PubMed] [Google Scholar]
- 12.Smits SA, et al. Seasonal cycling in the gut microbiome of the Hadza hunter-gatherers of Tanzania. Science 357, 802–806 (2017). [DOI] [PMC free article] [PubMed] [Google Scholar]
- 13.Sonnenburg JL & Backhed F Diet-microbiota interactions as moderators of human metabolism. Nature 535, 56–64 (2016). [DOI] [PMC free article] [PubMed] [Google Scholar]
- 14.Faith JJ, McNulty NP, Rey FE & Gordon JI Predicting a human gut microbiota’s response to diet in gnotobiotic mice. Science 333, 101–104 (2011). [DOI] [PMC free article] [PubMed] [Google Scholar]
- 15.Turnbaugh PJ, et al. The effect of diet on the human gut microbiome: a metagenomic analysis in humanized gnotobiotic mice. Sci Transl Med 1, 6ra14 (2009). [DOI] [PMC free article] [PubMed] [Google Scholar]
- 16.Falony G, et al. Population-level analysis of gut microbiome variation. Science 352, 560–564 (2016). [DOI] [PubMed] [Google Scholar]
- 17.Vatanen T, et al. The human gut microbiome in early-onset type 1 diabetes from the TEDDY study. Nature 562, 589–594 (2018). [DOI] [PMC free article] [PubMed] [Google Scholar]
- 18.Yatsunenko T, et al. Human gut microbiome viewed across age and geography. Nature 486, 222–227 (2012). [DOI] [PMC free article] [PubMed] [Google Scholar]
- 19.De Filippo C, et al. Impact of diet in shaping gut microbiota revealed by a comparative study in children from Europe and rural Africa. Proc Natl Acad Sci U S A 107, 14691–14696 (2010). [DOI] [PMC free article] [PubMed] [Google Scholar]
- 20.Wu GD, et al. Linking long-term dietary patterns with gut microbial enterotypes. Science 334, 105–108 (2011). [DOI] [PMC free article] [PubMed] [Google Scholar]
- 21.Zhernakova A, et al. Population-based metagenomics analysis reveals markers for gut microbiome composition and diversity. Science 352, 565–569 (2016). [DOI] [PMC free article] [PubMed] [Google Scholar]
- 22.Willett WC, et al. Mediterranean diet pyramid: a cultural model for healthy eating. Am J Clin Nutr 61, 1402S–1406S (1995). [DOI] [PubMed] [Google Scholar]
- 23.Van Horn L, et al. Recommended Dietary Pattern to Achieve Adherence to the American Heart Association/American College of Cardiology (AHA/ACC) Guidelines: A Scientific Statement From the American Heart Association. Circulation 134, e505–e529 (2016). [DOI] [PubMed] [Google Scholar]
- 24.American Diabetes A. 4. Lifestyle Management: Standards of Medical Care in Diabetes-2018. Diabetes Care 41, S38–S50 (2018). [DOI] [PubMed] [Google Scholar]
- 25.Estruch R, et al. Primary Prevention of Cardiovascular Disease with a Mediterranean Diet Supplemented with Extra-Virgin Olive Oil or Nuts. The New England journal of medicine 378, e34 (2018). [DOI] [PubMed] [Google Scholar]
- 26.Ghosh TS, et al. Mediterranean diet intervention alters the gut microbiome in older people reducing frailty and improving health status: the NU-AGE 1-year dietary intervention across five European countries. Gut, gutjnl-2019–319654 (2020). [DOI] [PMC free article] [PubMed] [Google Scholar]
- 27.Meslier V, et al. Mediterranean diet intervention in overweight and obese subjects lowers plasma cholesterol and causes changes in the gut microbiome and metabolome independently of energy intake. Gut 69, 1258–1268 (2020). [DOI] [PMC free article] [PubMed] [Google Scholar]
- 28.Abu-Ali GS, et al. Metatranscriptome of human faecal microbial communities in a cohort of adult men. Nat Microbiol 3, 356–366 (2018). [DOI] [PMC free article] [PubMed] [Google Scholar]
- 29.Truong DT, et al. MetaPhlAn2 for enhanced metagenomic taxonomic profiling. Nat Methods 12, 902–903 (2015). [DOI] [PubMed] [Google Scholar]
- 30.Franzosa EA, et al. Species-level functional profiling of metagenomes and metatranscriptomes. Nat Methods 15, 962–968 (2018). [DOI] [PMC free article] [PubMed] [Google Scholar]
- 31.Fung TT, et al. Diet-quality scores and plasma concentrations of markers of inflammation and endothelial dysfunction. Am J Clin Nutr 82, 163–173 (2005). [DOI] [PubMed] [Google Scholar]
- 32.Pasolli E, et al. Extensive Unexplored Human Microbiome Diversity Revealed by Over 150,000 Genomes from Metagenomes Spanning Age, Geography, and Lifestyle. Cell 176, 649–662 e620 (2019). [DOI] [PMC free article] [PubMed] [Google Scholar]
- 33.Tett A, et al. The Prevotella copri Complex Comprises Four Distinct Clades Underrepresented in Westernized Populations. Cell Host Microbe 26, 666–679 e667 (2019). [DOI] [PMC free article] [PubMed] [Google Scholar]
- 34.De Filippis F, et al. Distinct Genetic and Functional Traits of Human Intestinal Prevotella copri Strains Are Associated with Different Habitual Diets. Cell Host Microbe 25, 444–453 e443 (2019). [DOI] [PubMed] [Google Scholar]
- 35.Vangay P, et al. US Immigration Westernizes the Human Gut Microbiome. Cell 175, 962–972 e910 (2018). [DOI] [PMC free article] [PubMed] [Google Scholar]
- 36.Dethlefsen L & Relman DA Incomplete recovery and individualized responses of the human distal gut microbiota to repeated antibiotic perturbation. Proc Natl Acad Sci U S A 108 Suppl 1, 4554–4561 (2011). [DOI] [PMC free article] [PubMed] [Google Scholar]
- 37.Chung WS, et al. Modulation of the human gut microbiota by dietary fibres occurs at the species level. BMC Biol 14, 3 (2016). [DOI] [PMC free article] [PubMed] [Google Scholar]
- 38.Martinez-Medina M, et al. Western diet induces dysbiosis with increased E coli in CEABAC10 mice, alters host barrier function favouring AIEC colonisation. Gut 63, 116–124 (2014). [DOI] [PubMed] [Google Scholar]
- 39.Gomez-Arango LF, et al. Low dietary fiber intake increases Collinsella abundance in the gut microbiota of overweight and obese pregnant women. Gut Microbes 9, 189–201 (2018). [DOI] [PMC free article] [PubMed] [Google Scholar]
- 40.Amato KR, et al. Variable responses of human and non-human primate gut microbiomes to a Western diet. Microbiome 3, 53 (2015). [DOI] [PMC free article] [PubMed] [Google Scholar]
- 41.Foerster J, et al. The influence of whole grain products and red meat on intestinal microbiota composition in normal weight adults: a randomized crossover intervention trial. PLoS One 9, e109606 (2014). [DOI] [PMC free article] [PubMed] [Google Scholar]
- 42.Boerjan W, Ralph J & Baucher M Lignin biosynthesis. Annu Rev Plant Biol 54, 519–546 (2003). [DOI] [PubMed] [Google Scholar]
- 43.Koh A, De Vadder F, Kovatcheva-Datchary P & Backhed F From Dietary Fiber to Host Physiology: Short-Chain Fatty Acids as Key Bacterial Metabolites. Cell 165, 1332–1345 (2016). [DOI] [PubMed] [Google Scholar]
- 44.Jia W, Xie G & Jia W Bile acid-microbiota crosstalk in gastrointestinal inflammation and carcinogenesis. Nat Rev Gastroenterol Hepatol 15, 111–128 (2018). [DOI] [PMC free article] [PubMed] [Google Scholar]
- 45.Yoshimoto S, et al. Obesity-induced gut microbial metabolite promotes liver cancer through senescence secretome. Nature 499, 97–101 (2013). [DOI] [PubMed] [Google Scholar]
- 46.Ferslew BC, et al. Altered Bile Acid Metabolome in Patients with Nonalcoholic Steatohepatitis. Dig Dis Sci 60, 3318–3328 (2015). [DOI] [PMC free article] [PubMed] [Google Scholar]
- 47.Luis AS, et al. Dietary pectic glycans are degraded by coordinated enzyme pathways in human colonic Bacteroides. Nat Microbiol 3, 210–219 (2018). [DOI] [PMC free article] [PubMed] [Google Scholar]
- 48.Hunter DJ Gene-environment interactions in human diseases. Nat Rev Genet 6, 287–298 (2005). [DOI] [PubMed] [Google Scholar]
- 49.Shi Y, et al. A genome-wide association study identifies new susceptibility loci for non-cardia gastric cancer at 3q13.31 and 5p13.1. Nat Genet 43, 1215–1218 (2011). [DOI] [PubMed] [Google Scholar]
- 50.Lloyd-Price J, et al. Multi-omics of the gut microbial ecosystem in inflammatory bowel diseases. Nature 569, 655–662 (2019). [DOI] [PMC free article] [PubMed] [Google Scholar]
- 51.Wegner K, et al. Rapid analysis of bile acids in different biological matrices using LC-ESI-MS/MS for the investigation of bile acid transformation by mammalian gut bacteria. Anal Bioanal Chem 409, 1231–1245 (2017). [DOI] [PubMed] [Google Scholar]
- 52.de Aguiar Vallim TQ, Tarling EJ & Edwards PA Pleiotropic roles of bile acids in metabolism. Cell Metab 17, 657–669 (2013). [DOI] [PMC free article] [PubMed] [Google Scholar]
- 53.Koropatkin NM, Cameron EA & Martens EC How glycan metabolism shapes the human gut microbiota. Nat Rev Microbiol 10, 323–335 (2012). [DOI] [PMC free article] [PubMed] [Google Scholar]
- 54.Rooks MG & Garrett WS Gut microbiota, metabolites and host immunity. Nature reviews. Immunology 16, 341–352 (2016). [DOI] [PMC free article] [PubMed] [Google Scholar]
- 55.Koren O, et al. A guide to enterotypes across the human body: meta-analysis of microbial community structures in human microbiome datasets. PLoS Comput Biol 9, e1002863 (2013). [DOI] [PMC free article] [PubMed] [Google Scholar]
- 56.De Vadder F, et al. Microbiota-Produced Succinate Improves Glucose Homeostasis via Intestinal Gluconeogenesis. Cell Metab 24, 151–157 (2016). [DOI] [PubMed] [Google Scholar]
- 57.De Angelis M, et al. Effect of Whole-Grain Barley on the Human Fecal Microbiota and Metabolome. Appl Environ Microbiol 81, 7945–7956 (2015). [DOI] [PMC free article] [PubMed] [Google Scholar]
- 58.Lloyd-Price J, et al. Strains, functions and dynamics in the expanded Human Microbiome Project. Nature 550, 61–66 (2017). [DOI] [PMC free article] [PubMed] [Google Scholar]
- 59.Franzosa EA, et al. Relating the metatranscriptome and metagenome of the human gut. Proc Natl Acad Sci U S A 111, E2329–2338 (2014). [DOI] [PMC free article] [PubMed] [Google Scholar]
- 60.Mehta RS, et al. Stability of the human faecal microbiome in a cohort of adult men. Nat Microbiol 3, 347–355 (2018). [DOI] [PMC free article] [PubMed] [Google Scholar]
- 61.Willett WC, et al. Reproducibility and validity of a semiquantitative food frequency questionnaire. Am J Epidemiol 122, 51–65 (1985). [DOI] [PubMed] [Google Scholar]
- 62.Rimm EB, et al. Reproducibility and validity of an expanded self-administered semiquantitative food frequency questionnaire among male health professionals. Am J Epidemiol 135, 1114–1126; discussion 1127–1136 (1992). [DOI] [PubMed] [Google Scholar]
- 63.Feskanich D, et al. Reproducibility and validity of food intake measurements from a semiquantitative food frequency questionnaire. J Am Diet Assoc 93, 790–796 (1993). [DOI] [PubMed] [Google Scholar]
- 64.Chasan-Taber S, et al. Reproducibility and validity of a self-administered physical activity questionnaire for male health professionals. Epidemiology 7, 81–86 (1996). [DOI] [PubMed] [Google Scholar]
- 65.Trichopoulou A, Costacou T, Bamia C & Trichopoulos D Adherence to a Mediterranean diet and survival in a Greek population. The New England journal of medicine 348, 2599–2608 (2003). [DOI] [PubMed] [Google Scholar]
- 66.McIver LJ, et al. bioBakery: a meta’omic analysis environment. Bioinformatics 34, 1235–1237 (2018). [DOI] [PMC free article] [PubMed] [Google Scholar]
- 67.Langmead B & Salzberg SL Fast gapped-read alignment with Bowtie 2. Nat Methods 9, 357–359 (2012). [DOI] [PMC free article] [PubMed] [Google Scholar]
- 68.Suzek BE, Huang H, McGarvey P, Mazumder R & Wu CH UniRef: comprehensive and non-redundant UniProt reference clusters. Bioinformatics 23, 1282–1288 (2007). [DOI] [PubMed] [Google Scholar]
- 69.Buchfink B, Xie C & Huson DH Fast and sensitive protein alignment using DIAMOND. Nat Methods 12, 59–60 (2015). [DOI] [PubMed] [Google Scholar]
- 70.Caspi R, et al. The MetaCyc database of metabolic pathways and enzymes and the BioCyc collection of pathway/genome databases. Nucleic Acids Res 44, D471–480 (2016). [DOI] [PMC free article] [PubMed] [Google Scholar]
- 71.Ye Y & Doak TG A parsimony approach to biological pathway reconstruction/inference for genomes and metagenomes. PLoS Comput Biol 5, e1000465 (2009). [DOI] [PMC free article] [PubMed] [Google Scholar]
Associated Data
This section collects any data citations, data availability statements, or supplementary materials included in this article.
Supplementary Materials
Data Availability Statement
All the microbiome data are previously published28,60 and publicly available (https://www.nature.com/articles/s41564-017-0084-4#Sec22). All the meta data from the Health Professionals Follow-Up Study are available through a request for external collaboration and upon approvals of a letter of intent and a research proposal. Details for how to request an external collaboration with the Health Professionals Follow-Up Study can be found at https://sites.sph.harvard.edu/hpfs/for-collaborators/. Harvard University Food Composition Database is publicly available at https://regepi.bwh.harvard.edu/health/nutrition/. Figures 2–5, Extended Data Figures 1–10, Supplementary Tables 1 and 3–8, and Supplementary Figures 1 and 2 are associated with the microbiome and metadata.


