

Abstract
The rise in available longitudinal patient information in electronic health records (EHRs) and their coupling to DNA biobanks has resulted in a dramatic increase in genomic research using EHR data for phenotypic information. EHRs have the benefit of providing a deep and broad data source of health-related phenotypes, including drug response traits, expanding the phenome available to researchers for discovery. The earliest efforts at repurposing EHR data for research involved manual chart review of limited numbers of patients but now typically involve applications of rule-based and machine learning algorithms operating on sometimes huge corpora for both genome-wide and phenome-wide approaches. We highlight here the current methods, impact, challenges, and opportunities for repurposing clinical data to define patient phenotypes for genomics discovery. Use of EHR data has proven a powerful method for elucidation of genomic influences on diseases, traits, and drug-response phenotypes and will continue to have increasing applications in large cohort studies.
Keywords: phenotyping, electronic health record, GWAS, PheWAS, biobank, genomics
1. INTRODUCTION
The widespread adoption of electronic health records (EHRs) has raised the possibility of using these data in clinical research. Abundant evidence now supports the idea that the EHR repurposed for research represents a rich data set of a patient’s health trajectory, including diseases, laboratory and radiology tests, and medications and their response, much of which can be hard to acquire in a research setting. Simultaneously, high-throughput methods for genotyping have considerably decreased the cost of genetic discovery while also improving in accuracy and availability. A key component of these are genome-wide association studies (GWAS) and whole genome and exome sequencing technologies, which systematically analyze variation across the genome. Since 2005, over 3000 GWAS have identified almost 40,000 unique SNP-trait associations (1).
The vast majority of early genomic research studies before 2010 were performed using observational cohorts or randomized controlled trial data. Perhaps in part as a result, some of the largest GWAS published have been traits that are common to many studies, such as height and body mass index. Nearly coinciding with the growth of genetic investigation has been the national adoption of EHRs across the United States. The national adoption rate among non-federal acute care hospitals was only 9.4% in 2008 but reached 94% by 2013 (2). The formation of EHR-linked DNA biobanks that repurpose EHR data from their clinical data stores to research-oriented databases, combined with advances in informatics tools and terminologies, led to the beginning of successful EHR utilization for genetic studies in 2010 (3–7) The first EHR-based studies recapitulated non-EHR GWAS by focusing on well-defined clinical phenotypes to test against variation in the human genome but later gave rise to other innovative, reverse-genetics approaches such as phenome-wide association studies (PheWAS), which provide a systematic approach to the analysis of many phenotypes potentially associated with a specific genotype (8).
Critical to discovery through genomic and phenomic investigation is the accumulation of sufficiently large sample sizes with well-defined phenotypes. These phenotypes include specific diseases or observable traits and are used to decipher the genetic determinants of human diseases, physiologic attributes, and medication response. In this review, we highlight the growth of and approaches to phenotyping using clinical data within EHRs as it pertains to genomics research, limitations of these techniques, and future opportunities for integration of genotypic and phenotypic clinical data.
2. USE OF CLINICAL DATA IN RESEARCH
2.1. Cohorts Available for Genetic Study
Traditional genetic studies have used population- or clinical trial-based cohorts with prospective participant enrollment and questionnaires to gather data on specific aspects. While this approach can result in high-quality phenotypes, there are significant challenges due to the time and monetary expense required for participant accrual, retention, questionnaire completion, and validation (9, 10). Patient accrual can take months to years. Further, long-term follow-up and patient retention can be tedious or unfeasible, with exclusion of populations of patients important to include, such as those too ill to participate or at the extremes of age. Prospective cohorts are also generally guided by a particular clinical research question, and thus phenotype data may be limited to those conditions, hindering reuse of these data for future studies examining different phenotypes.
Accordingly, EHRs have emerged as an efficient method for obtaining dense patient information for research over the last two decades. Historically, clinical data and documentation has been collected primarily to support patient care and administrative functions, such as billing. Thus, cross-sectional aggregation and querying of EHR data was not a priority. In 2003, the National Academy of Medicine (then the Institute of Medicine) released a report on the key capabilities of an EHR, noting that facilitating research is an important secondary use of EHRs (11). Early studies utilizing aggregated EHR data often consisted of epidemiological studies performed at early EHR adoption sites with well-maintained databases such as the Veterans Health Administration or UK general practice research database (12–14). Recent efforts bringing together diverse international healthcare data have been able to study treatment protocols in as many as 250 million individuals (15). Some examples of network initiatives utilizing EHR data for genomic research are detailed below.
2.2. Current Biobanking Efforts
Biobanking of genetic data linked to the longitudinal patient data available within the EHR aggregates otherwise disparate information, potentially making it available to both clinicians and researchers. Some of the earliest biobanks linked to EHR data derived their samples from left over blood collected as part of clinical care, and would have otherwise been discarded (9). These include the Harvard Crimson, which pursued as-needed sample collection for phenotypes of interest, and Vanderbilt University Medical Center’s BioVU, which started as a prospective collection of all individuals who did not opt-out of DNA collection as part of their routine consent to treatment (16, 17). Since 2015, BioVU has converted to an opt-in consent model (electronically requested at the point of care) due to changes in the National Institutes of Health (NIH) Genomic Data Sharing policy requiring subject consent for data sharing (18).
Several other initiatives have been launched across the world for the development of very large EHR-linked biobanks which have started to deliver biomedical data sets comprising extensive phenotype and genotype information on hundreds of thousands of subjects. In the United States, the Electronic Medical Records and Genomics Network (eMERGE) and the Million Veteran Program (MVP) represent examples (19, 20). The MVP has recruited more than 580,000 participants and is establishing a longitudinal study of Veterans for future genomic and clinical research that combines data from survey instruments, the EHR, and biospecimens (20).
One of the more robust EHR phenotyping efforts has been performed by the eMERGE consortium, a national network organized and funded by the National Human Genome Research Institute with the goal of combining DNA biorepositories with EHRs for high-throughput and generalizable genomic discovery. An integral aim of eMERGE is to support the creation, validation, and dissemination of phenotype algorithms by providing tools that guide the user through the stages of development, public sharing, and reuse (21).
In Europe, the UK Biobank is a large prospective study of more than 500,000 individuals to investigate the role of genetic factors, environmental exposures, and lifestyle in the causes of major diseases (22). Participants aged 40–69 years were enrolled over 4 years in 22 recruitment centers, each completing questionnaires and donating biospecimens. The emphasis is now on further phenotyping of participants and ascertaining their health outcomes through follow-up and linkages to healthcare-based datasets (23). In Asia, the China Kadoorie Biobank also has more than 500,000 individuals and has prospectively linked genomic information to both EHR data and participant surveys.
The All of Us Research Programa is a NIH-funded initiative to build a United States research cohort of more than one million individuals, including prospective participant provided information, molecular data (including genomics), and linkage to health information in EHRs (24). Participants will be recruited from diverse healthcare centers located across the country and as “direct volunteers”, individuals who may not have a direct connection with a recruiting healthcare system.
3. REPURPOSING OF EHR DATA
3.1. Rationale for use of Clinical Data for Genomics Research
EHRs offer longitudinal patient information in a form that is relatively unbiased to particular diseases or research agendas, allowing for study of diverse genomic risk, diseases, and outcomes. The rich phenotypic clinical documentation coupled with laboratory data, medication receipt, family history, and environmental exposures, makes the EHR a practical data source for reuse in genomic studies. The key advantage of repurposing EHRs for research is that they are already created and maintained for healthcare delivery and prospectively accrue clinical observations and costly tests at regular intervals driven by an individual’s health trajectory.
To quantify the density of information in the EHR, we explored the data available for BioVU participants (Figure 1). We found that individuals had an average of 7.8 years of clinical data, including many years before enrollment and up to 33 years of longitudinal recorded information. Much of these data are costly and may be infeasible to collect for a research trial. For example, consider the cost to obtain and clinically interpret the 3.4 million radiology tests (~14 radiology tests per patient) presented in Figure 1; these included over 628,000 computed tomography (CT) scans and nearly 192,000 magnetic resonance imaging (MRI) scans, all with clinical interpretations. Assuming a conservative estimate of $500 per test, these CT and MRI scans alone would cost $410 million. Thus, there is a significant reduction in research time and expense for accrual of large sample sizes with a breadth of clinical data (9, 25).
Figure 1. Density of data in the Vanderbilt EHR-linked biobank, BioVU.
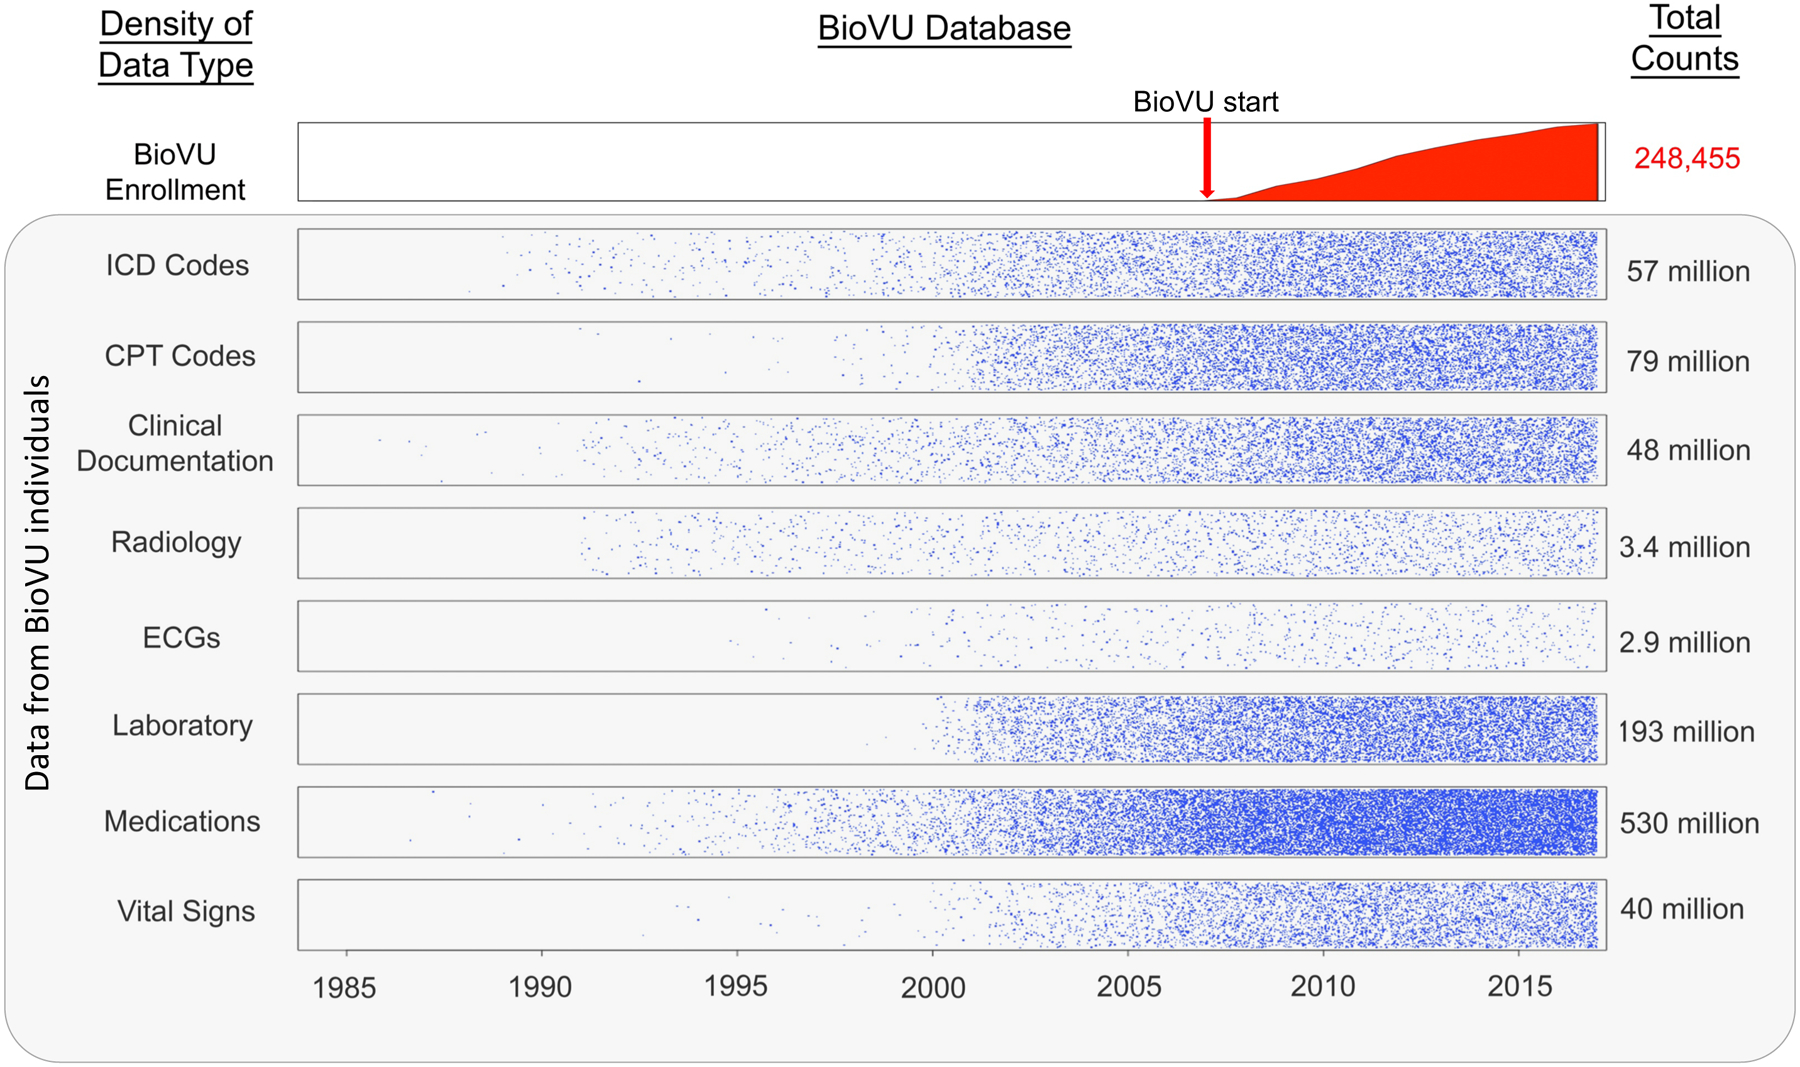
While enrollment in BioVU and accrual of samples for DNA analysis started in 2007, clinical data within the electronic health record on the individuals enrolled dated as far back as 1984. Data points were transformed by taking the square root and dividing by 20.
Another potential benefit of linking DNA repositories to EHRs is the inclusivity of EHRs in comparison to traditional population-based cohorts, which often will exclude certain diseases, children, minority or poor populations, and the elderly. This is critical for both identification of a range of cases as well as controls. Because EHR-based cohorts provide significant variability in phenotypic traits, a single cohort can be reused many times for many phenotypes or genetic variants examined (9, 26). Once the genetic data have been collected, the majority of cost and effort is thus expended at defining, refining, and validating phenotypes of interest.
Large sample sizes for modern genetic research methods, such as GWAS and PheWAS, are critical to the discovery of novel findings and afforded by the EHR (27). For both GWAS and PheWAS, there is a need to correct for multiple comparisons, increasing the threshold for statistically-significant results. For GWAS, the threshold has been established at 5×10⁻⁸ (28). While the threshold for statistical significance is less well-established for PheWAS, a Bonferroni correction is often applied in these analyses, resulting in a conservative significance level that assumes independence across all phenotypes, which is unlikely given that many phenotypes of human diseases and traits are closely related. Since statistical power is a function of number of tests performed, effect size (often low for many variants), and minor allele frequency, use of this stringent threshold has necessitated use of larger and larger cohorts to enable identification of significant associations, especially those that are rare or low-frequency variants of moderate-to-large effect.
3.2. Classes of Data Available in EHRs for Phenotype Curation
EHR phenotyping is the process of identifying individuals with an explicit observable trait from large quantities of imperfect clinical patient data (Figure 2) (29). The earliest approach to phenotyping is via manual chart review, typically performed by thorough searching of clinical documents, laboratory, and medication information by individuals with medical domain knowledge. For automation of phenotyping, EHR data, which is stored in both structured and unstructured formats, is extracted and utilized for analysis (Table 1). Structured data is typically easier for computerized extraction, with examples being billing codes, laboratory results, vital signs, and often medications. A large proportion of the EHR is relatively unstructured, including almost all clinical documentation, radiology reports, and some test or laboratory results. For many phenotypes, accurate case selection is best achieved through use of a combination of structured and unstructured data (10).
Figure 2. Methods of electronic health record (EHR)-based phenotyping.
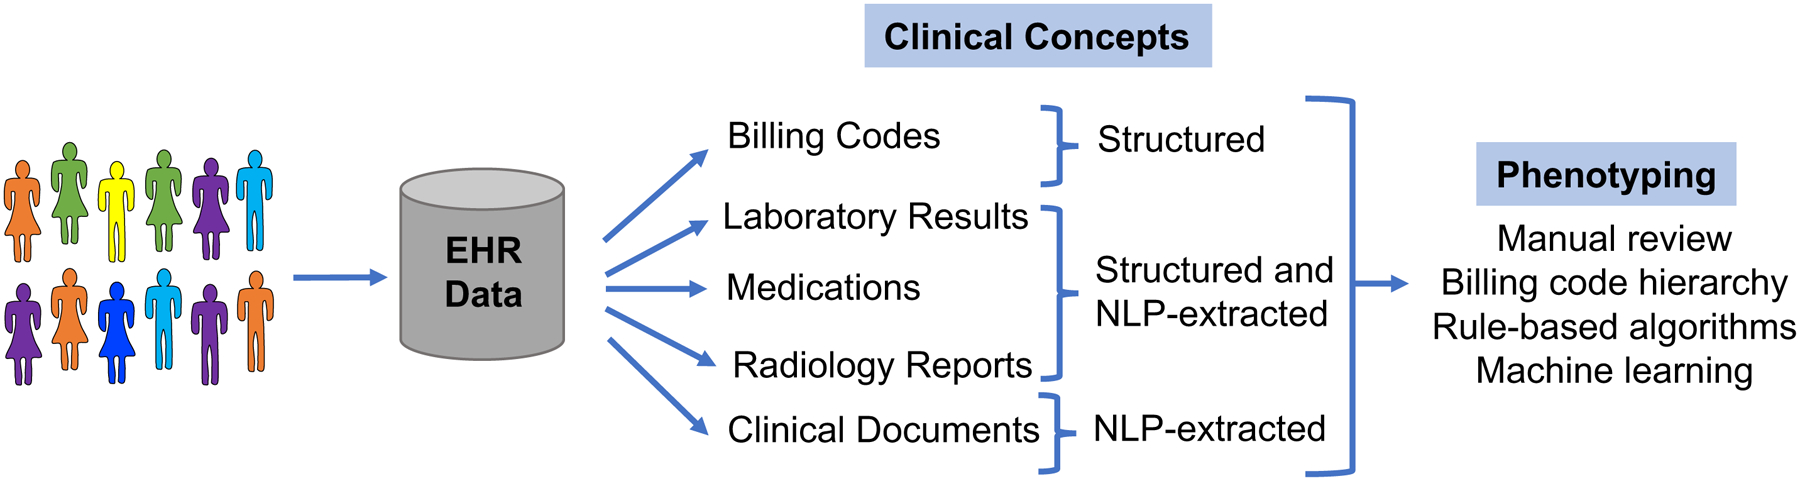
Clinical concepts are in both structured and unstructured (require machine-extraction) in the EHR. These concepts can be used for various forms of phenotyping.
Table 1.
Common data classes within electronic health records (EHRs)
| Demographics | Diagnoses | Procedures | Medication records | Laboratory results | Imaging | Clinical text documentation | |
|---|---|---|---|---|---|---|---|
| Data format | Structured | Structured | Structured | Partially structured | Mostly structured | Partially structured | Mostly unstructured |
| Data standard | None | ICD9/10 | CPT | RxNorm | LOINC | DICOM for images | SNOMED-CT |
| Query method | Simple | Simple | Simple | Simple, text searching, NLP | Simple, text searching | Simple, text searching, NLP | NLP |
| Recall | Moderate | Moderate | Variable | Moderate | Moderate | Moderate | Moderate |
| Precision | Moderate | Low | High | Moderate | High | High | High |
| Affected by healthcare fragmentation | No | Low/moderate (chronic) to high (acute) | High | Moderate | High | High | Moderate |
| Strengths | Easy to query | Easy to query | Easy to query | High validity for inpatient setting | High validity | High validity | Most dense clinical information; can capture out-of-hospital history |
| Weaknesses | Variable recall and precision based on demographic | Susceptible to inaccuracies | Susceptible to missing data | Susceptible to missing data | Variable recall and precision based on test; susceptible to missing data | Susceptible to missing data; difficult to process raw images | Most difficult to process and interpret at scale |
| Used in Phenotyping | Most common | Most common | Common | Common | Somewhat common | Somewhat common | Less common |
CPT, Current Procedural Terminology; DICOM, Digital Imaging and Communications in Medicine; ICD-9/ICD-10, International Classification of Diseases, Ninth Revision/Tenth Revision; LOINC, Logical Observation Identifiers Names and Codes; SNOMED-CT; NLP, Natural Language Processing; Systematized Nomenclature of Medicine-Clinical Terms
Billing data are the most commonly used resource for identifying phenotypes in both clinical and genomic research (21, 30). This structured data typically consists of International Classification of Diseases (ICD) and Current Procedural Terminology (CPT) codes. The ICD coding system classifies diseases, symptomatology, and procedures based on a hierarchical terminology structure maintained by the World Health Organization (WHO). CPT codes were created by the American Medical Association, and are used to bill for clinical services, such as an imaging study or surgical procedure. Both classes of billing data are ubiquitous and easily queried within EHRs, making them highly utilized as at least a portion of most phenotyping algorithms. A query of the data types used in phenotyping algorithms in the Phenotype Knowledgebase (www.pheKB.org) shows that 122 of 154 (73%) algorithms used ICD codes (Table 2), all of which used ICD-9 codes and 26 that used both ICD-9 and −10 codes. This demonstrates one challenge of using billing codes within longitudinal patient information as coding systems change over time, such as the migration from ICD-9 to ICD-10 coding in 2015 in the US, resulting in the need for mapping strategies to combine codes from different systems. Sensitivity and specificity of billing codes alone are variable across phenotypes, with one study showing a range of positive predictive values (PPVs) for ICD codes from 0.12 to 0.56 across ten diseases (29). ICD codes generally have low specificity but are highly sensitive for diseases, as a clinician may bill an ICD code for a diagnosis based upon clinical suspicion rather than confirmation of disease (31). CPT codes tend to have higher specificity, as procedural coding is quite accurate, but lower sensitivity in comparison to ICD codes due to procedures being performed at other institutions, demonstrating fragmentation of EHR data (32).
Table 2. Data modalities used in phenotyping algorithms available on PheKB.
Data as of 10/15/2017. Non-public algorithms include algorithms in development and those whose performance has not yet been validated.
| Public (n = 44) | Non-public (n = 110) | Percent of total | |
|---|---|---|---|
| ICD-9 or −10 codes | 39 | 73 | 73% |
| Medications | 31 | 51 | 53% |
| CPT codes | 23 | 44 | 44% |
| Natural language processing | 28 | 36 | 42% |
| Laboratory test results | 21 | 37 | 38% |
| Vital signs | 5 | 14 | 12% |
ICD-9/ICD-10, International Classification of Diseases, Ninth Revision/Tenth Revision; NLP, Natural Language Processing; CPT, Current Procedural Terminology
Other types of structured data within the EHR, such as laboratory results and medications, are also often used to identify phenotypes (Table 2). In particular, 53% of algorithms available on PheKB utilize medication data. Record of medication receipt can be in various forms in the EHR; however, inpatient computerized provider order entry systems and outpatient drug prescribing systems have increased the availability of drug exposures as structured data. Medication data in the absence of corroborating evidence has not been found to be especially useful, with area under the receiver operator characteristic curve (AUC) of 0.54 for 10 diseases (29). Importantly, the capture of medications is essential to provide exposure data for pharmacogenomic studies (31, 33). Challenges to analyzing laboratory data in particular include the repeated measures, naming conventions, and various specimen sources, resulting in difficult interpretation. While laboratory and medication data must be placed into appropriate clinical context with careful selection, they can improve phenotyping accuracy for many conditions.
The main source of unstructured data within the EHR is clinical documentation, consisting of the most accurate record of the providers’ thoughts and richest information for phenotype algorithms. To be useful for electronic-based phenotyping, clinical documentation must be in a format that is computable. The majority of clinical notes consist of narrative text, lacking uniform format or structure, thus they must be processed with either basic keyword searching or modern tools such as natural language processing (NLP), discussed further in the next section.
3.3. Processing of EHR Text Data
Narrative clinical documentation includes a wealth of information about diagnoses, signs and symptoms, risk factors, treatments, family history, exposures, and clinical decision making, many of which are not well captured by structured information in most EHRs. Indeed, the gold standard in validating whether a patient has a diagnosis or a given trait generally involves a review of the clinical notes (30). NLP is a tool for producing computable representations from this narrative unstructured text (34). There are many approaches to NLP, ranging from rule, grammar, and machine learning (ML)-based approaches for producing comprehensive “understandings” of the text (so-called “general-purpose” NLP systems (35–40)) to focused applications applied to particular tasks (e.g., identifying medications and their features (41), or left ventricular ejection fraction (42)). General-purpose NLP systems often seek to parse unstructured text documents into phrases that can be mapped to concepts within controlled terminologies such as the Unified Medical Language System (UMLS), the Systematized Nomenclature of Medicine-Clinical Terms (SNOMED-CT), or RxNorm (for medications) (37, 41, 43–46). Mapping the textual elements within clinical free-text documents to a semantic terminology provides a standardized method to represent the data for downstream computation. Other tasks that often improve the performance of NLP systems include identification of negation and qualifiers (47), semantic role labeling (48), word sense disambiguation (49), and temporal analysis (50).
Some important clinical features often have historically only been found in narrative data, such as family history and smoking status. Smoking status has been the focus of many dedicated rule-based, ML, and hybrid NLP systems with F-measures ranging from 84–97% (38, 51–53). NLP also has the capacity to identify family history information with variable accuracy in prior studies (54–57). Identifying these important features within clinical documents allows the features to be reused and add meaningful information to diverse research studies. The introduction of Meaningful Use Stages 2 and 3 with the requirement for structured data entry for smoking status and family history will make these data more available over time with NLP tools (58, 59). Further, functionality such as Duke University’s MeTree, which allows a patient to complete his or her own family history, are providing new avenues for increased entry of structured information in the EHR (60, 61).
Performance for concept extraction varies with recall and precision ranging from 70–90%, depending on the specific application of the NLP (36–38, 44, 62). For this reason, EHR-based phenotyping algorithms have typically combined NLP features with other data components. Specific phenotypes such as adverse events and diseases can be successfully extracted using NLP (63–68), with several studies reporting higher predictive capability for case identification through NLP (either alone or in combination with other methods) in comparison to use of billing codes alone (19, 32, 34, 64, 69, 70). Researchers have used both general-purpose NLP systems and focused applications, but the latter have become more common, since most phenotype algorithms do not need to identify all concepts but instead require a high-precision text mining approach to identify a set of terms applicable to specific concepts. For example, nearly all Vanderbilt phenotypes involving medications have employed a general-purpose NLP tool for medication extraction (MedEx) (41), but we have used a mix of regular expressions, general-purpose NLP tools (66, 71), or ML-based approaches for specific phenotypes (72). While general-purpose NLP systems can be utilized across a range of phenotypes, they also generally have inferior recall and precision to purpose-built approaches for defined phenotypes. Further, while NLP methods have significantly improved in the ability to identify negation and sentence structure, these algorithms remain imperfect and secular shifts in documentation, such as the transition from use of dictation to typed templates to “point-and-click” note writers, can result in instability of algorithm performance.
3.4. Challenges of Repurposing EHR Data for Research
While EHRs contain a wealth of extractable information for phenotype classification, their interface and the data generated within them are used primarily for clinical care and reimbursement, typically with little consideration towards research impact. The secondary use of EHRs for clinical, genomic, and pharmacogenomics discovery can be challenged by variable accuracy, lack of standardization, irregular follow-up, incompleteness of patient records, and significant amounts of unstructured information. Inaccuracy within EHRs can result from clinical uncertainty, omissions, or billing errors. Omission can occur due to provider workload and perceptions on what is deemed to be clinically relevant to report at the time of the encounter. Due to the lack of EHR centralization, the length and depth of a patient’s record can vary greatly due to when a patient inhabits a region, what insurance the patient carries and the hospital accepts, and where a patient receives his or her care, with patients often seeing multiple disconnected providers within a region. One study to evaluate the effect of potential data fragmentation on the accuracy of a phenotyping algorithm for type 2 diabetes found that almost one-third of cases were missed if EHR data from only a single site was used (73). While completeness of the EHR is difficult to define, it is important for researchers to understand the likely limitations of the data and how it may affect study findings (74).
4. APPROACHES TO IDENTIFYING PHENOTYPES IN THE EHR
Large-scale, efficient phenotyping methods that utilize data within the EHR provide benefits that are not limited to genomic studies. Phenotyping is crucial to the identification of a population of patients that satisfy a set of criteria, which is important for clinical trial recruitment, retrospective cohort or outcomes studies, and cost analyses, among others. However, identification of patients that belong in a particular cohort is time-consuming and challenging. Different approaches to automated phenotyping have been pursued; we describe the most frequent and promising (Figure 3, Table 3).
Figure 3: Phenotyping methodological approaches differ in their clinical and informatics resources needed.
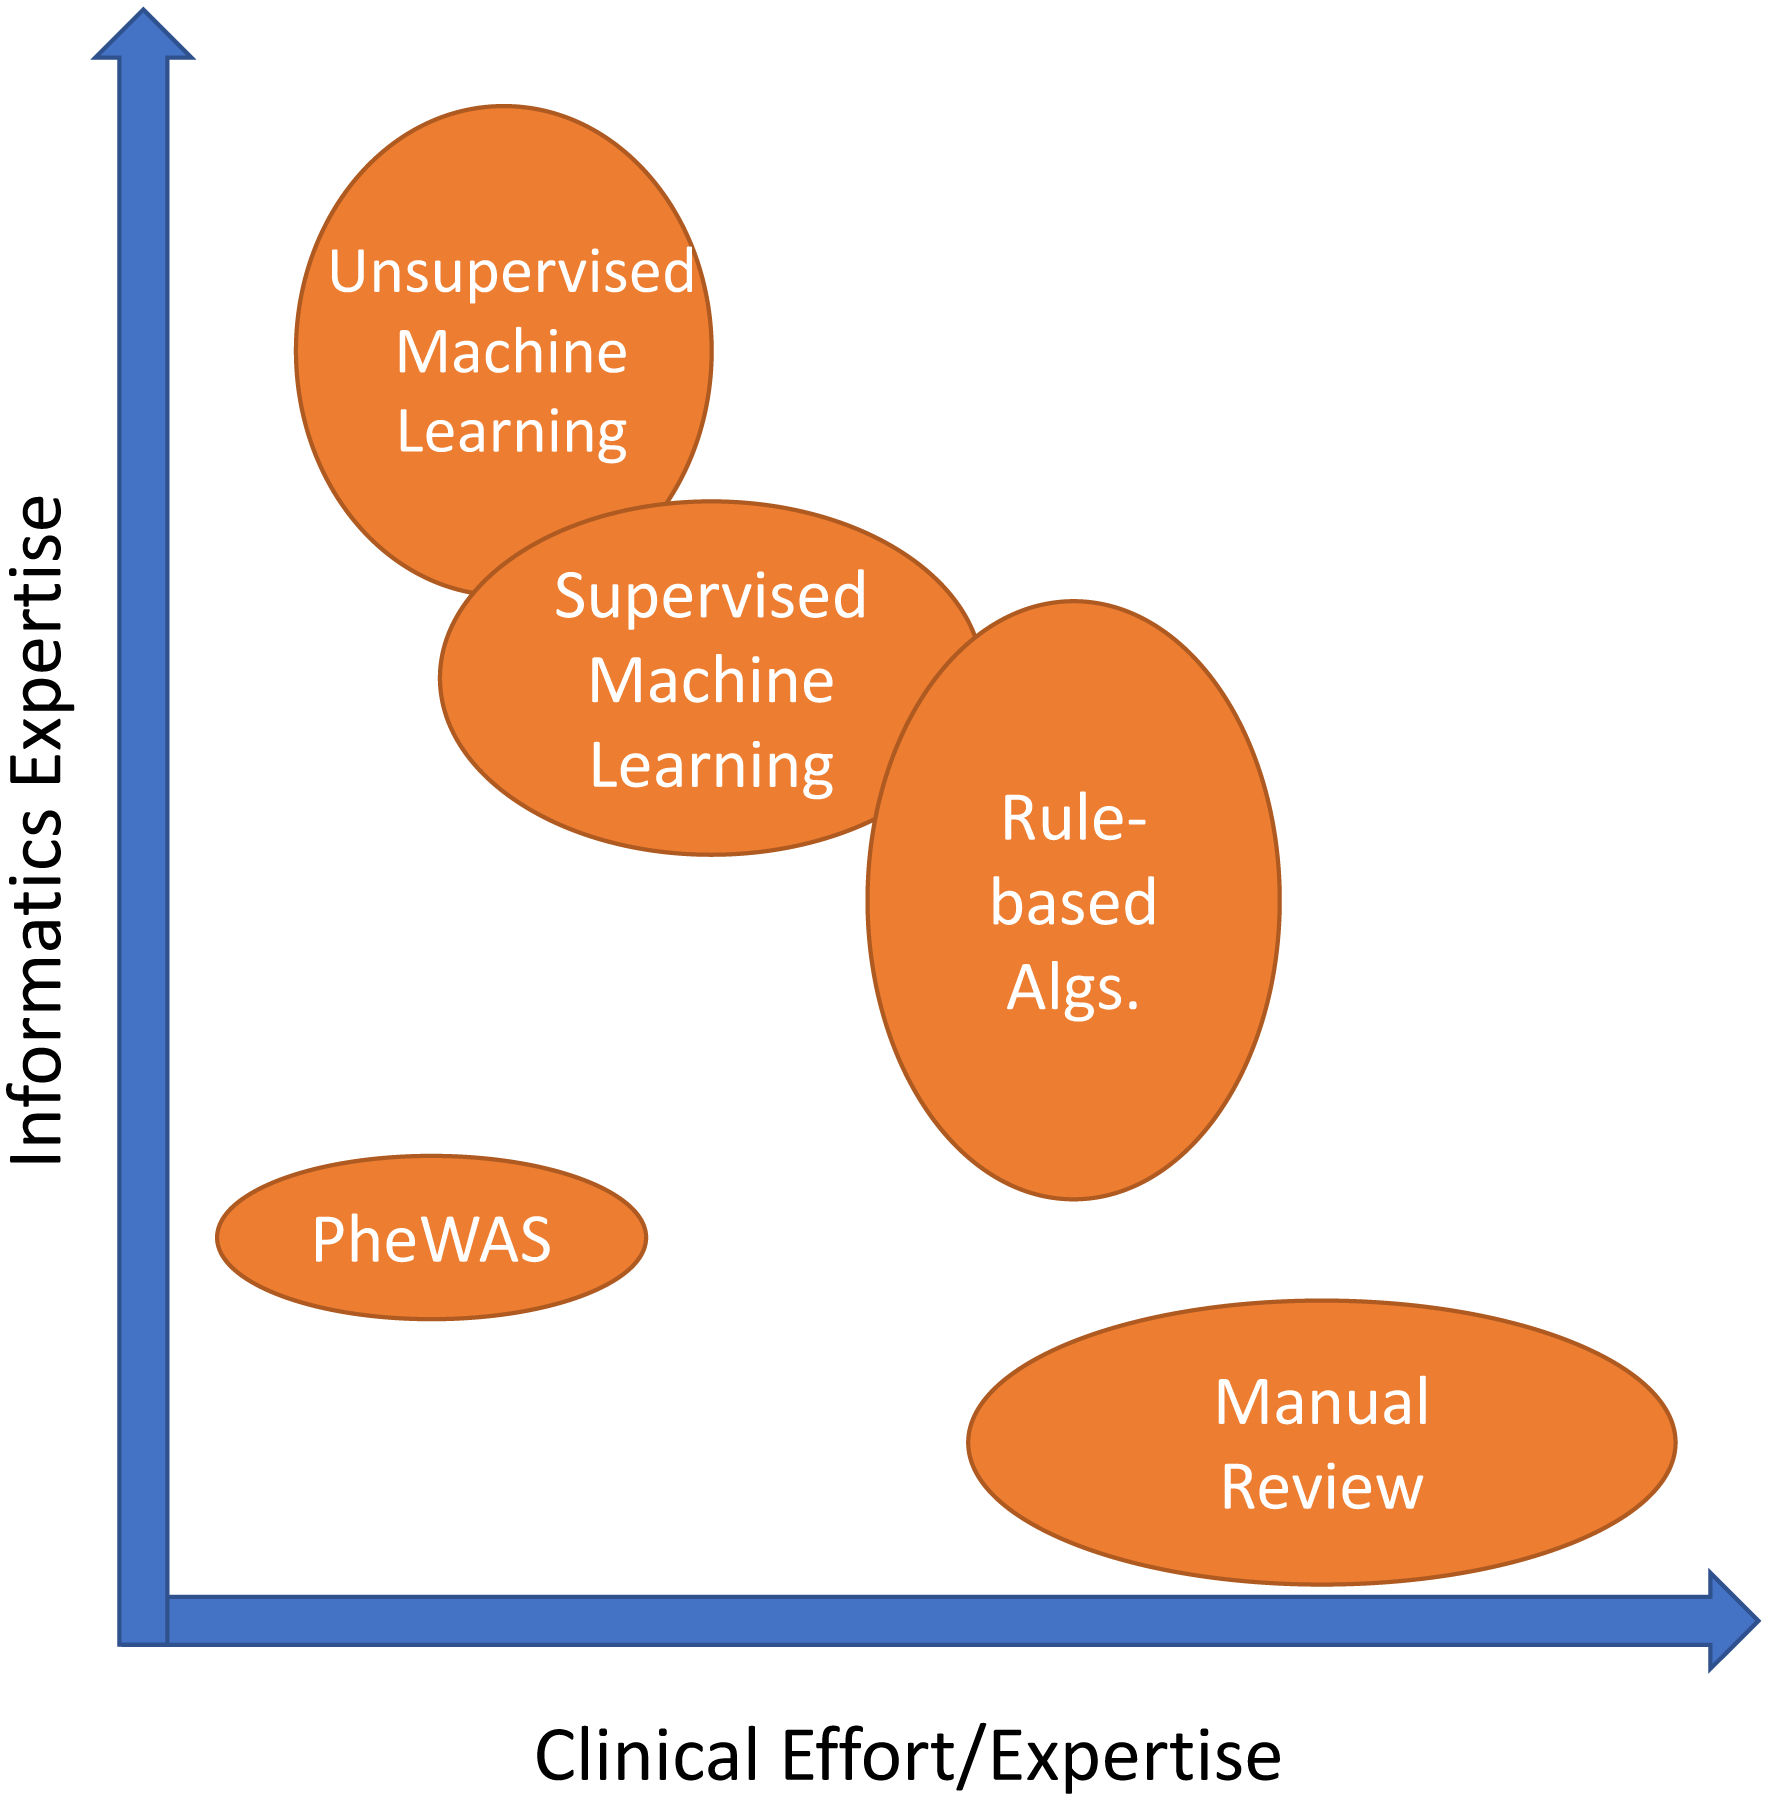
The width/height of each oval represents the range of that type of resource needed.
Table 3.
Strengths and Weaknesses of Current Phenotyping Approaches using Electronic Health Records (EHRs)
| Manual chart review | Rule-based computerized phenotyping | Supervised machine learning | Unsupervised machine learning | Phenome-wide approaches (PheWAS) | |
|---|---|---|---|---|---|
| Description | Clinician review of medical records | Manually-created Boolean logic | Classification based on a set of features | Phenotypes learned through clustering of computer-identified features | Systematic analysis of many phenotypes, usually using very simple rule-based approaches |
| Data variables | Can be used to narrow records for manual review | Structured data, NLP | Structured data, NLP | Any | Most commonly billing codes but can be lab or NLP |
| Recall | High | Variable | Variable | Variable | High |
| Precision | High | High | High | Variable | Variable |
| Costs | High | Moderate; major cost is in algorithm development | Moderate; major cost is in creating training set | Moderate; usually needs very large data collections and computing resources | Low |
| Scalability of cohort size | Poor; costs directly proportional to N | High | High | High (large cohorts required) | High |
| Scalability of phenotype number | Poor | Poor | Poor | High | High |
| Transportability | High | Variable but often high | Variable; often less than rule-based | Variable; often less than rule-based | High |
| Expertise Required | Clinical domain knowledge | Clinical domain knowledge and informatics support | Clinical domain knowledge and informatics support | Little to no clinical domain knowledge, significant informatics support needed | Little to no clinical domain knowledge, minimal informatics support needed |
| Strengths | High validity, considered gold-standard; little informatics support needed | High validity; Ease of interpretation | Typically less costly than manual review | Can identify unspecified phenotypes; Unbiased; No domain expertise or manual review | Ascertain broad range of phenotypes; can be used for very large populations |
| Weaknesses | Significant knowledge and time required | Requires iterative algorithm development and manual review; Domain and informatics expertise needed | Require manually classified training sets; may require expert feature selection | Potentially poor interpretability or irrelevant findings if not coupled with supervised approaches | Often phenotype detail and accuracy limited by billing codes |
| Current use | Idea for small cohorts and validation for computational methods | Often used in GWAS for single phenotypes | Often used in GWAS for single phenotypes | Rare, but increasing for identifying phenotypes from unstructured data | Hypothesis generation; drug repurposing; interpretation of novel genomic loci |
PheWAS, Phenome-wide association studies; NLP=natural language processing
4.1. Logical Constraint-Based Approaches
The earliest automated approach applied to recognize patients with a particular phenotype of interest is through the use of Boolean logic. The simplest example of this is utilizing hierarchical billing code structures to determine cases and controls, as is performed in a standard PheWAS analysis. However, more commonly these phenotype algorithms are more complex, manually-curated, and based upon rules applied in a step-wise fashion (75). Similar to the manner in which a content expert would determine case status, the logical constraint-based algorithms incorporate information from various sources of the EHR, including billing codes, clinical documents, laboratory data, and medication exposures.(19) Structured data, either data that is extracted from the EHR in structured way or is processed into a standardized format using methods such as NLP, are necessary as input for the algorithm.
Construction and validation of Boolean algorithms are typically an iterative process with collaborations between clinical domain experts, bioinformaticians, clinical informaticians, NLP experts, and genomics researchers. Clinical experts are typically required for creation of the algorithm itself, and manual effort is required for review of at least a subset of the case and control cohorts classified by each algorithm to ensure the algorithm’s accuracy. The time and effort required is extremely phenotype dependent as the algorithms can vary from fairly simple to very complex. For example, the number of rules in an algorithm can differ dramatically: a 2012 review of 9 phenotypes found that algorithms contained between 8 and 174 rules for case identification (76).
Logical constraint-based approaches to phenotyping have several advantages. The most profound benefit is that they are the simplest to interpret and implement, allowing them to be more readily replicable and transferable across different EHRs or clinical enterprises (21, 26, 66). In 2011, a GWAS was performed to identify associations with primary hypothyroidism using a phenotyping algorithm developed at a single site and implemented to be transportable across EHRs and institutions (26). This algorithm incorporated billing codes, laboratory values, text queries, and medication records within five separate EHRs. Overall, the algorithms’ PPVs were 92.4% and 98.5% for cases and controls, respectively. For the controls, PPVs at all sites were above 95%, while PPV for cases as varying sites ranged from 82–98%, with the lowest PPV mainly due to misclassification of individuals who had undergone thyroidectomy elsewhere or in the distant past. Experience has shown that algorithms developed for identification of rare phenotypes or those including only billing codes for case determination typically have the poorest performance.
These algorithms work well for circumstances in which high validity is needed for a single phenotype for a disease or simple trait that may need to be applied across multiple institutions. The ease of interpretation makes logical constraint-based algorithms attractive to clinicians, and thus research results potentially more translatable to clinical practice, and they can easily be applied to large data sets. The principal limitation is that a new algorithm needs to be created for each new phenotype pursued.
4.2. Machine Learning (ML) Approaches to Defining Phenotypes
ML-based algorithms have been proposed as a method to achieve the improved accuracy and breadth needed to scale phenotype annotation. ML approaches can automate the identification of complex patterns to classify individuals into different groups, such as a case or control for a given phenotype. The traditional approach to ML is that of supervised learning, in which an expert creates a “gold standard” of classified individuals and a feature set used for determination and then the trained algorithm can be used to make predictions on unlabeled examples (77). When individuals are not labeled into groups, an unsupervised learning approach can be applied, which attempts to find natural clusters or patterns of data and individuals. An unsupervised approach can also be used for feature extraction and then tested against an annotated outcome of interest for creation of the classifier (which can be viewed as a type of supervision). Fully unsupervised ML requires no need for domain expert annotation or feature selection, thus this approach is high-throughput and scalable but also can lead to greater difficulty in interpretation.
4.3. Supervised Machine Learning
Supervised ML requires a set of training examples belonging to either a phenotype case or control and then can build a model that can be used on other examples for classification. Several different methods can be used for supervised ML, such as support vector machines (SVM) (66, 72, 78, 79), logistic regression (66, 80), random forests (70), or neural networks (81, 82).
While supervised ML has been shown to be extremely effective for individual tasks, the requirement for manual annotation, a time-consuming and costly process, and feature selection results in limited scalability (83). The conventional approach to building a set of annotated samples is to select a random pool of individuals to manually classify. Active learning approaches to ML-based phenotyping can potentially overcome the need for large annotated datasets. Chen et al. demonstrated the use of an uncertainty sampling algorithm to find and annotate only the most informative samples, those samples with the most uncertain features (83). This approach achieved similar classification results with annotation of a fraction of samples compared to the use of a randomly annotated set. ICD-9 codes have been used as a surrogate for defining training cases and controls to limit manual input; however, this confines phenotypes to those defined by billing codes (79, 84).
Feature selection is the technique of selecting a subset of potential terms or features to use in the ML model. ML-based classification algorithms can incorporate a range of features, including billing data, clinical documentation extracted with NLP, semantic terminologies, medication exposures, and laboratory data. Features can either be chosen from a set of all potential clinical concepts or from a refined set through application of algorithms (e.g., using univariate statistical associations, ML approaches, or penalized regression models) or by domain expert curation. Potential features within the EHR are vast, and for many phenotypes, it is impractical to find an optimal subset of features using manual approaches. Prior studies have suggested the use of unrefined feature sets including all clinical concepts to reduce the domain knowledge required for phenotyping (72). While this provides effective performance for some phenotypes, algorithms using unrefined feature sets typically have lower accuracy than those using expertly curated features, unless very large training sets are used. Bejan et al. proposed statistical feature selection by ranking features based upon their association with a case or control to improve algorithm performance for phenotype identification of pneumonia (85). Yu et al. created the Automated Feature Extraction for Phenotyping (AFEP) approach for disease phenotyping by using NLP applied to knowledge sources (such as Medscape and Wikipedia) to develop medical concepts relevant to a disease followed by concept screening, in which concepts that were either too rare, too common, or not relevant enough were excluded from the feature sets in automated ways (86). AFEP algorithms achieved accuracy comparable to the use of expert-curated feature sets for rheumatoid arthritis and coronary artery disease.
Another approach to limit the need for manually engineered features is to use deep learning. Deep learning allows for the construction of a hierarchy of progressively complex feature layers, with transformation into more abstract representations at higher levels by training a neural network. The key aspect of deep learning is that these layers of features are not designed by domain experts, and rather they are learned from the data (87). Gulshan et al. applied supervised deep learning to more than 128,000 images of patients with diabetic retinopathy along with controls, with the development of algorithms that identified diabetic retinopathy with similar performance to ophthalmologists (AUC of 0.99) (81). Similarly, Esteva et al. used deep neural networks for automated classification of skin lesions, demonstrating the capability of identifying skin cancer with performance comparable to dermatologists (82).
In an early demonstration of deep learning neural networks applied to longitudinal health data, Lasko et al. applied an unsupervised feature learning approach to produce phenotypic features from uric-acid measurements for inputs in a supervised logistic regression classifier, and the model was capable of accurately distinguishing (with an AUC of 0.97) between gout and acute leukemia (88). A unique aspect of this study was managing the variable representation of time intervals, since labs are taken at irregular intervals for patients. Lab values for unobserved times were estimated using Gaussian probability distributions to allow drawing of continuous curves that formed the learned features from the deep learning model.
An important limitation of supervised ML is that the methods require training sets labeled with the phenotypes that they will “learn” to find. Thus supervised learning can be successful in finding patterns that explain phenotypes we have the knowledge to label, but not when we don’t have the knowledge or ability to label the phenotypes and rather aim to discover phenotypes from the data (88).
4.4. Unsupervised Machine Learning
Unsupervised ML has demonstrated success using an unbiased approach towards phenotype discovery. This method could conceivably identify all phenotypes in a data set, including disease subtypes, medication response or adverse events, and previously unrecognized disease patterns. There are several types of unsupervised ML methods, including clustering, dimensionality reduction techniques, and tensor factorization. Prior studies have used unsupervised ML and hierarchical clustering to learn subphenotypes (or sets of comorbidities that group together) of autism (89, 90). Others have used clustering methods to identify distinct phenotypes of bicuspid aortic valves (91) and bronchiectasis (92). Nonnegative tensor factorization has also been shown to have the ability to capture diverse multi-attribute phenotypes consisting of combinations of diagnoses and medications with over 80% found to be clinically meaningful (93).
Unsupervised ML-based approaches may have the potential to scale phenotype classification to thousands of phenotypes in a computable and accurate way. The limitation of unsupervised ML models is their difficulty with interpretability, necessary for wide adoption by clinical providers (94). Further, ML-based algorithms are only as useful as the features used for classification, thus ontologies and advancement of NLP techniques will continue to improve their predictions as well.
5. PHENOTYING FOR GENOMIC RESEARCH
5.1. Phenotype Creation, Validation, and Implementation for Genomic Research
Phenotype creation and validation is often an iterative process and critical step in determining the success and scalability of the phenotype as shown in Figure 4 (30). Phenotype accuracy has been shown in several studies to improve with combinations of data within phenotype algorithms (29, 34, 70). Even simply adding the requirement of 2 or more ICD codes can significantly increase PPV and sensitivity of algorithms; however, inclusion of EHR components, such as medication records and clinical notes, often results in further phenotyping performance improvement (29). Following initial creation and execution of the algorithm at the development site, it is important to validate the results at the primary site before executing at subsequent sites. Validation is typically performed by manual review of a subset of clinical records, and can be achieved by either an “expert review” by a seasoned clinician who reviews the clinical record to determine holistically if the patient meets the case definition or not (e.g., does the patient clinically appear to be diagnosed by appropriate clinicians with the disease of interest) or using formal case review algorithms, which specify finding a number of elements in the chart to verify the case is truly a case. The latter may be particularly important for more precise phenotypes, such as defining resistant hypertension or a subtype of eye disease, or when a clinical expert is not available for chart review.(30) The scope of review can vary based on the phenotype, for example while some algorithms may only require review of 1 year of a clinical record, others may require a full review of patient’s health record. After validation and tuning at one site, then the algorithm is executed and validated at secondary sites, preferably occurring across multiple EHRs and institutions, ensuring its reproducibility and transportability.
Figure 4. Phenotype development and validation.
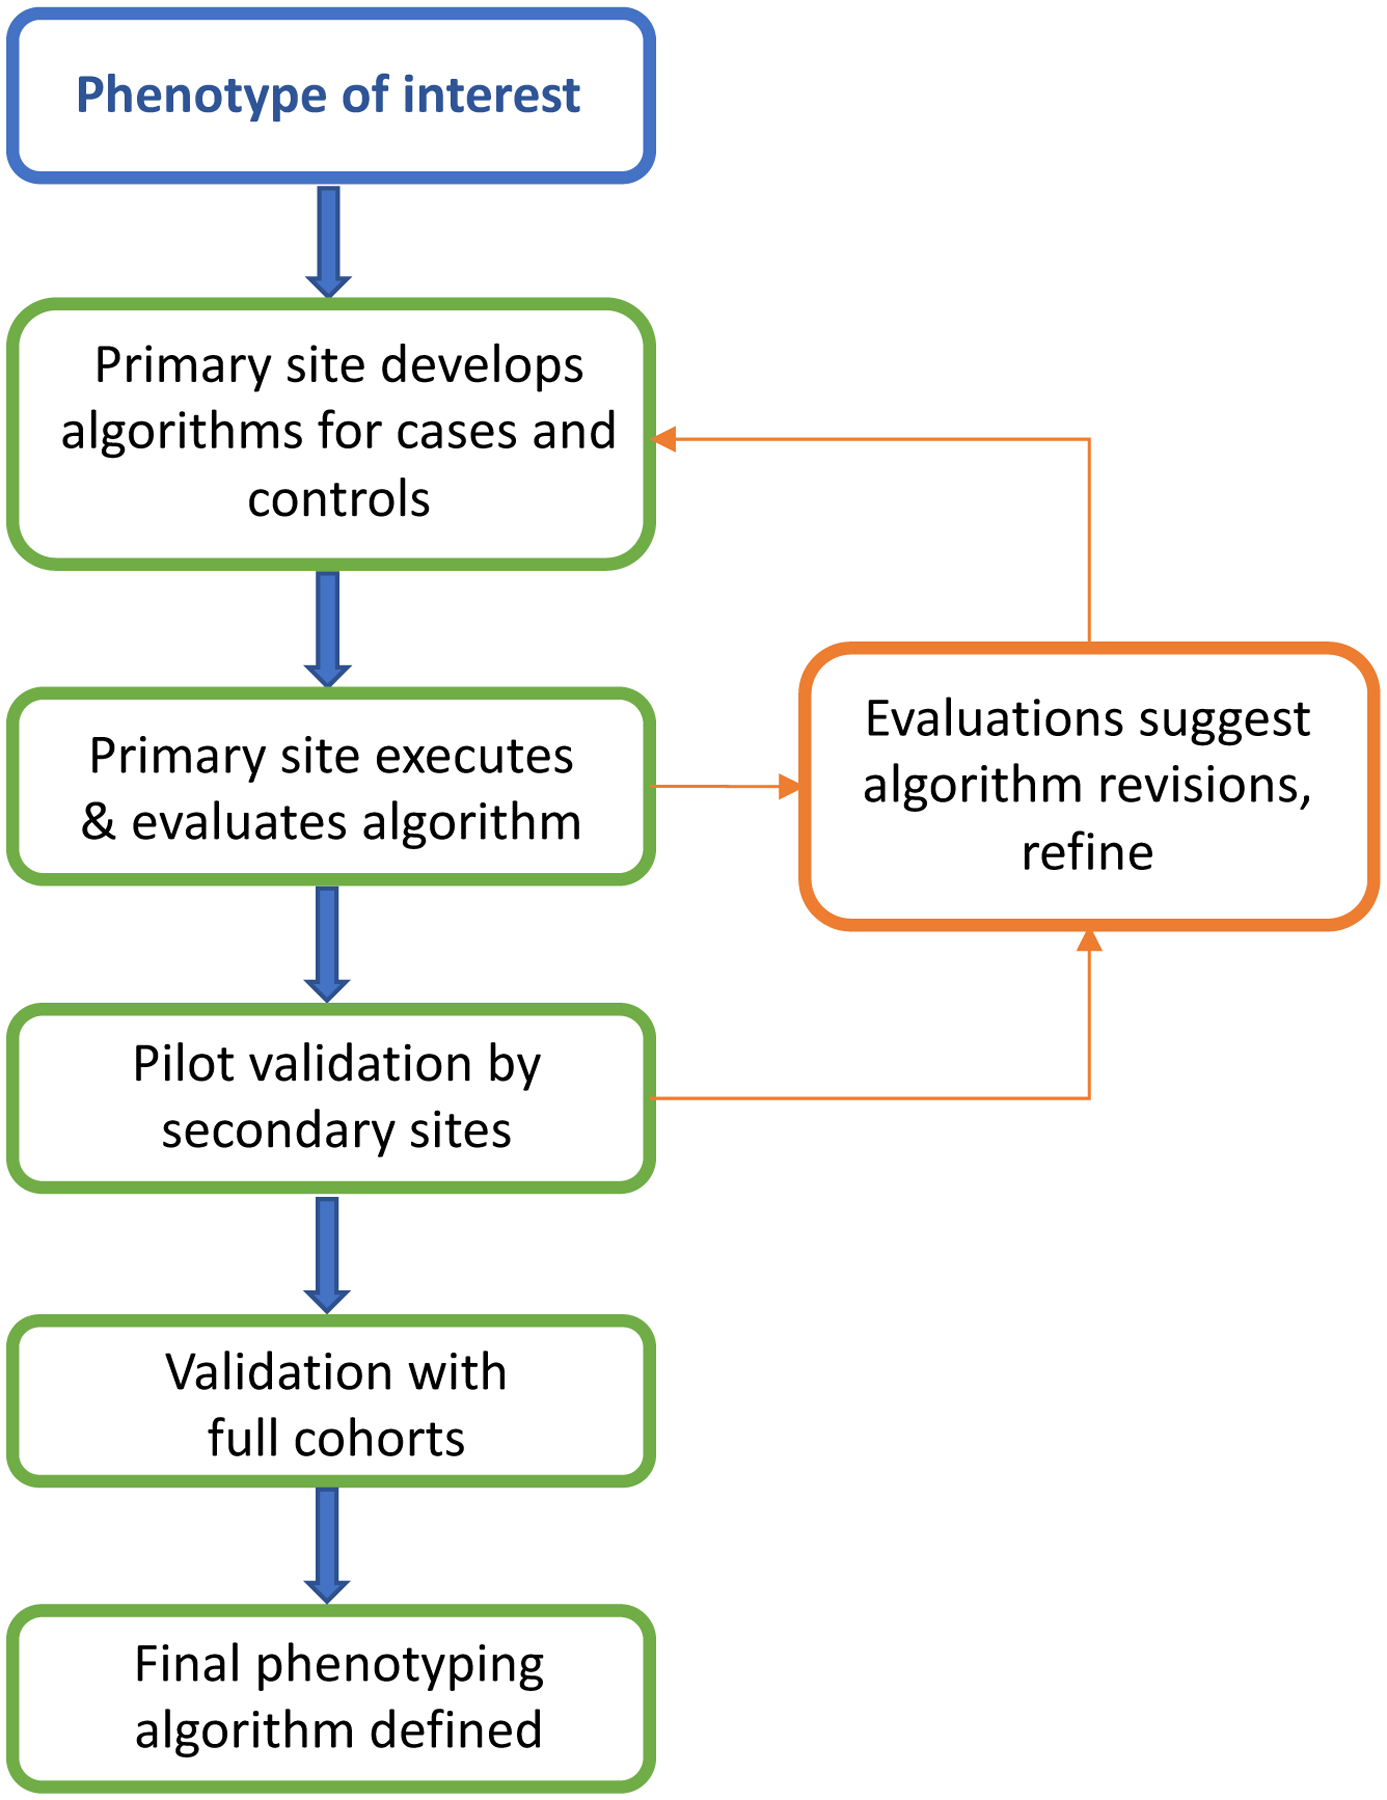
A primary site first develops and executes the phenotype, and then secondary sites execute the phenotype. At each step feedback to primary and secondary sites may lead to revisions in the methods (arrows).
Curation and validation of a single or few phenotyping algorithms using the above described method to ensure high PPV is feasible and remains a highly-utilized method for GWAS.
5.2. Scalability and Portability of EHR-derived Phenotyping Algorithms
For multi-site collaboration and accrual of large datasets, it is important to consider the portability of phenotypes across different institutions with varying EHRs, infrastructures, clinical domain knowledge, and informatics support. Researchers within eMERGE and other networks have demonstrated the portability of well-defined logical constraint-based phenotyping algorithms and have fostered sharing through public availability on PheKB. Kirby et al. described the results of 43 phenotyping algorithms including multisite validation data in PheKB, with a median of 3 (range 1–8) external validations per algorithm (21). Performances on case and control algorithms for development-site evaluations were similar to performance by external-site evaluations, with median case and control PPV over 95% for both. PheKB currently contains 154 phenotypes, 44 of which are publically available (Table 2). As there is presently no uniformly-adopted method for data representation and extraction across varying institutions and EHRs, the algorithms are typically represented as ‘pseudocode’ to improve transportability and guide other sites at implementation, containing all necessary variables and the rules to combine them (30). Pathak et al. suggested that standardization of phenotype data dictionaries in these phenotyping algorithms using common data elements and biomedical ontologies could also help facilitate multi-site and cross-study collaborations (95); these ideas were later expanded into a desiderata for phenotype algorithms which includes logic formalism, use of ontologies, and the need for a common phenotype language that removes the need for human reimplementation from pseudocode (96).
In 2012, Carroll et al. utilized a previously published logistic regression phenotyping algorithm for identification of cases and controls for rheumatoid arthritis as a model to demonstrate portability of a ML algorithm across institutions (66). Features obtained from structured data were comprised of billing codes, laboratory results, medication orders, and use of general-purpose NLP systems. Applying the previously published regression phenotyping model to 2 external institutions with different EHRs and NLP systems showed an AUC to be similar to that obtained at the development site (92% and 95% at external sites compared to 97% at development site).
Logical constraint-based algorithms are largely rule-based, relying heavily on domain experts for curation. Similarly, supervised ML algorithms require annotated sets and often defined features for a specific phenotype. While these algorithms achieve high accuracy and portability across institutions, their scalability to a phenome-wide approach remains limited. In addition, many traits are not dichotomous but present along a continuum in a population. A recent study by Wells et al. demonstrated the use of left ventricular function determined by systolic ejection fraction, a continuous measure, to analyze associations with drug side effects in a GWAS analysis (97). Other opportunities for defining phenotypes include incorporating ontologies such as SNOMED-CT or the human phenotype ontology (HPO), which was originally designed to capture phenotypes related to Mendelian disease but has grown to encompass an increasing representation of common diseases (98).
As genotyping costs continue to decline and efforts become more widespread, the limiting factor to identification of genotype-phenotype associations will be accurate labeling of phenotype cases and controls. Research questions that require identification of many cohorts or phenotypes can become exponentially more challenging, with the resultant need for high-throughput phenotyping methods. Unsupervised ML algorithms to broadly define phenomes may have potential to scale phenotype discovery; however, their current use in genetic association analyses is limited.
5.3. Phenome-wide Association Studies
Analogous to a GWAS, PheWAS leverages the breadth of phenotypes in the EHR to perform systematic interrogation for associations with an independent variable, typically a genotype. The first PheWAS was performed in 2010, in which four known SNP-disease associations were replicated and several new proposed (99). Since then, dozens of studies have used PheWAS to explore both genetic and phenotypic associations to specific traits.
The PheWAS method requires a broad set of phenotypes collected in an unbiased approach to create a complete phenome of diseases and traits. PheWAS can use thousands of phenotypes; thus manual curation and validation is not practical (99–101). Thus to define a complete phenome across a large cohort, many PheWAS have used phenotypes derived from custom groupings of ICD-9 codes, also referred to as phecodes (99, 102). Typically, 2 or more ICD-9 codes are required for mapping to a single phecode. While the phecode groupings have been shown to better align with clinical diseases in practice, other methods of phenotype classification also are effective for PheWAS studies (100, 101, 103–105). Several studies have reported success with a PheWAS method using raw ICD-9 codes and parent ICD-9 three-digit groups as phenotypes (100, 103, 104). Leader et al. compared five gold standard phenotypes to ICD-9-Clinical Modification (CM) 5-digit and 3-digit diseases and phecodes (103). They found that phecodes may not be granular enough for some phenotypes. Others have also used Agency for Healthcare Research and Quality (ARHQ) Clinical Classification Software for ICD-9-CM (CCS), which reorganizes disparate ICD-9-CM codes into a smaller number of clinically meaningful categories (105, 106). Similar to three-digit ICD-9-CM codes or phecodes, CCS provides a hierarchical grouping of ICD-9-CM or ICD-10-CM codes but at a more aggregate level than other approaches. Wei et al. recently compared different diseases studied in prior GWAS to determine which phenotyping method better aligned with clinical practice and prior genomic association results and found that phecodes replicated more known SNP-phenotype associations (153 SNP-phenotype pairs) than use of ICD-9-CM (143) or CCS (139) (105).
Finding specific phenotypes that are not captured by billing codes or uncommon disease associations is crucial and will require increased granularity and accuracy of phenotyping techniques. An example of a trait rarely captured by billing codes alone is that of drug response, important for pharmacogenomic studies (107). Hebbring et al. has shown that PheWAS can be performed by defining the phenome solely on textual data within clinical documentation (101). Using clinical text extracted using NLP along with billing codes and other data available in the EHR could help automate and refine phenotypes at the phenome-wide scale.
PheWAS has shown the feasibility of analyzing genomic associations with thousands of phenotypes across a cohort of individuals and finding novel associations (99, 100, 102, 108). This approach can also be applied using various predictive attributes in the PheWAS analysis, including genetic risk scores, a set of SNPs aggregated into a single continuous score, or gene expression data. Krapohl et al. demonstrated how a genetic risk score could be applied to a phenome consisting of behavioral or psychiatric traits to explain some of the phenotypic variation seen in a population (109). Gamazon et al. have described PrediXcan, a method that predicts tissue-specific gene expression and could be used in PheWAS to measure trait associations as well (110). Mosley et al. applied generalized linear mixed models in a phenome-wide approach to estimate the additive genetic variance underlying phenotypes to prioritize those diseases and traits more likely to have genetic drivers, identifying a few conditions for which novel genetic signals were discovered via subsequent GWAS (111).
The flexibility and ease of application of the PheWAS approach makes the methods highly generalizable. Expansion of PheWAS-like methods with other high-throughput phenotyping techniques that capture the breadth of phenotypes in clinical practice has the potential to further advance discovery.
6. CHALLENGES AND OPPORTUNITIES OF EHR PHENOTYPES FOR GENOMICS RESEARCH
6.1. Challenges Learned from Current Phenotyping Efforts
Several challenges remain to optimizing use of EHR data. In addition to the inherent limitations of reusing EHR data for research, such as data fragmentation, variable accuracy, and extent of unstructured data, there are significant challenges to phenotype algorithm creation, stability, and scalability. Evolving billing standards, such as the transition to ICD-10, changing documentation practices, and advancing EHR systems all weaken the stability of phenotyping algorithms. EHR-linked biobanks introduce further challenges. In particular, there can be significant loss to follow-up as individuals change providers or institutions. Further, many EHR-linked biobanks prevent the ability to recontact patients due to de-identification of the EHR prior to the conduct of genotyping and research.
One major challenge both within EHR-linked biobanks as well as with combining genomic data from different institutions in multi-site collaborations is the usage of selected patient cohorts genotyped on varying platforms. Often genotyping of all consented individuals at an institution is not financially or logistically feasible. Thus, priorities are made for genotyping of individuals with known phenotypes of specific research interest or external funding for genotyping expenses. This has resulted in relatively large sample sizes of specific phenotypes at any one site, which can also influence what other phenotypes are observed in the genotyped population. In addition to population selection for genotyping, a variety of different genotyping platforms may be used. These constraints result in specific biases within certain biobanks that must be considered by researchers.
Another challenge is variable success of some algorithms. For example, type 2 diabetes has shown replicability with PPV greater than 98% for cases across institutions while the PPV for accurate identification of dementia ranged from 73–90% at different sites (30). For dementia in particular, cases were compared to a research-quality dementia diagnosis at a specific site obtained through a longitudinal cohort study, showing that billing codes and medications alone were not sufficient for accurate prediction of a dementia diagnosis. Unfortunately, there is currently no reliable method of determining preemptively which algorithms will perform well across different sites; thus validation, an iterative and time-consuming process, remains a crucial step.
6.2. Future Directions
Collaborations between researchers and clinicians could allow for integration of data obtained in prospective research initiatives into EHRs. In addition, linkage of EHR data to medical claims data and nationally public databases, such as prescription data and national death indices could also improve accuracy of phenotyping algorithms (30). In contrast to EHRs, which are used primarily by healthcare providers, participant-facing collection of health data has grown dramatically. While not a focus of this review, phenotypes for genomic research obtained through consumer-facing organizations such as 23andMe and the upcoming All of Us Research Program also have the potential to accrue a wealth of phenotypic information for genomic research (24, 112–114). Further, as personal health records and consumer health tracking applications on smartphones or other consumer devices increase in functionality and integration with other aspects of patient health information, these have the potential for the development of more refined phenotype definitions (18, 107–109).
Although use of ML and novel statistical methods for phenotype classification are growing, rule-based approaches continue to dominate. Use of standard terminologies within phenotype algorithms improves portability. Globally, there are challenges with collaboration due to differences in billing standards, such as the use of ICD-9, ICD-10, or ICD-10 with Clinical Modifications in the US. For example, while SNOMED-CT is the most common emerging terminology used in the United States, the United Kingdom has historically used Read codes in general practice clinics.
With no current unified programming language or phenotype implementation approach, the actual code for phenotyping algorithms remains largely non-portable today (118). The Phenotype Execution Modeling Architecture (PhEMA) project has the goal of developing reusable and machine-executable phenotype algorithms across sites and EHR systems (119). A key challenge, however, is not the programming language itself but the semantic representation of the data within the EHR. The Shared Health Research Information Network (SHRINE) has allowed for shared phenotype queries across systems implementing the Integrating Biology and the Bedside (i2b2) platform (120). Another promising approach to harmonizing data from heterogeneous EHRs is the use of a common data model (CDM) to create a common format for the data elements. Several different CDMs are in widespread use, including the Observational Medical Outcomes Partnership (OMOP) CDM (121) and the Patient-centered Clinical Research Network (PCORnet) CDM (122). When transformed into a CDM, ideally the same code can be executed across disparate sites and EHR systems.
The creation of precision medicine initiatives through biobanks allows for discovery into phenotypes across populations of patients with diverse genetic and environmental backgrounds. Genomic discovery has historically lacked in ancestral diversity (123, 124). Research collaboration using these large cohorts will help to better understand the role of genomics in phenotype variation internationally.
The overall goal of integration of genomic and phenotypic information with the EHR is not only to foster advances in research, but also to drive clinical decision making to support precision medicine (125). For example, implementation of algorithms to predict who may be at risk for being placed on particular medications could guide who is genotyped prior to medication therapy (126). Phenotyping algorithms could improve identifying populations for public health measures and decision support.
The National Academy of Medicine has recognized that healthcare systems are falling short it the ability integrate the wealth of knowledge and innovation into improvement in quality, outcomes, and cost (127). Much of the genetic information from genome-wide sequencing or genotyping is either not accessible to clinicians, not actionable at this time, or not in a computable form available for clinical decision support and future research (128). Providing accessibility of genomic information to clinicians through the EHR comes with many challenges, including data storage, structuring, and visualization, and can be overwhelming to a clinician (129). A vital step in achieving a learning healthcare system that incorporates genomic knowledge is the development of genomic clinical decision support for clinicians. The ability to integrate genomic information into the EHR in a way that is accessible, logical, interpretable, and reusable will leverage the translation of genomic discovery to the bedside.
7. CONCLUSIONS
While integration of genomic information into EHRs has yet to fully reach its potential, significant work in phenotyping and biobanking efforts are providing an improved understanding of potential challenges to guide the future. The capability of data collection and extraction in the EHR has made it feasible for genomic and phenomic studies to have significant impacts on modern genomic research. Efforts towards the centralization of information and design of systems that meet the needs of collaborative research along with clinical and billing requirements will greatly facilitate advancement in phenotyping studies. Current successful initiatives worldwide provide the framework for phenotyping and genomic progress and innovation. Continued advances and standardization in EHR data abstraction and visualization, along with structured methods for integrating and representing genomic information will afford generalizable approaches to promote precision medicine.
Acknowledgments
JR Robinson support by the T15 LM007450 training grant from the NIH National Library of Medicine. This work is also supported by NIH funding through R01 LM010685, U01 HG008672, R01 GM 103859, and P50 GM115305.
Footnotes
Precision Medicine Initiative, PMI, All of Us, the All of Us logo, and The Future of Health Begins With You are service marks of the U.S. Department of Health and Human Services.
References
- 1.Hindorff LA, Sethupathy P, Junkins HA, Ramos EM, Mehta JP, et al. 2009. Potential etiologic and functional implications of genome-wide association loci for human diseases and traits. Proc. Natl. Acad. Sci. U. S. A 106(23):9362–67 [DOI] [PMC free article] [PubMed] [Google Scholar]
- 2.The Office of the National Coordinator for Health Information Technology. Adoption of electronic health record systems among u.s. non-federal acute care hospitals: 2008–2015 /evaluations/data-briefs/non-federal-acute-care-hospital-ehr-adoption-2008-2015.php
- 3.Ginsburg GS, Burke TW, Febbo P. 2008. Centralized biorepositories for genetic and genomic research. JAMA. 299(11):1359–61 [DOI] [PubMed] [Google Scholar]
- 4.Denny JC. 2014. Surveying recent themes in translational bioinformatics: big data in EHRs, omics for drugs, and personal genomics. Yearb. Med. Inform 9:199–205 [DOI] [PMC free article] [PubMed] [Google Scholar]
- 5.Kullo IJ, Ding K, Jouni H, Smith CY, Chute CG. 2010. A genome-wide association study of red blood cell traits using the electronic medical record. PloS One. 5(9): [DOI] [PMC free article] [PubMed] [Google Scholar]
- 6.Ritchie MD, Denny JC, Crawford DC, Ramirez AH, Weiner JB, et al. 2010. Robust replication of genotype-phenotype associations across multiple diseases in an electronic medical record. Am. J. Hum. Genet 86(4):560–72 [DOI] [PMC free article] [PubMed] [Google Scholar]
- 7.Denny JC, Ritchie MD, Crawford DC, Schildcrout JS, Ramirez AH, et al. 2010. Identification of genomic predictors of atrioventricular conduction: using electronic medical records as a tool for genome science. Circulation. 122(20):2016–21 [DOI] [PMC free article] [PubMed] [Google Scholar]
- 8.Denny JC, Bastarache L, Roden DM. 2016. Phenome-wide association studies as a tool to advance precision medicine. Annu. Rev. Genomics Hum. Genet 17:353–73 [DOI] [PMC free article] [PubMed] [Google Scholar]
- 9.Bowton E, Field JR, Wang S, Schildcrout JS, Van Driest SL, et al. 2014. Biobanks and electronic medical records: enabling cost-effective research. Sci. Transl. Med 6(234):234cm3. [DOI] [PMC free article] [PubMed] [Google Scholar]
- 10.Wei W-Q, Denny JC. 2015. Extracting research-quality phenotypes from electronic health records to support precision medicine. Genome Med. 7(1):41. [DOI] [PMC free article] [PubMed] [Google Scholar]
- 11.Institute of Medicine. 2003. Key capabilities of an electronic health record system: Letter report [PubMed]
- 12.Kaye JA, del Mar Melero-Montes M, Jick H. 2001. Mumps, measles, and rubella vaccine and the incidence of autism recorded by general practitioners: a time trend analysis. BMJ. 322(7284):460–63 [DOI] [PMC free article] [PubMed] [Google Scholar]
- 13.Asch SM, McGlynn EA, Hogan MM, Hayward RA, Shekelle P, et al. 2004. Comparison of quality of care for patients in the Veterans Health Administration and patients in a national sample. Ann. Intern. Med 141(12):938–45 [DOI] [PubMed] [Google Scholar]
- 14.Croen LA, Yoshida CK, Odouli R, Newman TB. 2005. Neonatal hyperbilirubinemia and risk of autism spectrum disorders. Pediatrics. 115(2):e135–138 [DOI] [PubMed] [Google Scholar]
- 15.Hripcsak G, Ryan PB, Duke JD, Shah NH, Park RW, et al. 2016. Characterizing treatment pathways at scale using the OHDSI network. Proc. Natl. Acad. Sci. U. S. A 113(27):7329–36 [DOI] [PMC free article] [PubMed] [Google Scholar]
- 16.Karlson EW, Boutin NT, Hoffnagle AG, Allen NL. 2016. Building the Partners Healthcare Biobank at Partners personalized medicine: informed consent, return of research results, recruitment lessons and operational considerations. J. Pers. Med 6(1): [DOI] [PMC free article] [PubMed] [Google Scholar]
- 17.Pulley J, Clayton E, Bernard GR, Roden DM, Masys DR. 2010. Principles of human subjects protections applied in an opt-out, de-identified biobank. Clin. Transl. Sci 3(1):42–48 [DOI] [PMC free article] [PubMed] [Google Scholar]
- 18.NOT-OD-14–124: NIH Genomic Data Sharing Policy. https://grants.nih.gov/grants/guide/notice-files/NOT-OD-14-124.html
- 19.Kho AN, Pacheco JA, Peissig PL, Rasmussen L, Newton KM, et al. 2011. Electronic medical records for genetic research: results of the eMERGE consortium. Sci. Transl. Med 3(79):79re1. [DOI] [PMC free article] [PubMed] [Google Scholar]
- 20.Gaziano JM, Concato J, Brophy M, Fiore L, Pyarajan S, et al. 2016. Million Veteran Program: A mega-biobank to study genetic influences on health and disease. J. Clin. Epidemiol 70:214–23 [DOI] [PubMed] [Google Scholar]
- 21.Kirby JC, Speltz P, Rasmussen LV, Basford M, Gottesman O, et al. 2016. PheKB: a catalog and workflow for creating electronic phenotype algorithms for transportability. J. Am. Med. Inform. Assoc. JAMIA 23(6):1046–52 [DOI] [PMC free article] [PubMed] [Google Scholar]
- 22.Elliott P, Peakman TC, UK Biobank. 2008. The UK Biobank sample handling and storage protocol for the collection, processing and archiving of human blood and urine. Int. J. Epidemiol 37(2):234–44 [DOI] [PubMed] [Google Scholar]
- 23.Sudlow C, Gallacher J, Allen N, Beral V, Burton P, et al. 2015. UK biobank: an open access resource for identifying the causes of a wide range of complex diseases of middle and old age. PLoS Med. 12(3):e1001779. [DOI] [PMC free article] [PubMed] [Google Scholar]
- 24.National Institutes of Health (NIH) - All Of Us | National Institutes of Health (NIH). https://allofus-nih-gov.proxy.library.vanderbilt.edu/
- 25.Kohane IS. 2011. Using electronic health records to drive discovery in disease genomics. Nat. Rev. Genet 12(6):417–28 [DOI] [PubMed] [Google Scholar]
- 26.Denny JC, Crawford DC, Ritchie MD, Bielinski SJ, Basford MA, et al. 2011. Variants near FOXE1 are associated with hypothyroidism and other thyroid conditions: using electronic medical records for genome- and phenome-wide studies. Am. J. Hum. Genet 89(4):529–42 [DOI] [PMC free article] [PubMed] [Google Scholar]
- 27.Burton PR, Hansell AL, Fortier I, Manolio TA, Khoury MJ, et al. 2009. Size matters: just how big is BIG?: Quantifying realistic sample size requirements for human genome epidemiology. Int. J. Epidemiol 38(1):263–73 [DOI] [PMC free article] [PubMed] [Google Scholar]
- 28.Sham PC, Purcell SM. 2014. Statistical power and significance testing in large-scale genetic studies. Nat. Rev. Genet 15(5):335–46 [DOI] [PubMed] [Google Scholar]
- 29.Wei W-Q, Teixeira PL, Mo H, Cronin RM, Warner JL, Denny JC. 2016. Combining billing codes, clinical notes, and medications from electronic health records provides superior phenotyping performance. J. Am. Med. Inform. Assoc. JAMIA 23(e1):e20–27 [DOI] [PMC free article] [PubMed] [Google Scholar]
- 30.Newton KM, Peissig PL, Kho AN, Bielinski SJ, Berg RL, et al. 2013. Validation of electronic medical record-based phenotyping algorithms: results and lessons learned from the eMERGE network. J. Am. Med. Inform. Assoc. JAMIA 20(e1):e147–154 [DOI] [PMC free article] [PubMed] [Google Scholar]
- 31.Denny JC. 2012. Chapter 13: Mining electronic health records in the genomics era. PLoS Comput. Biol 8(12):e1002823. [DOI] [PMC free article] [PubMed] [Google Scholar]
- 32.Denny JC, Peterson JF, Choma NN, Xu H, Miller RA, et al. 2010. Extracting timing and status descriptors for colonoscopy testing from electronic medical records. J. Am. Med. Inform. Assoc. JAMIA 17(4):383–88 [DOI] [PMC free article] [PubMed] [Google Scholar]
- 33.Robinson JR, Denny JC, Roden DM, Van Driest SL. 2017. Genome-wide and Phenome-wide Approaches to Understand Variable Drug Actions in Electronic Health Records. Clin. Transl. Sci [DOI] [PMC free article] [PubMed] [Google Scholar]
- 34.Liao KP, Cai T, Savova GK, Murphy SN, Karlson EW, et al. 2015. Development of phenotype algorithms using electronic medical records and incorporating natural language processing. BMJ. 350:h1885. [DOI] [PMC free article] [PubMed] [Google Scholar]
- 35.CLAMP Development Team. CLAMP | Natural Language Processing (NLP) Software. http://clamp.uth.edu/
- 36.Denny JC, Smithers JD, Miller RA, Spickard A. 2003. “Understanding” medical school curriculum content using KnowledgeMap. J. Am. Med. Inform. Assoc. JAMIA 10(4):351–62 [DOI] [PMC free article] [PubMed] [Google Scholar]
- 37.Friedman C, Shagina L, Lussier Y, Hripcsak G. 2004. Automated encoding of clinical documents based on natural language processing. J. Am. Med. Inform. Assoc. JAMIA 11(5):392–402 [DOI] [PMC free article] [PubMed] [Google Scholar]
- 38.Savova GK, Masanz JJ, Ogren PV, Zheng J, Sohn S, et al. 2010. Mayo clinical Text Analysis and Knowledge Extraction System (cTAKES): architecture, component evaluation and applications. J. Am. Med. Inform. Assoc. JAMIA 17(5):507–13 [DOI] [PMC free article] [PubMed] [Google Scholar]
- 39.Jiang M, Chen Y, Liu M, Rosenbloom ST, Mani S, et al. 2011. A study of machine-learning-based approaches to extract clinical entities and their assertions from discharge summaries. J. Am. Med. Inform. Assoc. JAMIA 18(5):601–6 [DOI] [PMC free article] [PubMed] [Google Scholar]
- 40.Salmasian H, Freedberg DE, Friedman C. 2013. Deriving comorbidities from medical records using natural language processing. J. Am. Med. Inform. Assoc. JAMIA 20(e2):e239–242 [DOI] [PMC free article] [PubMed] [Google Scholar]
- 41.Xu H, Stenner SP, Doan S, Johnson KB, Waitman LR, Denny JC. 2010. MedEx: a medication information extraction system for clinical narratives. J. Am. Med. Inform. Assoc. JAMIA 17(1):19–24 [DOI] [PMC free article] [PubMed] [Google Scholar]
- 42.Garvin JH, DuVall SL, South BR, Bray BE, Bolton D, et al. 2012. Automated extraction of ejection fraction for quality measurement using regular expressions in Unstructured Information Management Architecture (UIMA) for heart failure. J. Am. Med. Inform. Assoc. JAMIA 19(5):859–66 [DOI] [PMC free article] [PubMed] [Google Scholar]
- 43.Friedman C, Hripcsak G, Shagina L, Liu H. 1999. Representing information in patient reports using natural language processing and the extensible markup language. J. Am. Med. Inform. Assoc. JAMIA 6(1):76–87 [DOI] [PMC free article] [PubMed] [Google Scholar]
- 44.Denny JC, Spickard A, Miller RA, Schildcrout J, Darbar D, et al. 2005. Identifying UMLS concepts from ECG Impressions using KnowledgeMap. AMIA Annu. Symp. Proc. AMIA Symp, pp. 196–200 [PMC free article] [PubMed] [Google Scholar]
- 45.Elkin PL, Ruggieri AP, Brown SH, Buntrock J, Bauer BA, et al. 2001. A randomized controlled trial of the accuracy of clinical record retrieval using SNOMED-RT as compared with ICD9-CM. Proc. AMIA Symp, pp. 159–63 [PMC free article] [PubMed] [Google Scholar]
- 46.Elkin PL, Froehling D, Wahner-Roedler D, Trusko B, Welsh G, et al. 2008. NLP-based identification of pneumonia cases from free-text radiological reports. AMIA Annu. Symp. Proc. AMIA Symp, pp. 172–76 [PMC free article] [PubMed] [Google Scholar]
- 47.Chapman WW, Chu D, Dowling JN. 2007. ConText: An algorithm for identifying contextual features from clinical text
- 48.Zhang Y, Tang B, Jiang M, Wang J, Xu H. 2015. Domain adaptation for semantic role labeling of clinical text. J. Am. Med. Inform. Assoc. JAMIA 22(5):967–79 [DOI] [PMC free article] [PubMed] [Google Scholar]
- 49.Wu Y, Denny JC, Rosenbloom ST, Miller RA, Giuse DA, et al. 2015. A preliminary study of clinical abbreviation disambiguation in real time. Appl. Clin. Inform 6(2):364–74 [DOI] [PMC free article] [PubMed] [Google Scholar]
- 50.Sun W, Rumshisky A, Uzuner O. 2015. Normalization of relative and incomplete temporal expressions in clinical narratives. J. Am. Med. Inform. Assoc. JAMIA 22(5):1001–8 [DOI] [PMC free article] [PubMed] [Google Scholar]
- 51.Sohn S, Savova GK. 2009. Mayo clinic smoking status classification system: extensions and improvements. AMIA Annu. Symp. Proc. AMIA Symp 2009:619–23 [PMC free article] [PubMed] [Google Scholar]
- 52.Uzuner O, Goldstein I, Luo Y, Kohane I. 2008. Identifying patient smoking status from medical discharge records. J. Am. Med. Inform. Assoc. JAMIA 15(1):14–24 [DOI] [PMC free article] [PubMed] [Google Scholar]
- 53.Liu M, Shah A, Jiang M, Peterson NB, Dai Q, et al. 2012. A study of transportability of an existing smoking status detection module across institutions. AMIA Annu. Symp. Proc. AMIA Symp 2012:577–86 [PMC free article] [PubMed] [Google Scholar]
- 54.Friedlin J, McDonald CJ. 2006. Using a natural language processing system to extract and code family history data from admission reports. AMIA Annu. Symp. Proc. AMIA Symp, p. 925. [PMC free article] [PubMed] [Google Scholar]
- 55.Denny JC, Spickard A, Johnson KB, Peterson NB, Peterson JF, Miller RA. 2009. Evaluation of a method to identify and categorize section headers in clinical documents. J. Am. Med. Inform. Assoc. JAMIA 16(6):806–15 [DOI] [PMC free article] [PubMed] [Google Scholar]
- 56.Bill R, Pakhomov S, Chen ES, Winden TJ, Carter EW, Melton GB. 2014. Automated extraction of family history information from clinical notes. AMIA Annu. Symp. Proc. AMIA Symp 2014:1709–17 [PMC free article] [PubMed] [Google Scholar]
- 57.Mehrabi S, Krishnan A, Roch AM, Schmidt H, Li D, et al. 2015. Identification of patients with family history of pancreatic cancer--investigation of an NLP system portability. Stud. Health Technol. Inform 216:604–8 [PMC free article] [PubMed] [Google Scholar]
- 58.Centers for Medicare and Medicaid Services. 2012. Stage 2 Eligible Professional Meaningful Use Core Measures Measure 5 of 17
- 59.Centers for Medicare and Medicaid Services. 2012. Stage 2 Eligible Professional Meaningful Use Menu Set Measures Measure 4 of 6
- 60.Orlando LA, Buchanan AH, Hahn SE, Christianson CA, Powell KP, et al. 2013. Development and validation of a primary care-based family health history and decision support program (MeTree). N. C. Med. J 74(4):287–96 [PMC free article] [PubMed] [Google Scholar]
- 61.Wu RR, Himmel TL, Buchanan AH, Powell KP, Hauser ER, et al. 2014. Quality of family history collection with use of a patient facing family history assessment tool. BMC Fam. Pract 15:31. [DOI] [PMC free article] [PubMed] [Google Scholar]
- 62.Garla V, Re VL, Dorey-Stein Z, Kidwai F, Scotch M, et al. 2011. The Yale cTAKES extensions for document classification: architecture and application. J. Am. Med. Inform. Assoc. JAMIA 18(5):614–20 [DOI] [PMC free article] [PubMed] [Google Scholar]
- 63.Melton GB, Hripcsak G. 2005. Automated detection of adverse events using natural language processing of discharge summaries. J. Am. Med. Inform. Assoc. JAMIA 12(4):448–57 [DOI] [PMC free article] [PubMed] [Google Scholar]
- 64.Murff HJ, FitzHenry F, Matheny ME, Gentry N, Kotter KL, et al. 2011. Automated identification of postoperative complications within an electronic medical record using natural language processing. JAMA. 306(8):848–55 [DOI] [PubMed] [Google Scholar]
- 65.Haerian K, Varn D, Vaidya S, Ena L, Chase HS, Friedman C. 2012. Detection of pharmacovigilance-related adverse events using electronic health records and automated methods. Clin. Pharmacol. Ther 92(2):228–34 [DOI] [PMC free article] [PubMed] [Google Scholar]
- 66.Carroll RJ, Thompson WK, Eyler AE, Mandelin AM, Cai T, et al. 2012. Portability of an algorithm to identify rheumatoid arthritis in electronic health records. J. Am. Med. Inform. Assoc. JAMIA 19(e1):e162–169 [DOI] [PMC free article] [PubMed] [Google Scholar]
- 67.Delaney JT, Ramirez AH, Bowton E, Pulley JM, Basford MA, et al. 2012. Predicting clopidogrel response using DNA samples linked to an electronic health record. Clin. Pharmacol. Ther 91(2):257–63 [DOI] [PMC free article] [PubMed] [Google Scholar]
- 68.Mosley JD, Shaffer CM, Van Driest SL, Weeke PE, Wells QS, et al. 2016. A genome-wide association study identifies variants in KCNIP4 associated with ACE inhibitor-induced cough. Pharmacogenomics J. 16(3):231–37 [DOI] [PMC free article] [PubMed] [Google Scholar]
- 69.Zeng QT, Goryachev S, Weiss S, Sordo M, Murphy SN, Lazarus R. 2006. Extracting principal diagnosis, co-morbidity and smoking status for asthma research: evaluation of a natural language processing system. BMC Med. Inform. Decis. Mak 6:30. [DOI] [PMC free article] [PubMed] [Google Scholar]
- 70.Teixeira PL, Wei W-Q, Cronin RM, Mo H, VanHouten JP, et al. 2017. Evaluating electronic health record data sources and algorithmic approaches to identify hypertensive individuals. J. Am. Med. Inform. Assoc. JAMIA 24(1):162–71 [DOI] [PMC free article] [PubMed] [Google Scholar]
- 71.Denny JC, Miller RA, Waitman LR, Arrieta MA, Peterson JF. 2009. Identifying QT prolongation from ECG impressions using a general-purpose Natural Language Processor. Int. J. Med. Inf 78 Suppl 1:S34–42 [DOI] [PMC free article] [PubMed] [Google Scholar]
- 72.Carroll RJ, Eyler AE, Denny JC. 2011. Naïve electronic health record phenotype identification for rheumatoid arthritis. AMIA Annu. Symp. Proc. AMIA Symp 2011:189–96 [PMC free article] [PubMed] [Google Scholar]
- 73.Wei W-Q, Leibson CL, Ransom JE, Kho AN, Caraballo PJ, et al. 2012. Impact of data fragmentation across healthcare centers on the accuracy of a high-throughput clinical phenotyping algorithm for specifying subjects with type 2 diabetes mellitus. J. Am. Med. Inform. Assoc. JAMIA 19(2):219–24 [DOI] [PMC free article] [PubMed] [Google Scholar]
- 74.Weiskopf NG, Hripcsak G, Swaminathan S, Weng C. 2013. Defining and measuring completeness of electronic health records for secondary use. J. Biomed. Inform 46(5):830–36 [DOI] [PMC free article] [PubMed] [Google Scholar]
- 75.Shivade C, Raghavan P, Fosler-Lussier E, Embi PJ, Elhadad N, et al. 2014. A review of approaches to identifying patient phenotype cohorts using electronic health records. J. Am. Med. Inform. Assoc. JAMIA 21(2):221–30 [DOI] [PMC free article] [PubMed] [Google Scholar]
- 76.Thompson WK, Rasmussen LV, Pacheco JA, Peissig PL, Denny JC, et al. 2012. An evaluation of the nqf quality data model for representing electronic health record driven phenotyping algorithms. AMIA. Annu. Symp. Proc 2012:911–20 [PMC free article] [PubMed] [Google Scholar]
- 77.Libbrecht MW, Noble WS. 2015. Machine learning applications in genetics and genomics. Nat. Rev. Genet 16(6):321–32 [DOI] [PMC free article] [PubMed] [Google Scholar]
- 78.Wei W-Q, Tao C, Jiang G, Chute CG. 2010. A high throughput semantic concept frequency based approach for patient identification: a case study using type 2 diabetes mellitus clinical notes. AMIA Annu. Symp. Proc. AMIA Symp 2010:857–61 [PMC free article] [PubMed] [Google Scholar]
- 79.Peissig PL, Santos Costa V, Caldwell MD, Rottscheit C, Berg RL, et al. 2014. Relational machine learning for electronic health record-driven phenotyping. J. Biomed. Inform 52:260–70 [DOI] [PMC free article] [PubMed] [Google Scholar]
- 80.Liao KP, Cai T, Gainer V, Goryachev S, Zeng-treitler Q, et al. 2010. Electronic medical records for discovery research in rheumatoid arthritis. Arthritis Care Res. 62(8):1120–27 [DOI] [PMC free article] [PubMed] [Google Scholar]
- 81.Gulshan V, Peng L, Coram M, Stumpe MC, Wu D, et al. 2016. Development and validation of a deep learning algorithm for detection of diabetic retinopathy in retinal fundus photographs. JAMA. 316(22):2402–10 [DOI] [PubMed] [Google Scholar]
- 82.Esteva A, Kuprel B, Novoa RA, Ko J, Swetter SM, et al. 2017. Dermatologist-level classification of skin cancer with deep neural networks. Nature. 542(7639):115–18 [DOI] [PMC free article] [PubMed] [Google Scholar]
- 83.Chen Y, Carroll RJ, Hinz ERM, Shah A, Eyler AE, et al. 2013. Applying active learning to high-throughput phenotyping algorithms for electronic health records data. J. Am. Med. Inform. Assoc. JAMIA 20(e2):e253–259 [DOI] [PMC free article] [PubMed] [Google Scholar]
- 84.Chiu P-H, Hripcsak G. 2017. EHR-based phenotyping: Bulk learning and evaluation. J. Biomed. Inform 70:35–51 [DOI] [PMC free article] [PubMed] [Google Scholar]
- 85.Bejan CA, Xia F, Vanderwende L, Wurfel MM, Yetisgen-Yildiz M. 2012. Pneumonia identification using statistical feature selection. J. Am. Med. Inform. Assoc. JAMIA 19(5):817–23 [DOI] [PMC free article] [PubMed] [Google Scholar]
- 86.Yu S, Liao KP, Shaw SY, Gainer VS, Churchill SE, et al. 2015. Toward high-throughput phenotyping: unbiased automated feature extraction and selection from knowledge sources. J. Am. Med. Inform. Assoc. JAMIA 22(5):993–1000 [DOI] [PMC free article] [PubMed] [Google Scholar]
- 87.LeCun Y, Bengio Y, Hinton G. 2015. Deep learning. Nature. 521(7553):436–44 [DOI] [PubMed] [Google Scholar]
- 88.Lasko TA, Denny JC, Levy MA. 2013. Computational phenotype discovery using unsupervised feature learning over noisy, sparse, and irregular clinical data. PloS One. 8(6):e66341. [DOI] [PMC free article] [PubMed] [Google Scholar]
- 89.Doshi-Velez F, Ge Y, Kohane I. 2014. Comorbidity clusters in autism spectrum disorders: an electronic health record time-series analysis. Pediatrics. 133(1):e54–63 [DOI] [PMC free article] [PubMed] [Google Scholar]
- 90.Lingren T, Chen P, Bochenek J, Doshi-Velez F, Manning-Courtney P, et al. 2016. Electronic Health Record Based Algorithm to Identify Patients with Autism Spectrum Disorder. PloS One. 11(7):e0159621. [DOI] [PMC free article] [PubMed] [Google Scholar]
- 91.Wojnarski CM, Roselli EE, Idrees JJ, Zhu Y, Carnes TA, et al. 2017. Machine-learning phenotypic classification of bicuspid aortopathy. J. Thorac. Cardiovasc. Surg [DOI] [PubMed] [Google Scholar]
- 92.Guan W-J, Jiang M, Gao Y-H, Li H-M, Xu G, et al. 2016. Unsupervised learning technique identifies bronchiectasis phenotypes with distinct clinical characteristics. Int. J. Tuberc. Lung Dis. Off. J. Int. Union Tuberc. Lung Dis 20(3):402–10 [DOI] [PubMed] [Google Scholar]
- 93.Ho JC, Ghosh J, Steinhubl SR, Stewart WF, Denny JC, et al. 2014. Limestone: high-throughput candidate phenotype generation via tensor factorization. J. Biomed. Inform 52:199–211 [DOI] [PMC free article] [PubMed] [Google Scholar]
- 94.Kale DC, Che Z, Bahadori MT, Li W, Liu Y, Wetzel R. 2015. Causal phenotype discovery via deep networks. AMIA Annu. Symp. Proc. AMIA Symp 2015:677–86 [PMC free article] [PubMed] [Google Scholar]
- 95.Pathak J, Wang J, Kashyap S, Basford M, Li R, et al. 2011. Mapping clinical phenotype data elements to standardized metadata repositories and controlled terminologies: the eMERGE Network experience. J. Am. Med. Inform. Assoc. JAMIA 18(4):376–86 [DOI] [PMC free article] [PubMed] [Google Scholar]
- 96.Mo H, Thompson WK, Rasmussen LV, Pacheco JA, Jiang G, et al. 2015. Desiderata for computable representations of electronic health records-driven phenotype algorithms. J. Am. Med. Inform. Assoc. JAMIA 22(6):1220–30 [DOI] [PMC free article] [PubMed] [Google Scholar]
- 97.Wells QS, Veatch OJ, Fessel JP, Joon AY, Levinson RT, et al. 2017. Genome-wide association and pathway analysis of left ventricular function after anthracycline exposure in adults. Pharmacogenet. Genomics 27(7):247–54 [DOI] [PMC free article] [PubMed] [Google Scholar]
- 98.Köhler S, Vasilevsky NA, Engelstad M, Foster E, McMurry J, et al. 2017. The Human Phenotype Ontology in 2017. Nucleic Acids Res. 45(D1):D865–76 [DOI] [PMC free article] [PubMed] [Google Scholar]
- 99.Denny JC, Ritchie MD, Basford MA, Pulley JM, Bastarache L, et al. 2010. PheWAS: demonstrating the feasibility of a phenome-wide scan to discover gene-disease associations. Bioinforma. Oxf. Engl 26(9):1205–10 [DOI] [PMC free article] [PubMed] [Google Scholar]
- 100.Hebbring SJ, Schrodi SJ, Ye Z, Zhou Z, Page D, Brilliant MH. 2013. A PheWAS approach in studying HLA-DRB1*1501. Genes Immun. 14(3):187–91 [DOI] [PMC free article] [PubMed] [Google Scholar]
- 101.Hebbring SJ, Rastegar-Mojarad M, Ye Z, Mayer J, Jacobson C, Lin S. 2015. Application of clinical text data for phenome-wide association studies (PheWASs). Bioinforma. Oxf. Engl 31(12):1981–87 [DOI] [PMC free article] [PubMed] [Google Scholar]
- 102.Denny JC, Bastarache L, Ritchie MD, Carroll RJ, Zink R, et al. 2013. Systematic comparison of phenome-wide association study of electronic medical record data and genome-wide association study data. Nat. Biotechnol 31(12):1102–10 [DOI] [PMC free article] [PubMed] [Google Scholar]
- 103.Leader JB, Pendergrass SA, Verma A, Carey DJ, Hartzel DN, et al. 2015. Contrasting association results between existing PheWAS phenotype definition methods and five validated electronic phenotypes. AMIA Annu. Symp. Proc. AMIA Symp 2015:824–32 [PMC free article] [PubMed] [Google Scholar]
- 104.Verma A, Verma SS, Pendergrass SA, Crawford DC, Crosslin DR, et al. 2016. eMERGE Phenome-Wide Association Study (PheWAS) identifies clinical associations and pleiotropy for stop-gain variants. BMC Med. Genomics 9 Suppl 1:32. [DOI] [PMC free article] [PubMed] [Google Scholar]
- 105.Wei W-Q, Bastarache LA, Carroll RJ, Marlo JE, Osterman TJ, et al. 2017. Evaluating phecodes, clinical classification software, and ICD-9-CM codes for phenome-wide association studies in the electronic health record. PloS One. 12(7):e0175508. [DOI] [PMC free article] [PubMed] [Google Scholar]
- 106.Pathak J, Kiefer RC, Bielinski SJ, Chute CG. 2012. Applying semantic web technologies for phenome-wide scan using an electronic health record linked Biobank. J. Biomed. Semant 3(1):10. [DOI] [PMC free article] [PubMed] [Google Scholar]
- 107.Van Driest SL, Wells QS, Stallings S, Bush WS, Gordon A, et al. 2016. Association of arrhythmia-related genetic variants with phenotypes documented in electronic medical records. JAMA. 315(1):47–57 [DOI] [PMC free article] [PubMed] [Google Scholar]
- 108.Hebbring SJ. 2014. The challenges, advantages and future of phenome-wide association studies. Immunology. 141(2):157–65 [DOI] [PMC free article] [PubMed] [Google Scholar]
- 109.Krapohl E, Euesden J, Zabaneh D, Pingault J-B, Rimfeld K, et al. 2016. Phenome-wide analysis of genome-wide polygenic scores. Mol. Psychiatry 21(9):1188–93 [DOI] [PMC free article] [PubMed] [Google Scholar]
- 110.Gamazon ER, Wheeler HE, Shah KP, Mozaffari SV, Aquino-Michaels K, et al. 2015. A gene-based association method for mapping traits using reference transcriptome data. Nat. Genet 47(9):1091–98 [DOI] [PMC free article] [PubMed] [Google Scholar]
- 111.Mosley JD, Witte JS, Larkin EK, Bastarache L, Shaffer CM, et al. 2016. Identifying genetically driven clinical phenotypes using linear mixed models. Nat. Commun 7:11433. [DOI] [PMC free article] [PubMed] [Google Scholar]
- 112.23andMe. DNA Genetic Testing & Analysis - 23andMe. https://www.23andme.com/
- 113.Annas GJ, Elias S. 2014. 23andMe and the FDA. N. Engl. J. Med 370(11):985–88 [DOI] [PubMed] [Google Scholar]
- 114.Precision Medicine Initiative (PMI) Working Group. 2015. The Precision Medicine Initiative Cohort Program—building a research foundation for 21st century medicine. https://www-nih-gov.proxy.library.vanderbilt.edu/sites/default/files/research-training/initiatives/pmi/pmi-working-group-report-20150917-2.pdf
- 115.Tang PC, Ash JS, Bates DW, Overhage JM, Sands DZ. 2006. Personal health records: definitions, benefits, and strategies for overcoming barriers to adoption. J. Am. Med. Inform. Assoc. JAMIA 13(2):121–26 [DOI] [PMC free article] [PubMed] [Google Scholar]
- 116.Roehrs A, da Costa CA, Righi R da R, de Oliveira KSF. 2017. Personal health records: a systematic literature review. J. Med. Internet Res 19(1):e13. [DOI] [PMC free article] [PubMed] [Google Scholar]
- 117.Gay V, Leijdekkers P. 2015. Bringing health and fitness data together for connected health care: mobile apps as enablers of interoperability. J. Med. Internet Res 17(11): [DOI] [PMC free article] [PubMed] [Google Scholar]
- 118.Gottesman O, Kuivaniemi H, Tromp G, Faucett WA, Li R, et al. 2013. The Electronic Medical Records and Genomics (eMERGE) Network: past, present, and future. Genet. Med. Off. J. Am. Coll. Med. Genet 15(10):761–71 [DOI] [PMC free article] [PubMed] [Google Scholar]
- 119.Jiang G, Kiefer RC, Rasmussen LV, Solbrig HR, Mo H, et al. 2016. Developing a data element repository to support EHR-driven phenotype algorithm authoring and execution. J. Biomed. Inform 62:232–42 [DOI] [PMC free article] [PubMed] [Google Scholar]
- 120.Weber GM, Murphy SN, McMurry AJ, Macfadden D, Nigrin DJ, et al. 2009. The Shared Health Research Information Network (SHRINE): a prototype federated query tool for clinical data repositories. J. Am. Med. Inform. Assoc. JAMIA 16(5):624–30 [DOI] [PMC free article] [PubMed] [Google Scholar]
- 121.Overhage JM, Ryan PB, Reich CG, Hartzema AG, Stang PE. 2012. Validation of a common data model for active safety surveillance research. J. Am. Med. Inform. Assoc. JAMIA 19(1):54–60 [DOI] [PMC free article] [PubMed] [Google Scholar]
- 122.Klann JG, Abend A, Raghavan VA, Mandl KD, Murphy SN. 2016. Data interchange using i2b2. J. Am. Med. Inform. Assoc. JAMIA 23(5):909–15 [DOI] [PMC free article] [PubMed] [Google Scholar]
- 123.Manrai AK, Funke BH, Rehm HL, Olesen MS, Maron BA, et al. 2016. Genetic misdiagnoses and the potential for health disparities. N. Engl. J. Med 375(7):655–65 [DOI] [PMC free article] [PubMed] [Google Scholar]
- 124.Popejoy AB, Fullerton SM. 2016. Genomics is failing on diversity. Nature. 538(7624):161–64 [DOI] [PMC free article] [PubMed] [Google Scholar]
- 125.Collins FS, Varmus H. 2015. A new initiative on precision medicine. N. Engl. J. Med 372(9):793–95 [DOI] [PMC free article] [PubMed] [Google Scholar]
- 126.Pulley JM, Denny JC, Peterson JF, Bernard GR, Vnencak-Jones CL, et al. 2012. Operational implementation of prospective genotyping for personalized medicine: the design of the Vanderbilt PREDICT project. Clin. Pharmacol. Ther 92(1):87–95 [DOI] [PMC free article] [PubMed] [Google Scholar]
- 127.Institute of Medicine. 2013. Best care at lower cost: the path to continuously learning health care in america [PubMed]
- 128.Starren J, Williams MS, Bottinger EP. 2013. Crossing the omic chasm: a time for omic ancillary systems. JAMA. 309(12):1237–38 [DOI] [PMC free article] [PubMed] [Google Scholar]
- 129.Kho AN, Rasmussen LV, Connolly JJ, Peissig PL, Starren J, et al. 2013. Practical challenges in integrating genomic data into the electronic health record. Genet. Med. Off. J. Am. Coll. Med. Genet 15(10):772–78 [DOI] [PMC free article] [PubMed] [Google Scholar]