

Abstract
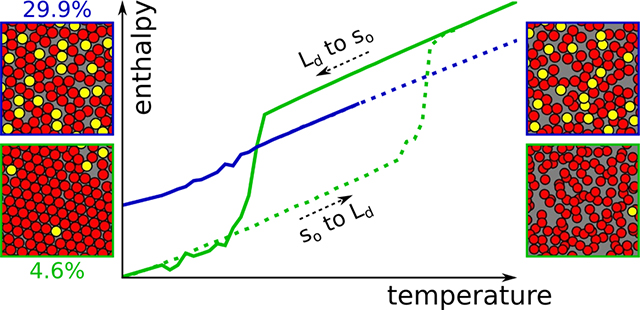
Extensive Martini simulation data, totaling 5 ms, is presented for binary mixtures of dipalmitoylphosphatidylcholine (DPPC) and cholesterol. Using simulation initiated from both gel (so) and liquid-disordered (Ld) phases, significant and strongly cholesterol-dependent hysteresis in the enthalpy as a function of temperature is observed for cholesterol mole fractions from 0 to 20 mol %. Although the precise phase transition temperature cannot be determined due to the hysteresis, the data are consistent with a first order gel to fluid transition, which increases in temperature with cholesterol. At 30 mol % cholesterol, no hysteresis is observed, and there is no evidence for a continuous transition, in either structural parameters like the area per lipid or in the heat capacity as a function of temperature. The results are consistent with a single uniform phase above a critical cholesterol composition between 20 and 30 mol % in Martini, while highlighting the importance and difficulty of obtaining the equilibrium averages to locate phase boundaries precisely in computational models of lipid bilayers.
Graphical Abstract
INTRODUCTION
Given that the plasma membrane of our cells is a spectacularly complex mixture of some 800 different lipids1 and a slew of proteins, it is remarkable that roughly one in three of these components is cholesterol. The function of cholesterol in our membranes has therefore garnered a great deal of attention over the years.2 In model systems (mixtures of one or two lipids with cholesterol), cholesterol at the physiological mole fraction tends to order hydrocarbon chains,3,4 leading to a thicker5 and more tightly packed6 membrane that is less permeable to water and ions. At sufficient mole fraction, cholesterol also modifies the phase diagram of saturated (and monounsaturated) phospholipids and sphingolipids, introducing a new phase named “liquid ordered” (Lo) by Ipsen et al.7 The liquid ordered phase is intermediate in chain order between the low temperature gel or “solid-ordered” (so) and the high temperature fluid (or liquid-disordered, Ld) phases of a pure bilayer, but retains liquid-like diffusion over macroscopic length scales.4,8 Phase diagrams for binary9 and ternary10 mixtures have been reviewed by Marsh.
Whether live cell membranes contain functional, nanoscale domains of increased order (the raft hypothesis11) remains a topic of heated debate.12–15 However, quite independent from the status of the raft hypothesis, it is clear from the composition of the plasma membrane alone that the ordering effect of cholesterol is an essential feature. Therefore, molecular scale models (whether all-atom16,17 or coarse-grained18–21) which intend to capture chemical specificity and lipidomic complexity must accurately model the effect of cholesterol on lipid order and phase behavior.
To this end, extensive simulations of binary mixtures of cholesterol with dipalmitoylphosphatidylcholine (DPPC) are presented, totaling 5 ms, and ranging from 0 to 30 mol % cholesterol. The simulations were run using the Martini coarse-grained force field, which groups 3–4 heavy atoms into a single interaction center. This mapping results in faster dynamics due to a smoothed energy landscape and reduced computational cost, while preserving some chemical detail. The present results build on a significant body of previous work, including early simulations of the main phase transition,22 binary mixtures of phospholipids,22,23 and ternary mixtures that include cholesterol.24,25 (For a review of work prior to 2009, see ref 23 for a more exhaustive list of studies on Martini lipid phase simulations, see ref 26.) More recently, several authors have reported simulations designed to more precisely locate phase boundaries in Martini. Smit and co-workers report a “computational calorimetry” approach to the main phase transition in single component, saturated phospholipids.27 Three recent papers report simulations of binary mixtures like those presented below,21,28,29 but focus on a wide range of cholesterol mole fractions — up to 60 mol %, with a resolution of 10 mol % cholesterol. Here, data for seven different compositions between 0 and 20 mol % are presented, focusing on a region of the phase diagram which has been comparatively understudied in simulation models, and where a transition is expected9 from the solid-ordered (so or gel) phase to the liquid-disordered (Ld, ofted called Lα in the cholesterol-free, pure bilayer). In addition, a modified Martini cholesterol model is used,30 which has been reparameterized based on all-atom simulations of ternary mixtures31,32 to better reproduce the Lo phase. At 20 mol % cholesterol and below, a single transition is observed, but with significant hysteresis, the extent of which depends on cholesterol. True thermodynamic averages are therefore not obtained for this region, rather the observables should be understood to be path-dependent, and heat capacities for these data are reported instead as “pseudo heat capacities.” At 30 mol % cholesterol a single Lo-like phase is observed in our measurements, and no evidence for a transition as a function of temperature, continuous or otherwise, is obtained. These results are discussed in the context of the binary phase diagram and the recent simulation data at the end.
METHODS
Martini Simulation Details.
The simulations analyzed in this work were performed using the GROMACS simulation package version 5.x33 and the Martini force field (version 2.018,30). This coarse-grained (CG) force field uses chemical groups–as opposed to atoms in atomistic force fields–as interaction centers. Martini is empirically parametrized to reproduce oil/water partitioning behavior.
Standard protocols were used to generate and simulate the systems. The initial configurations were created using the insane.py script,34 generating a defined mixture of DPPC/cholesterol, with a total of 388 lipid initial positions on a square lattice. Ten compositions were simulated over the range from 0 to 30 mol % of cholesterol; a summary of the simulation data are provided in Table 1. About 7000 nonpolarizable solvent beads (W) were added, including about ~10% of “antifreeze” (WF) particles to prevent spurious freezing of the Martini solvent at low temperature.18 The standard system size was set to 12 × 10 × 10 nm. After minimization (steepest descent, 1000 steps), a short equilibration was run at 300 K (300–600 ps) to relax the initial configuration generated by the insane.py script. Initial gel conformations were taken from the output of the lowest temperatures simulated for each cholesterol mole fraction in the fluid to gel transition. The equilibrated system was then used as starting point for 3 μs production runs at various temperatures, ranging from 275 to 335 K. For all the analyses presented in this manuscript, the initial 100 ns of simulation were discarded as equilibration. Conformations were stored for analysis every 1.5 ns and energies every 150 ps. For several of these temperatures, efforts concentrated around the transition, up to nine extra replicas were run with a different initial set of random velocities, initiated from either a fluid or gel initial condition depending on the transition investigated. This protocol has the advantage that it is naively parallel, as different temperatures replicas run independently. In contrast, a heating or cooling protocol requires long, contiguous trajectories at adjacent temperatures, the schedule of which must be decided in advance. While heating/cooling is more like an experimental protocol, heating/cooling rates obtained in simulation are typically very high, and thus the present approach obtains results similar to those obtained with an annealing schedule. This is discussed further below.
Table 1.
Summary of the Simulations Presented in This Studya
| Temperature range (K) |
replicas (no.) |
||||
|---|---|---|---|---|---|
| composition (cholesterol, mol %) | fluid to gel | gel to fluid | fluid to gel | gel to fluid | total simulation time (μs) |
| 0 | 275–305 | 295–325 | 1–7 | 1–3 | 408 |
| 0.5 | 275–305 | 310–340 | 1–7 | 1–5 | 438 |
| 2.6 | 275–305 | 305–335 | 1–7 | 1–5 | 486 |
| 4.6 | 275–325 | 275–325 | 1–10 | 1–5 | 945 |
| 7.7 | 275–305 | 295–325 | 1–5 | 1–5 | 432 |
| 9.8 | 275–305 | 295–325 | 1–5 | 1–5 | 468 |
| 12.9 | 275–305 | 295–325 | 1–5 | 1–5 | 444 |
| 14.9 | 275–305 | 295–325 | 1–5 | 1–7 | 510 |
| 20.0 | 275–305 | 295–325 | 1–5 | 1–5 | 438 |
| 29.9 | 275–305 | 295–325 | 1–5 | 1–3 | 408 |
A larger number of replicas are used in the vicinity of transitions.
The production runs were integrated using a 30 fs time step. Nonbonded interactions were truncated at 1.2 nm. The electrostatic potential was shifted from 0.0 to 1.2 nm and a relative dielectric constant of 15 was used, as required by the force field.18 The Lennard-Jones potential was shifted from 0.9 to 1.2 nm. The phospholipids, the cholesterol and the solvent were coupled separately to an external bath using the Bussi–Donadio–Parinello thermostat35 with a relaxation time of 1.0 ps (this protocol was checked for systems with relatively low amount of cholesterol and did not affect the results; see Figure S1). Note that the use of a thermostat that provides canonically distributed energy fluctuations is advised when simulating thermodynamic phase transitions, since the behavior of systems in the vicinity of a phase transition is dominated by fluctuations. The pressure was maintained constant at 1 bar using a Parrinello–Rahman36 semi-isotropic barostat with a relaxation time of 12.0 ps. The compressibility of the system was set to 3 × 10⁻⁴ bar−1, as is standard for Martini simulations.
Characterization of Thermodynamic State.
The thermodynamic state of the system was monitored using four quantities: enthalpy, (pseudo) heat capacity at constant pressure, the average area per hydrocarbon chain, and a lipid chain order parameter. Averages over all frames and replicas for each temperature, cholesterol mole fraction, and initial conditions are indicated by angle brackets: ⟨·⟩. Reported errors are the standard deviation among replicas.
The enthalpy H of the entire system was obtained by analyzing the trajectory (configurations stored every 1.5 ns) separately for each temperature, composition, and replica, and reported on a per lipid basis. For an equilibrium ensemble, the heat capacity at constant pressure is obtained from the fluctuations of the enthalpy by
| (1) |
where R is the gas constant and T is the absolute temperature. In cases for which thermodynamic equilibrium was not obtained, the fluctuations in the enthalpy are referred to as a pseudo heat capacity, denoted by a tilde.
For each frame saved, a Voronoi tesselation was computed for the system,37 each polygon based on the center of mass of each lipid chain and each cholesterol (gray overlays in Figure 1). The area of each lipid (excluding cholesterol) was approximated as the sum of the areas of both its chains. A single value per frame was obtained by averaging over all lipids.
Figure 1. |.
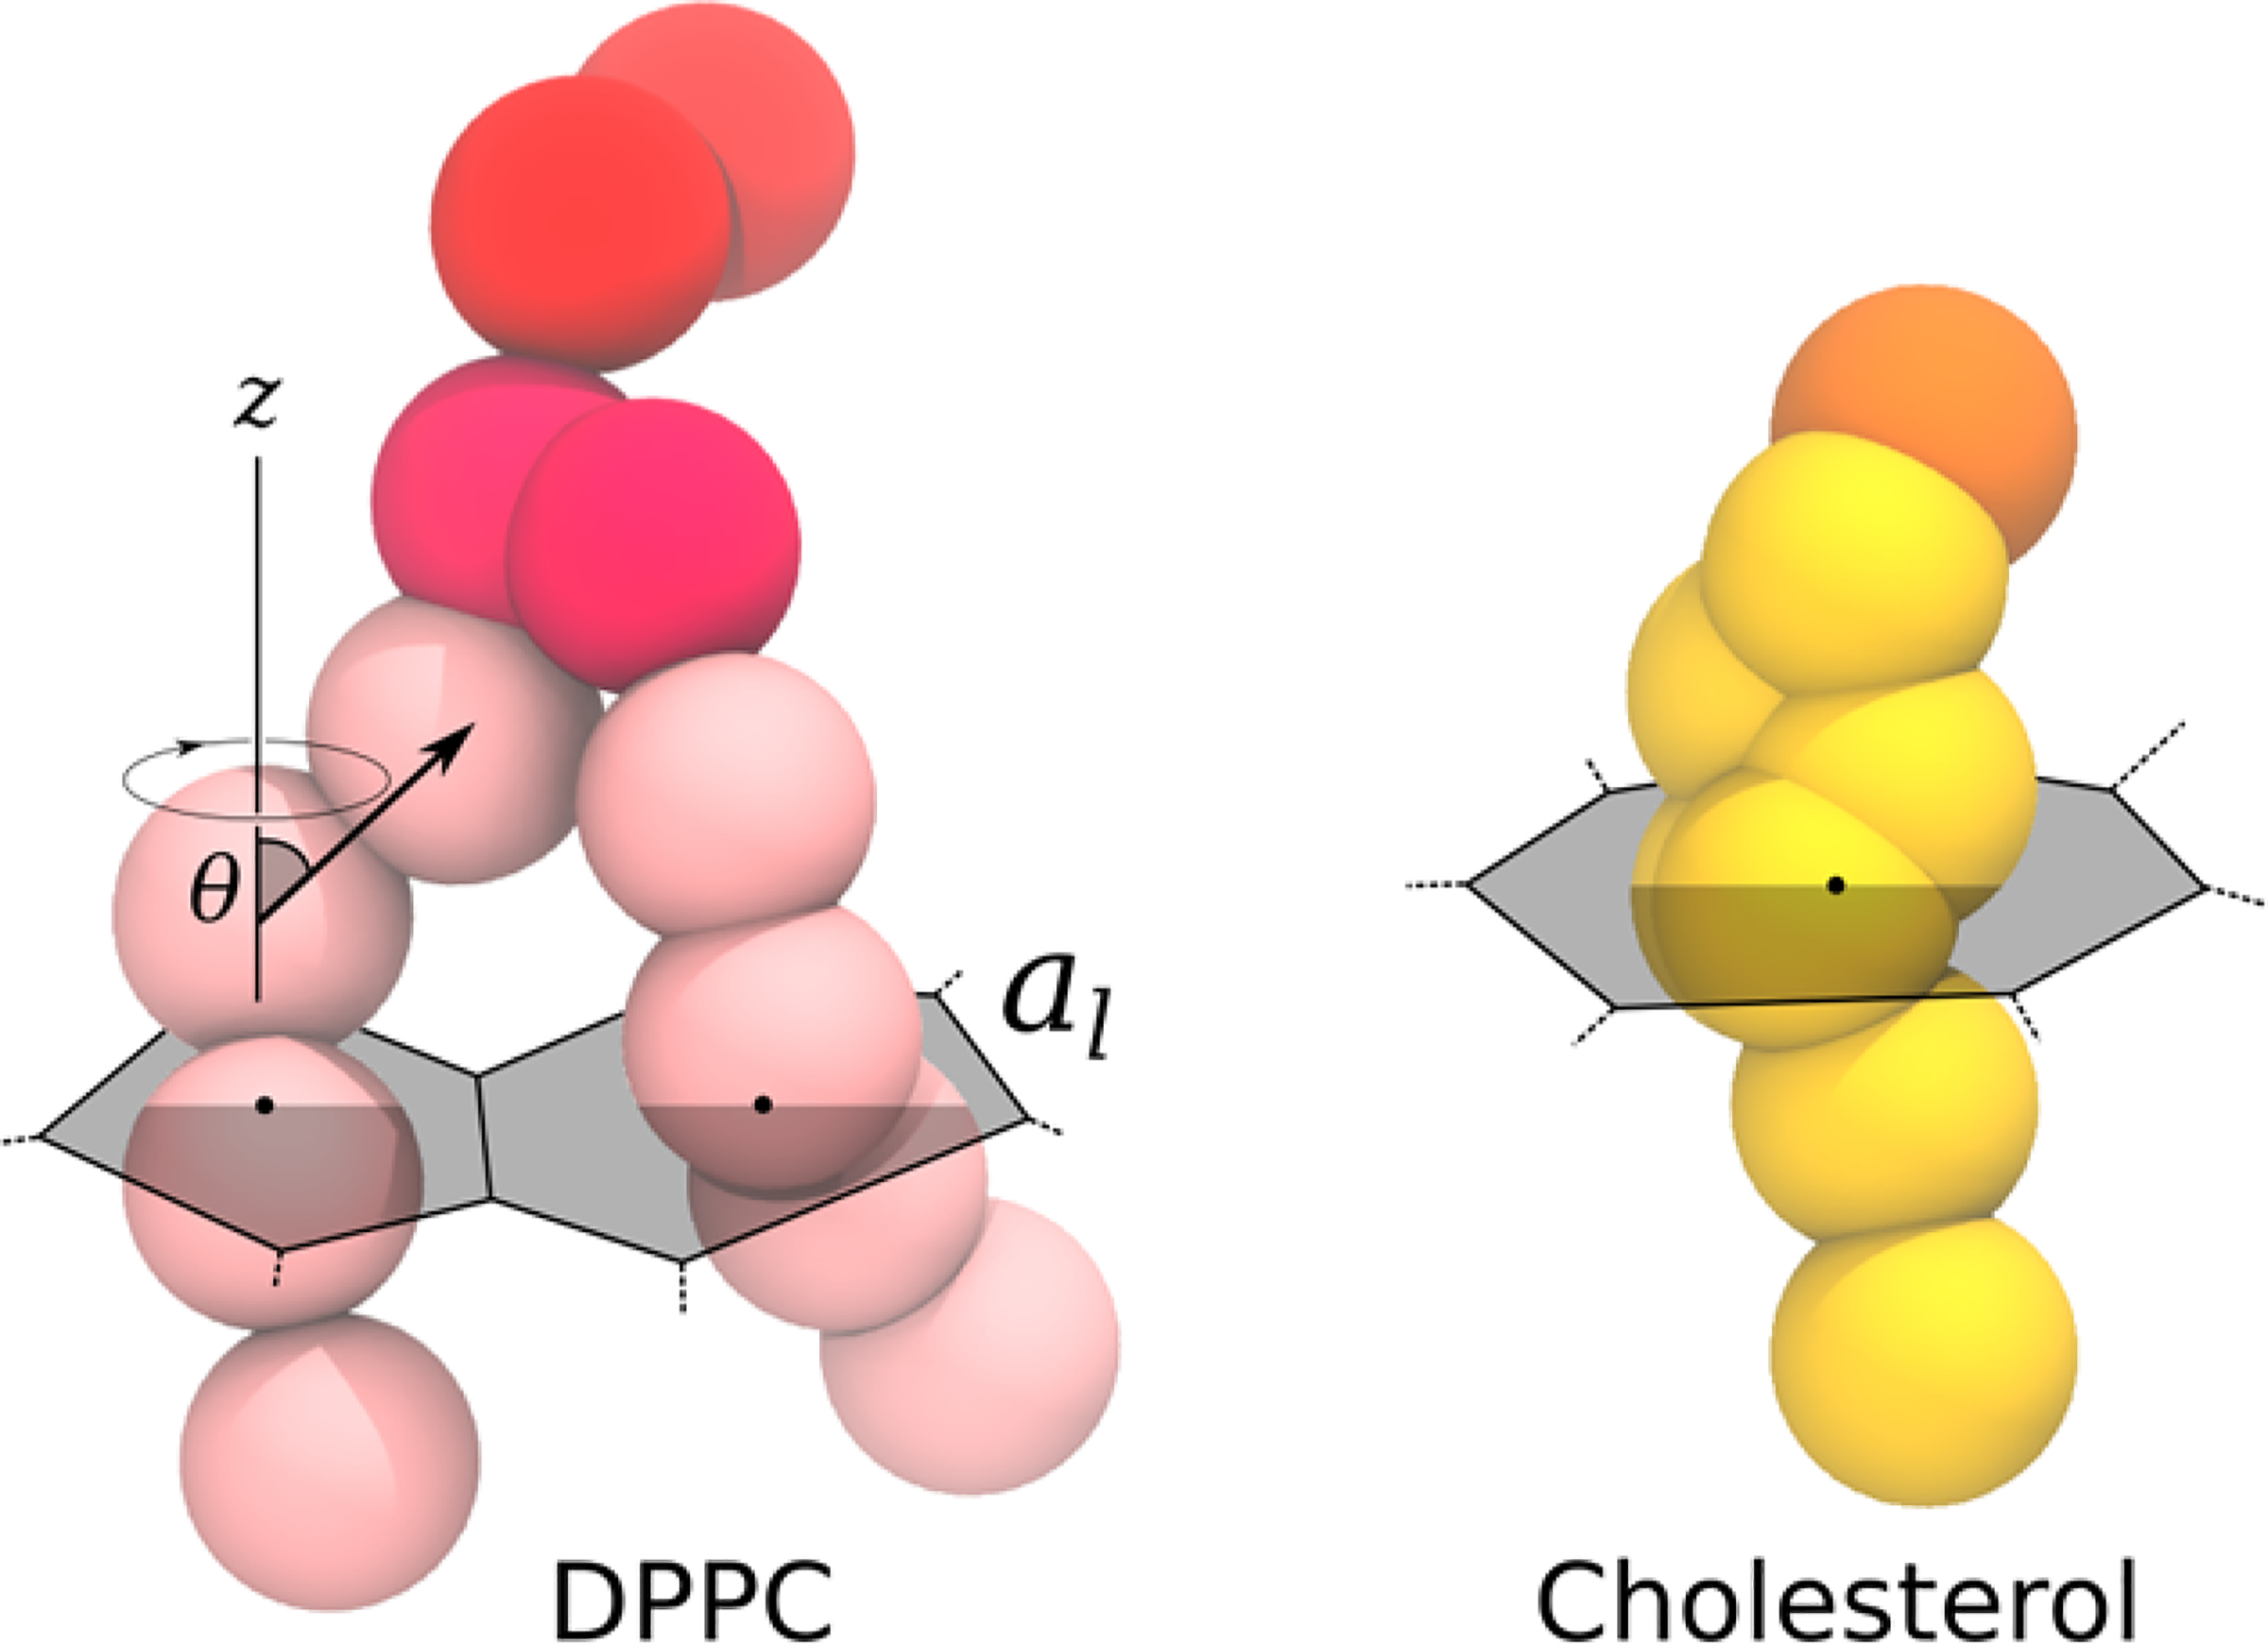
Martini representation for DPPC lipid and cholesterol, and schematic representation of the quantities used to describe lipid properties in this manuscript: tail order parameter and area per lipid (approximated as the sum of its areas per tail as defined by a Voronoi decomposition).
A chain order parameter46 was computed using the doorder. py tool available on the Martini Web site (http://cgmartini.nl/), which computes the second Legendre polynomial, P2 = 1/2(3 · ⟨cos2 θ⟩ − 1), where θ is the angle between the (approximate) bilayer normal (z axis) and a chosen coarse-grained bond. This calculation was performed every 15 ns (1 in 10 frames), and the average here is also over the lipids. All order parameter results reported below are for the first bonds of the lipid tails (black arrow in Figure 1), which effectively distinguishes ordered and disordered chains in Martini lipids.
RESULTS
Hysteresis in the Enthalpy As a Function of Temperature and Cholesterol.
For cholesterol mole fractions at and below 20 mol %, the enthalpy indicates a transition as a sudden change over a narrow temperature range for both gel and fluid initial conditions (Figure 2). The transition is rounded, but still suggestive of a first-order transition, given that the step-like discontinuity expected at a first-order transition is rounded in a finite system. The error bars in the vicinity of the transition indicate significant variation among the replicas, which arises from a switch from the initial state (so or Ld) into the final state, as shown in Figure S2 for 10 mol % cholesterol. The time elapsed before this switch determines the observed average value of H for a particular replica, and hence variations in this duration determine the fluctuations in the enthalpy; this is discussed further below. Some of the data, especially at lower cholesterol mole fractions, appear to have a small shoulder in the vicinity of the transition. In the authors’ view, the statistical sampling indicated by the errors is not of sufficient quality to ascribe a physical significance to the shoulder.
Figure 2. |.
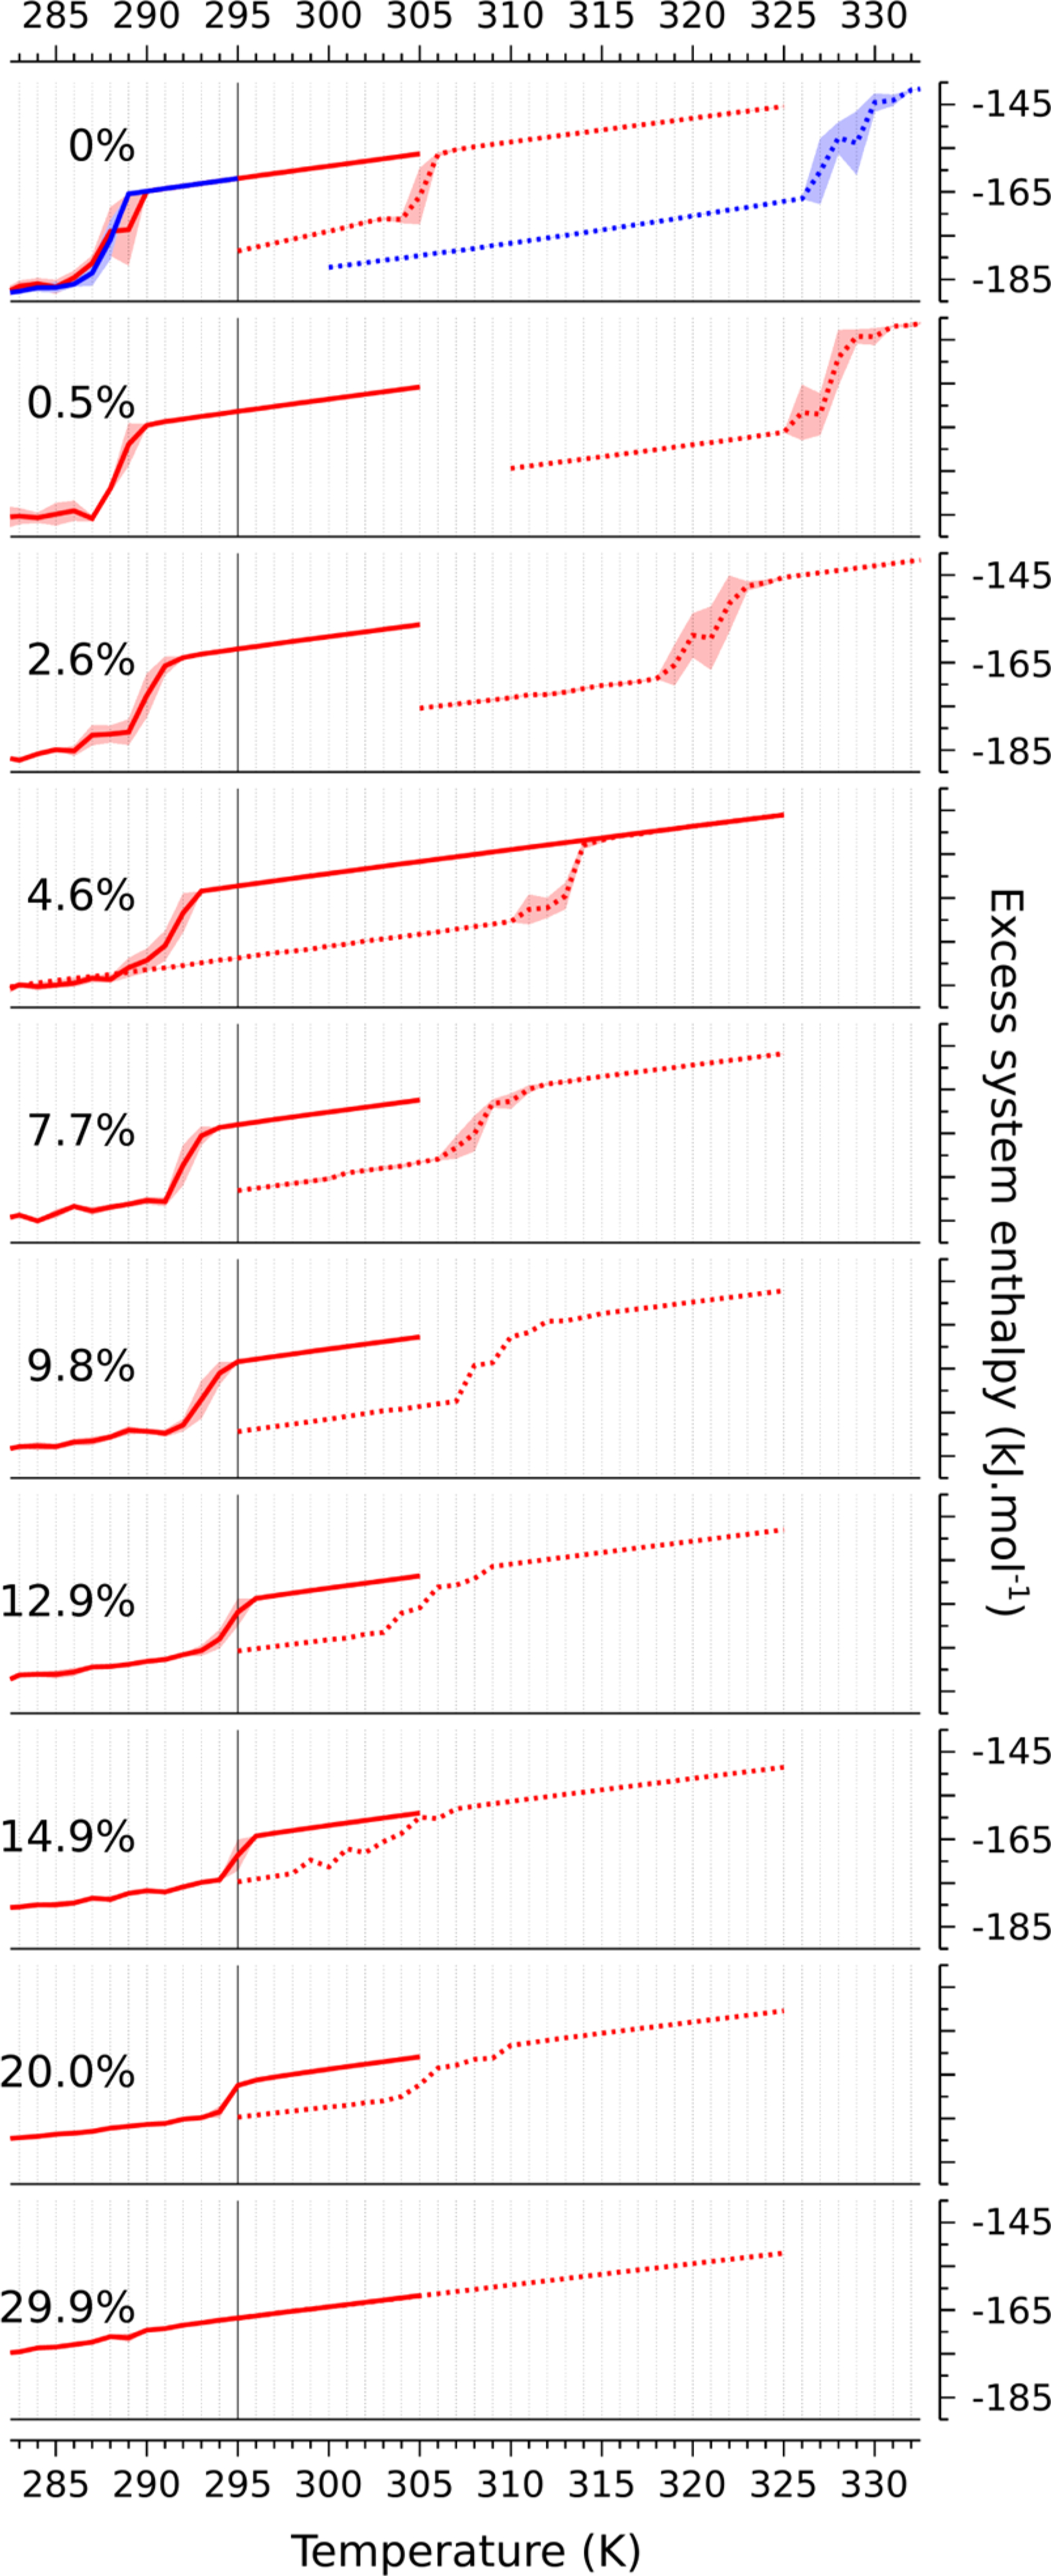
Enthalpy per lipid (H; kJ/mol) as a function of temperature (T; K) for each system studied. Two cycles are investigated: from Ld to so, solid lines; from so to Ld, dotted lines. The associated standard deviations, computed from replicas for each temperature, are shown as background shading. The published transition temperature for pure Martini DPPC lipid (295 K22) is indicated with a vertical straight line. Note here the enthalpy associated with the interactions between solvent beads has been removed: a box containing only the same amount of solvent beads as present in these systems was simulated for each temperature, and the obtained average enthalpies were subtracted from the plots. At 0% cholesterol, the enthalpy of a simulation using a nonorthorhombic unit cell is also shown (blue).
The temperature at which the transition happens depends strongly on the initial condition. The transition from ordered to fluid happens between 10 and 40 K higher in temperature than the fluid to ordered transition, defining a clear hysteresis loop for each cholesterol mole fraction at and below 20 mol %. Even more than the abruptness of the transition, this indicates clearly that over this cholesterol range the so to Ld transition is first-order in Martini, consistent with published phase diagrams9 and simulations.28,29 Apart from signaling the character of the transition, hysteresis indicates that the forward and reverse processes happen by different physical mechanisms—the so phase melts differently than the Ld freezes.
RESULTS
The width of the hysteresis loop is cholesterol dependent. Upon adding a single cholesterol to each leaflet of the pure DPPC bilayer, the hysteresis loop appears to more than double in width, from about 17 to 39 K, with most of the difference accounted for by an increase in the so to Ld transition temperature. Additional cholesterol increases the Ld to so transition temperature slightly, and decreases the so to Ld transition temperature significantly, with the overall effect of shrinking the loop.
Why does a single cholesterol stabilize the melting of the gel phase? Simulations of the 0 mol % system with an oblique unit cell (see Figure S3) suggest that the packing of the gel phase is incommensurate with an orthorhombic simulation cell. In a small, orthorhombic cell, packing defects reduce the barrier to melting; the addition of a single cholesterol is sufficient to relieve the packing defect and stabilize the gel against melting. An oblique cell, on the other hand, can be chosen to nearly match the hexagonal packing of the gel phase, reducing packing defects, and stabilizing the gel against melting, as shown in the top panel of Figure 2. With this modification, the gel to fluid transition temperature decreases monotonically with increasing cholesterol.
The latent heat of the transition was calculated by integrating the derivative of the enthalpy plots. The error was estimated by bootstrapping the values obtained among the various replicas simulated: 10000 plots were generated, randomly picking values from each replica at each temperature. Consistent with experimental data, the latent heat of the transition generally decreases as cholesterol increases, but is systematically lower than the experimental value (by 5–10 kJ/mol). The fact that the dependence of the enthalpy of the transition in Martini is qualitatively similar to the experimental trend is surprising—coarse-graining reduces the number of degrees of freedom, hence reducing the system entropy. As the melting transition involves disordering of the hydrocarbon chains, one expects a significant contribution to the entropy as the transition is crossed. The latent heat seems to depend weakly on the direction of the transition (Figure 3), consistent with earlier reports.28
Figure 3. |.
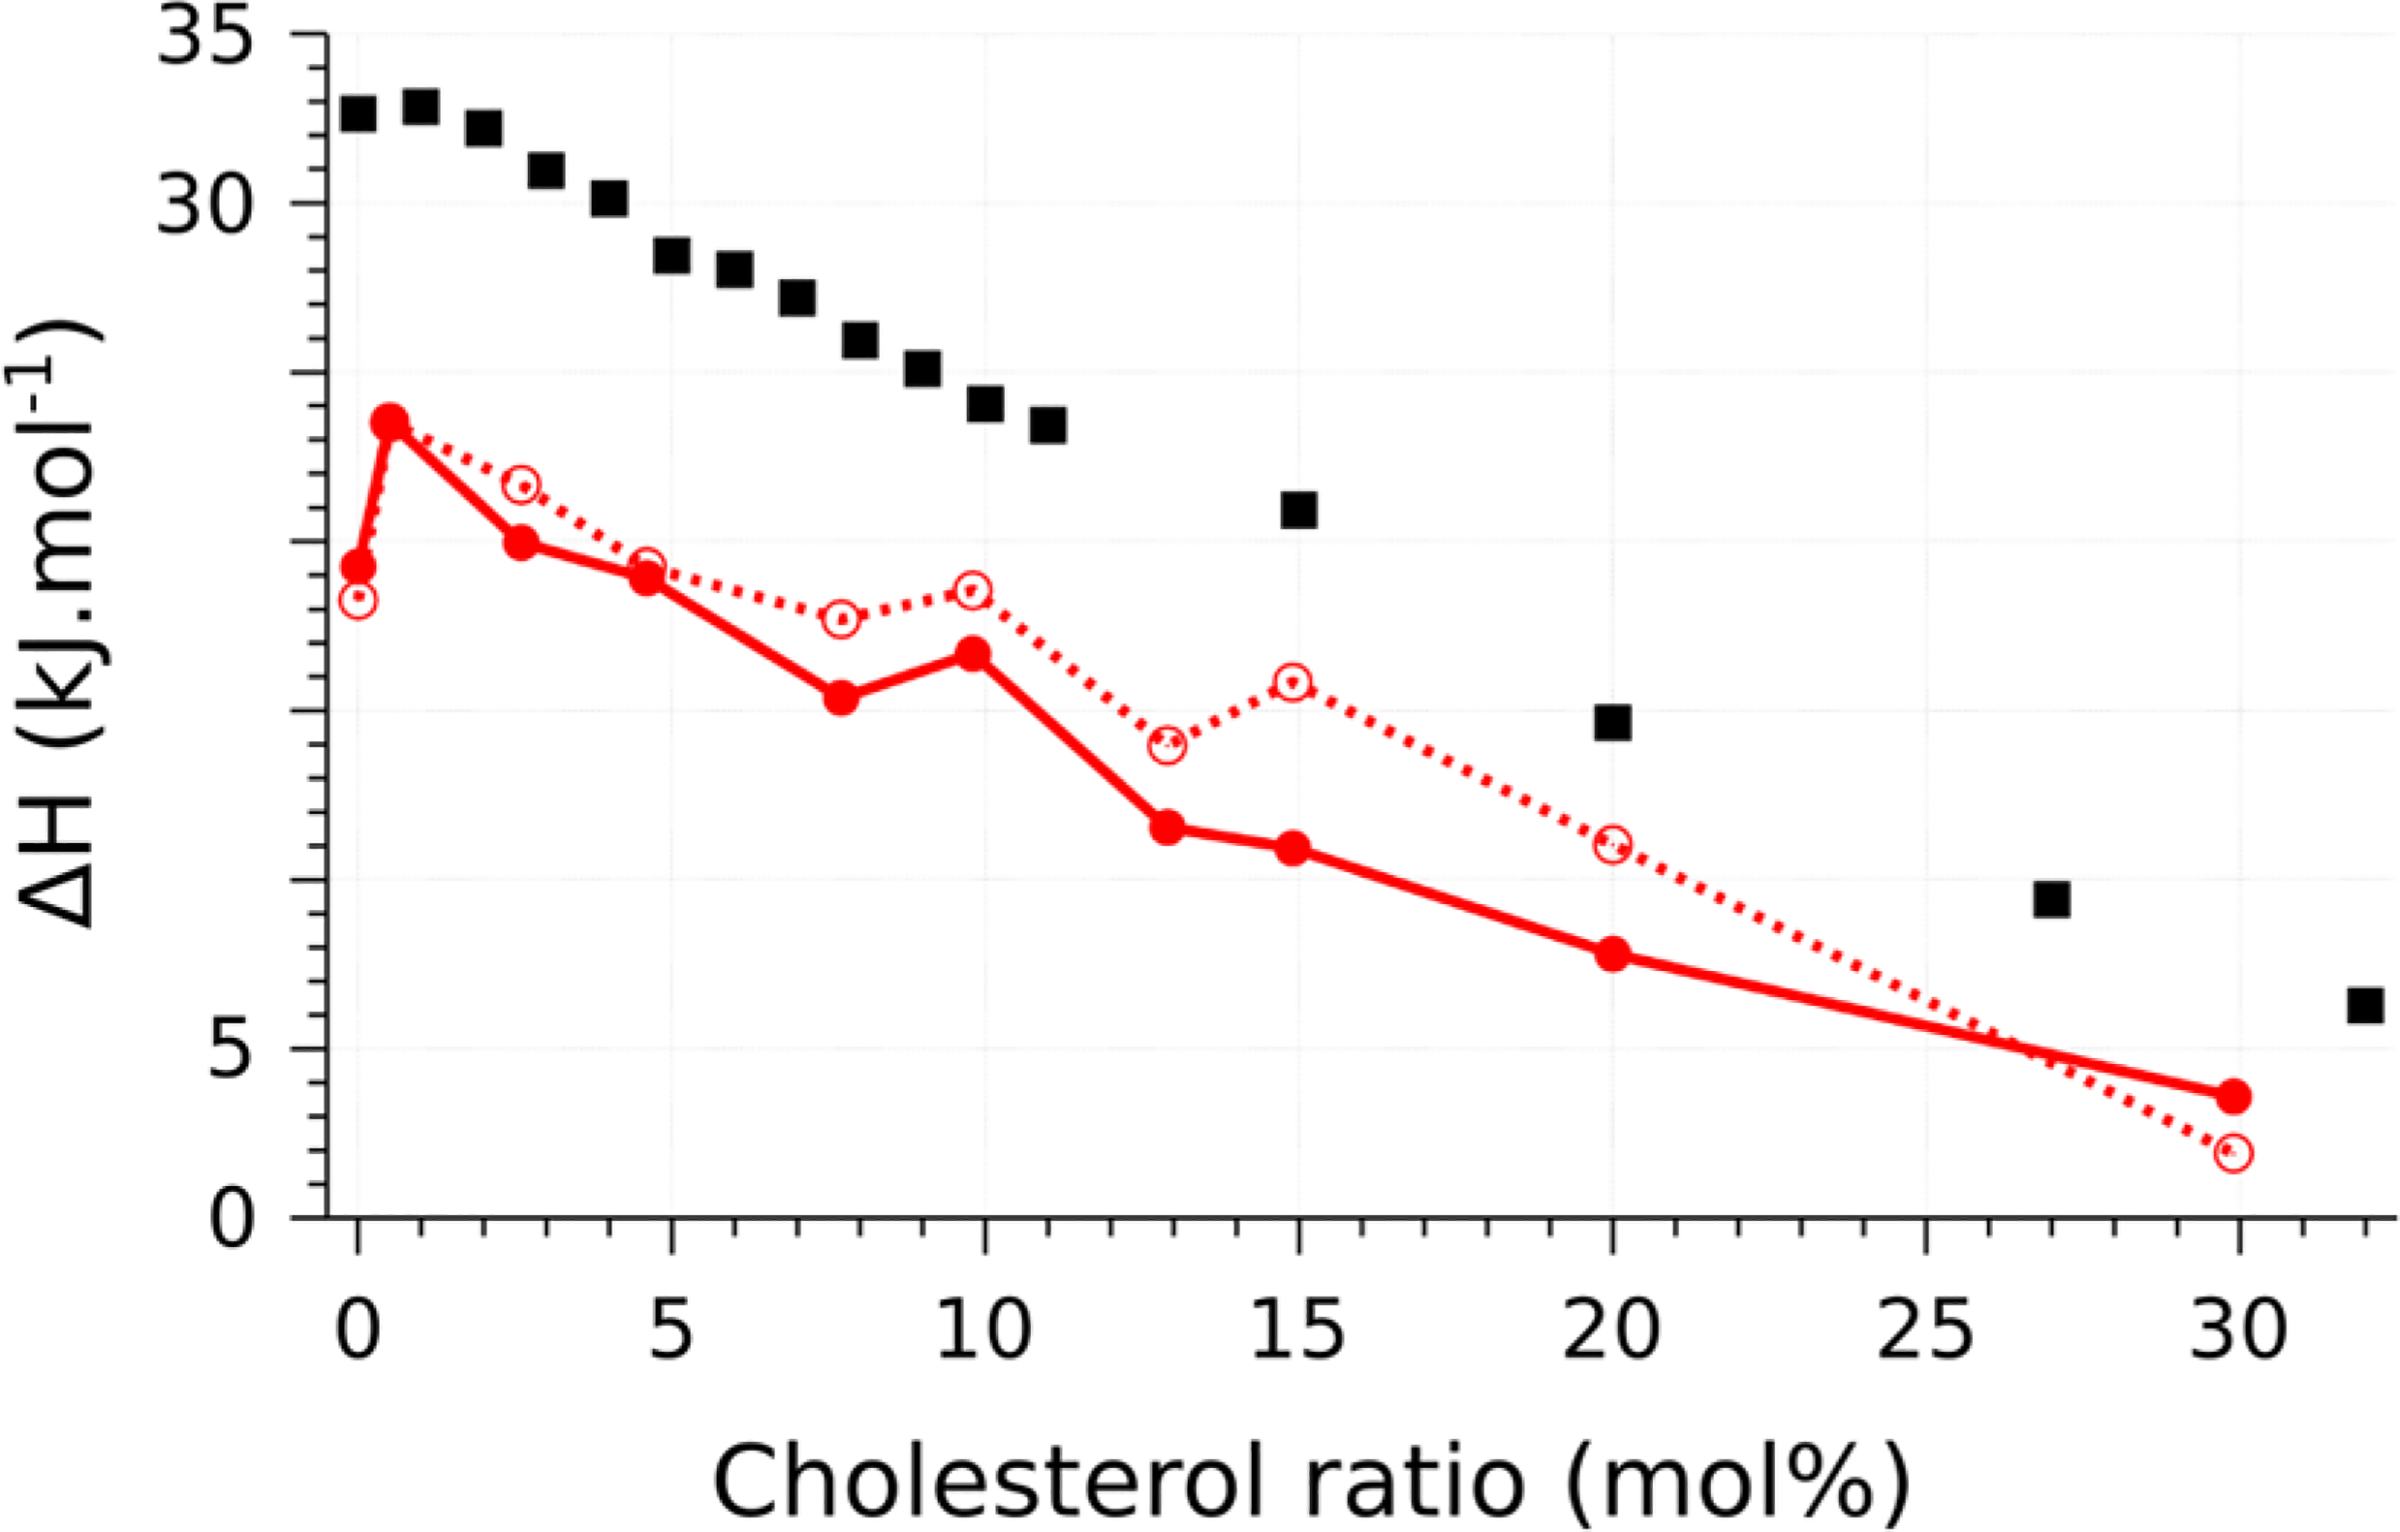
Latent heat of transition. The experimental values (black squares) are from39 and.40 Values obtained by simulation (Ld to so solid lines, so to Ld dotted lines) are reported per lipid to provide an intensive measurement. In each case, the standard deviation (computed from bootstrapping) is below 0.1 kJ/mol.
At 30 mol % cholesterol, the enthalpy increases continuously as a function of temperature, displaying no hysteresis, and suggesting that there is no longer a first-order phase transition from so to Ld. This observation is consistent with phase diagrams which report a single liquid-ordered (Lo) phase as a function of cholesterol at roughly one-quarter cholesterol and above.9 However, this alone does not rule out a second order transition, at which the thermodynamic potentials are continuous. To determine whether this is the case, the heat capacity was measured, as discussed next.
Pseudo Heat Capacity As a Function of Cholesterol Content.
For each system, a “pseudo heat capacity” (denoted ) was computed as described in eq 1—pseudo, because as shown in Figure 2, equilibrium is not obtained for cholesterol mole fractions below 30 mol %. At compositions below 30 mol %, has two peaks, corresponding to the transitions from the metastable to the stable phase, as shown in Figure 4. Note that the fluctuations in the enthalpy are not arising in each case from transitions between the two thermodynamic states, but rather from a single transition from the initial, metastable state into the stable state. (A typical trajectory of the enthalpy as a function of simulation time is shown in Figure S2.) The fluctuations therefore depend on how long the trajectory remains in the initial state before switching—a longer-lived metastable state corresponds to a larger amplitude of the fluctuation. This is a consequence of the finite duration of the trajectory, as a much longer trajectory would switch between the two metastable states, and eliminate hysteresis. (In selected cases, trajectories up to 50 times longer were run, but no transitions from the free energy minimum to the metastable state were observed.)
Figure 4. |.
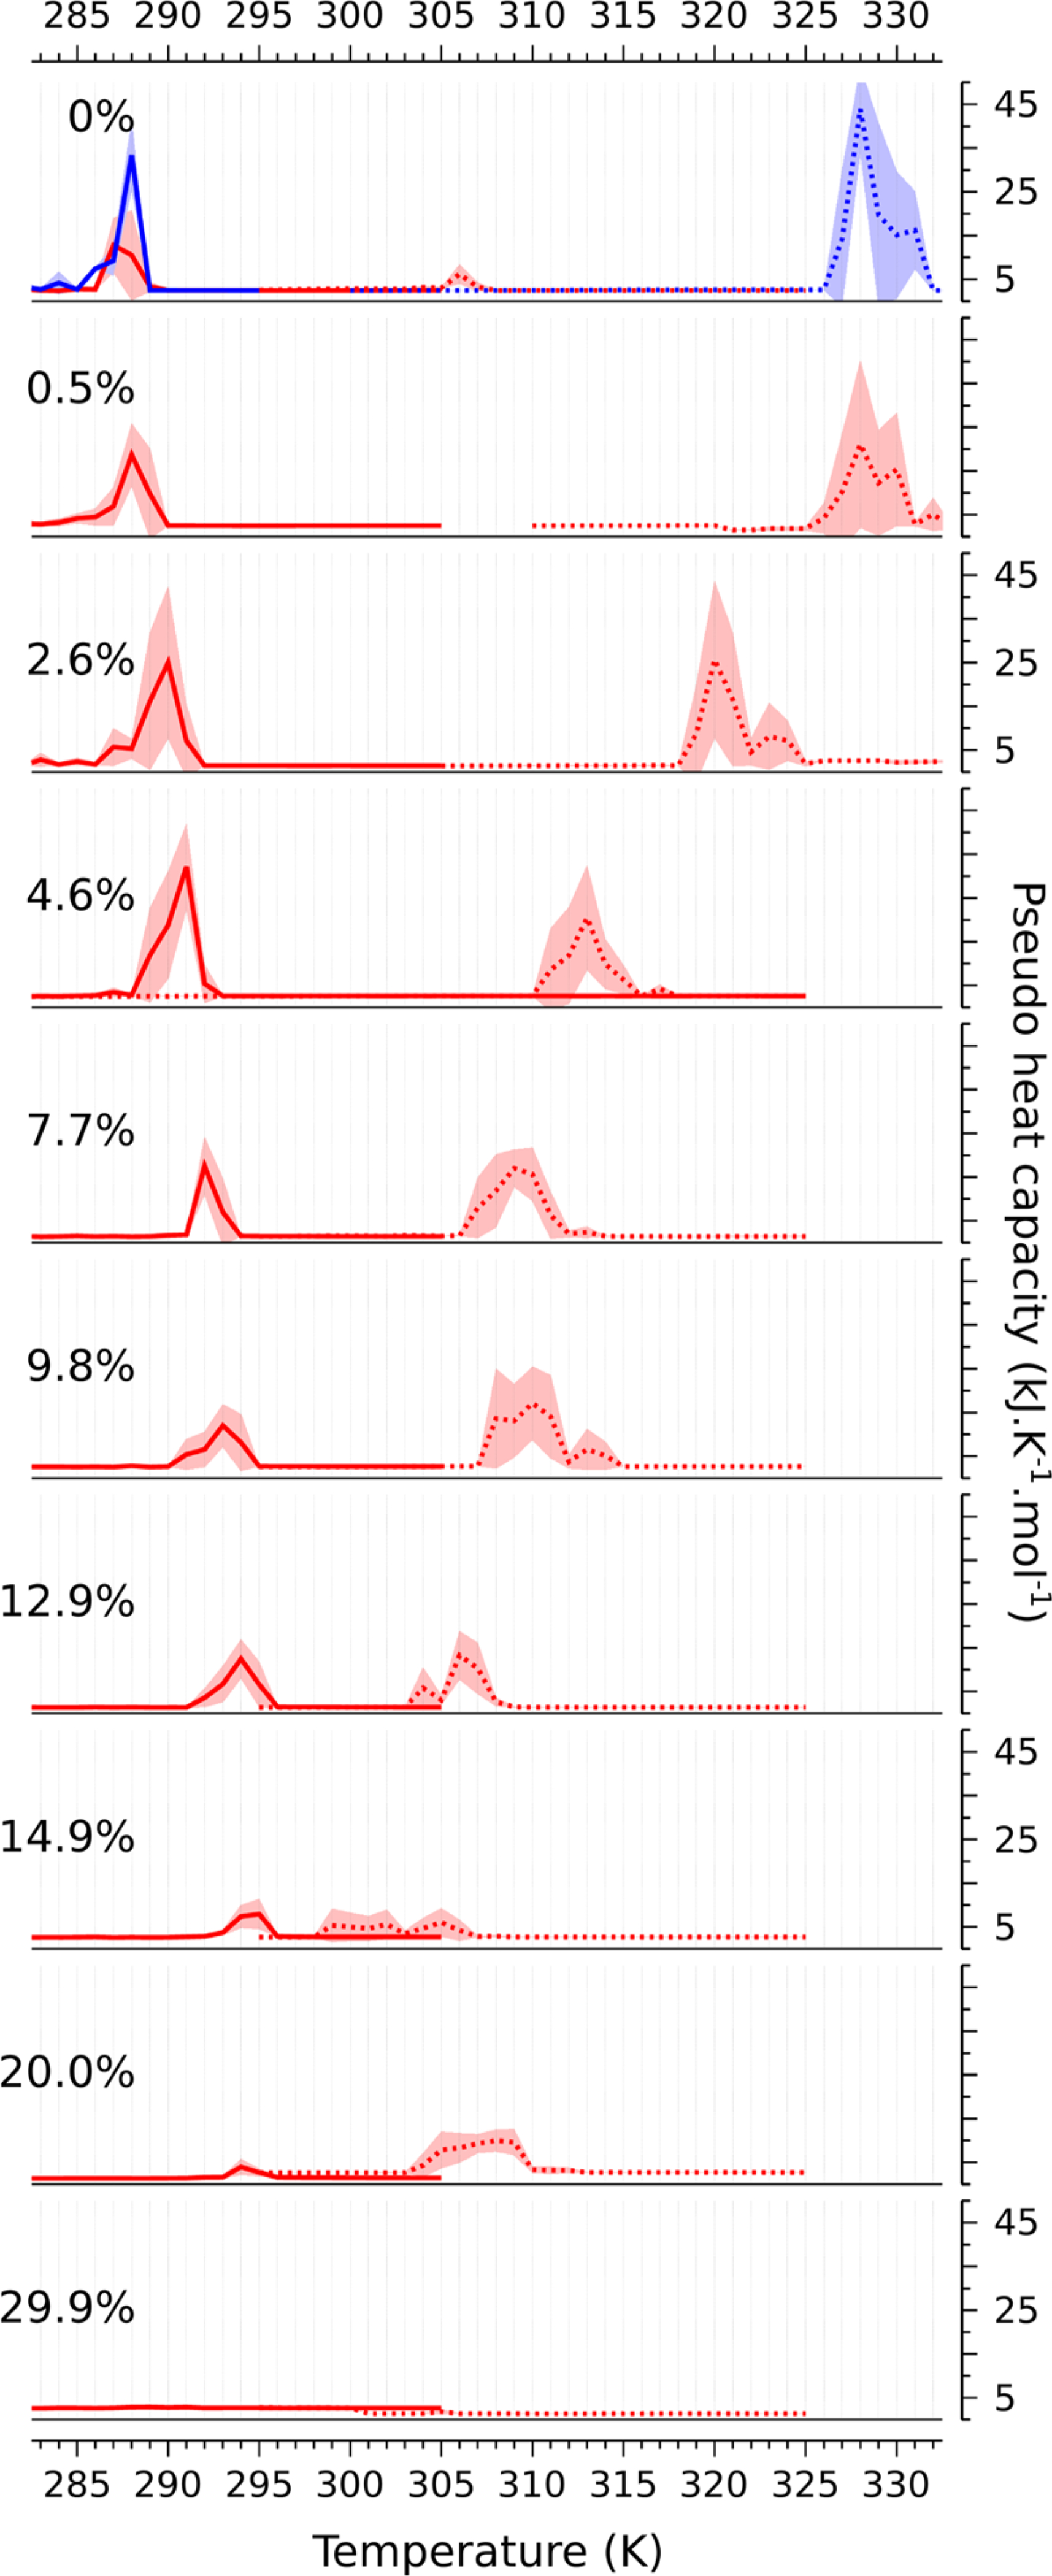
Pseudo heat capacity (; kJ/K) as a function of temperature (T; K) for each system studied. Two cycles are investigated: from fluid (Ld) to gel (so), straight lines; from gel to fluid, dotted lines. The data for the oblique simulation cell at 0 mol % cholesterol are shown in blue in the top panel. The associated standard deviations, computed from replicas for each temperature, are shown in background filling.
The amplitude of the peaks in decreases with increasing cholesterol concentration, until ultimately they merge and disappear at 30 mol %. This suggests that at 30 mol %, there is no longer any transition, including of the continuous variety. Even in a finite system, where the critical fluctuations are truncated by the system size, one expects a residual of the divergence in the heat capacity in the form of a rounded and shifted peak.41 Though there is a very slight bump in the heat capacity at 30 mol % cholesterol, it is difficult to argue that this is evidence for such a divergence. If indeed the system is in a single Lo phase at this composition, it implies that there must be at least one critical point as a function of temperature, between 20 and 30 mol % cholesterol.42 This will be revisited in the discussion.
Visual inspection of the trajectories at 30 mol % reveals transient, local hexagonal packing at lower temperatures, and an unstructured fluid phase at higher temperature (Figure 5). On the basis of the analysis presented above, the hexagonal packing at lower temperature is posited to indicate proximity to the so/Lo boundary, which would be crossed at low temperature by varying cholesterol mole fraction.7,9 Though visually quite striking, no quantitative evidence for two-phase coexistence is observed at any temperature at 30 mol % cholesterol in the system size studied here.
Figure 5. |.
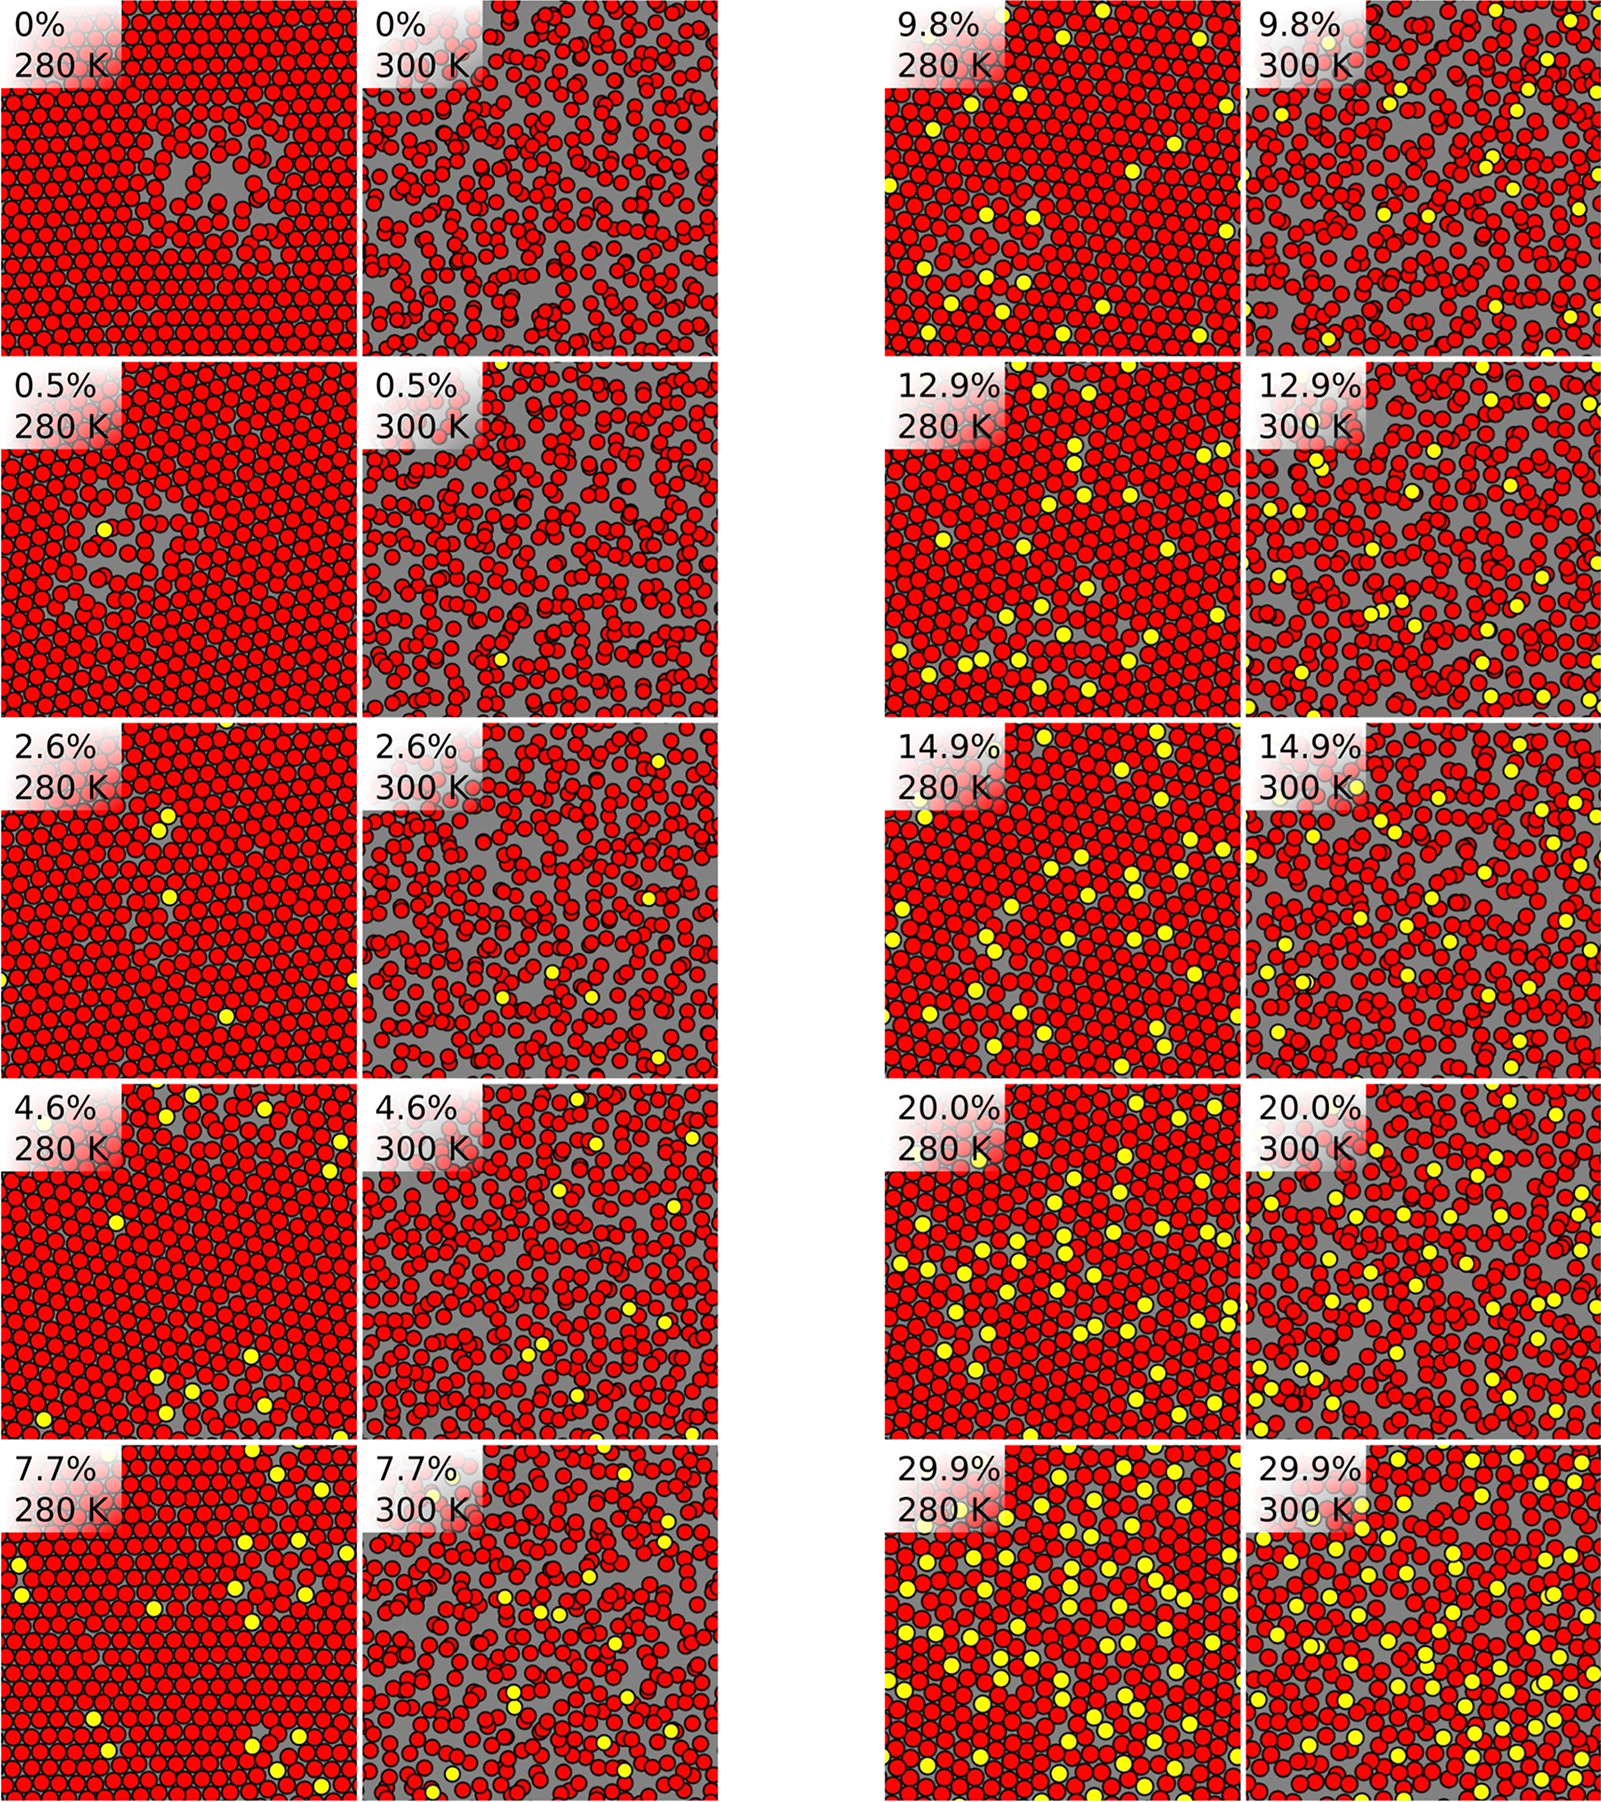
Center of mass locations of DPPC chains (red) and cholesterol (yellow) for one leaflet of each cholesterol concentration at 280 and 300 K.
Structural Observables As a Function of Cholesterol and Temperature.
The transitions between metastable states and the concomitant hysteresis are evident in both the area per chain (Figure 6A) and the lipid order parameter (Figure 6B). These observables are also consistent with the trends reported above in the enthalpy, including the observation of the widest hysteresis loop at 0.5 mol % cholesterol, and the most significant cholesterol dependent shifts occurring for the ordered to fluid (higher temperature) transition. They are also consistent with the disappearance of the transition at 30 mol % cholesterol, at which both observables increase continuously with temperature.
Figure 6. |.
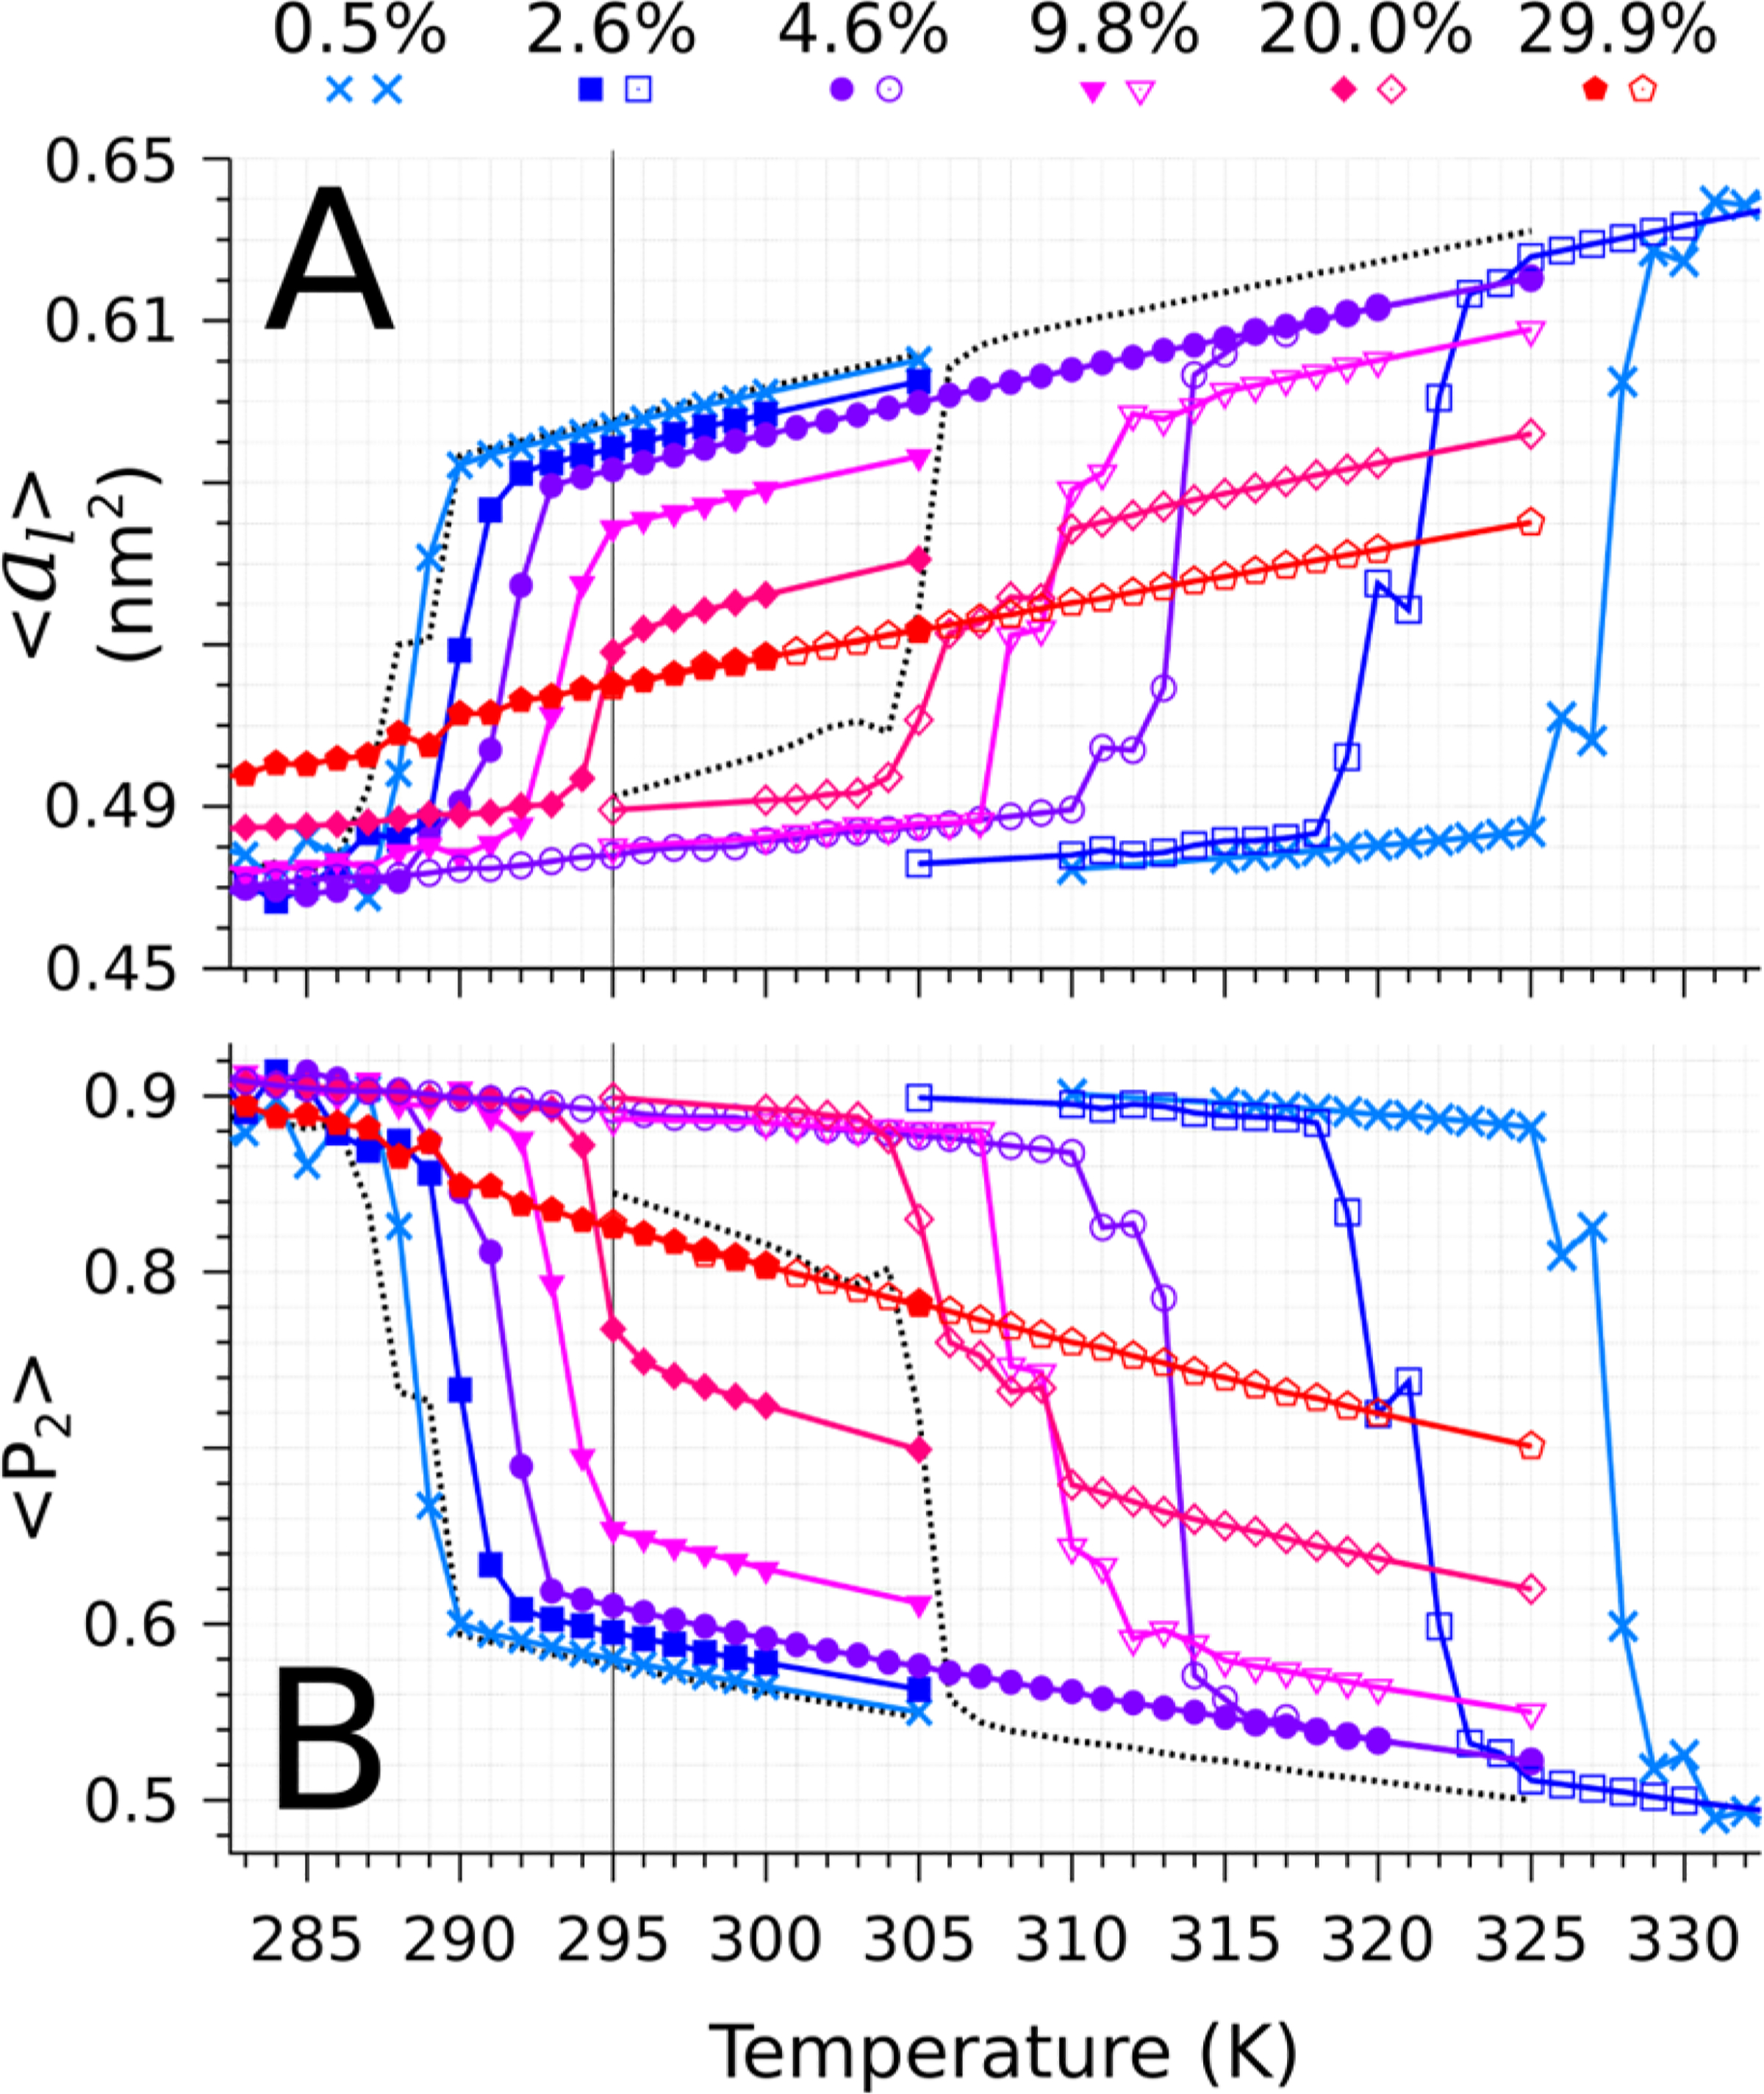
Averaged structural properties (over time and trajectory replicas) at each temperature T (K) for various cholesterol mole fractions for both transition cycles. Panel A: Area per lipid (nm2). Panel B: Average order parameter. For details about the computation of these quantities, see the Methods section. In both panels, the values for the pure DPPC systems are reported as a dashed line.
DISCUSSION
The present results build on previous efforts to map the phase diagram of Martini lipids.22,27–29 Of particular interest is a recent paper from Smit and co-workers that used a similar “computational calorimetry” methodology to compare the gel/liquid phase transition in Martini and in a more coarse-grained model developed for discrete particle dynamics simulations.27 They reported data for 14, 16, and 18 carbon Martini chains, finding evidence in each for a single gel fluid transition. These systems were all the same size (512 lipids) and subjected to the same simulation protocol, yet the 16 carbon DPPC chains curiously exhibited significantly more hysteresis than the other two cases. More recently Zhang et al. carried out extensive simulations of the binary DPPC:cholesterol mixture with Martini at 0, 20, 25, 30, 40, and 50 mol % cholesterol.29 In significantly larger systems (ca. 2432 lipid molecules), they also observe hysteresis in the area per lipid and chain order parameters at 0 and 20 mol % cholesterol, but not at higher cholesterol mole fractions, consistent with the data presented here.
The present data include several cholesterol mole fractions at and below 10 mol %. For all cases at and below 20 mol % cholesterol, significant hysteresis is observed. In an orthorhombic simulation box, the width of the hysteresis loop is exquisitely sensitive to cholesterol—the addition of a single cholesterol in each leaflet stabilizes the gel phase with respect to melting, more than doubling the width of the hysteresis loop. The addition of more cholesterol, however, has a weaker effect, and the hysteresis loop begins shrinking with increasing cholesterol. Simulation of the 0 mol % cholesterol case using an oblique simulation cell that closely matches the hexagonal packing of the gel phase appears to resolve this discrepancy, suggesting that melting of the gel in an orthorhombic box is aided by packing defects induced by a mismatch between the unit cell and the symmetry of the low temperature phase. This observation should be of interest to future efforts to quantitatively simulate the gel to fluid transition. It should also be noted that according to published data,4,9 there is a small, closed loop region of two phase coexistence separating the so and Ld phases as a function of temperature. This fact may complicate attaining equilibrium in this region.
Note that the shift with cholesterol in the apparent transition temperature depends on the initial condition—the Ld to so transition increases in temperature with cholesterol (consistent with the experimental data4), while the reverse transition decreases in temperature with increasing cholesterol, after a single cholesterol has been added. Although it is impossible without eliminating the hysteresis to say exactly at what temperature the equilibrium transition occurs, it must occur somewhere inside the loop. This means that the actual Martini transition temperature increases with cholesterol mole fraction, consistent with the experimental data and the simulations of Waheed et al.,28 though we stress that this statement requires either equilibrium data or observation of both the forward and reverse transitions. The latent heat of transformation (Figure 3) also qualitatively follows closely the experimentally observed trend of decreasing with increasing cholesterol mole fraction, but is always below the experimental value, indicating that the entropy of the transition in the Martini model is lower than in the experiment. This is expected, as there is a smaller contribution from chain melting in the coarse-grained model.
We do not find strong evidence for the coexistence of so and Lo phases below the main transition temperature and at cholesterol mole fractions between 10 and 20 mol %, although there is a plateau in middle of the hysteresis loop upon heating, in both the area per lipid and chain order. Consistent with the experimental phase diagrams, however, Zhang et al. reported coexistence in this region using significantly larger systems.
At sufficiently high cholesterol, a uniform Lo phase is expected. At intermediate cholesterol concentration and temperatures above Tm, most published phase diagrams either contain another closed loop containing coexisting Lo/Ld phases, or have the Lo and Ld phases are separated by a phase boundary.9 In the latter case one expects the phase boundary to terminate at a critical point, much like the liquid–vapor line in the van der Waals fluid. The present data do not show any thermodynamic signature consistent with a phase transition as a function of temperature at 30 mol % cholesterol. The enthalpy, chain order, and area per lipid are all continuous as a function of temperature, and the heat pseudo capacity increases monotonically. Though we cannot distinguish between a closed loop and a line, we propose on this basis that in the Martini model no phase boundary is crossed at as a function of temperature at 30 mol % cholesterol. This is consistent with the earliest published phase diagram for the binary mixture due to Ipsen et al.,7 which incorporates both experimental data available at the time and a statistical mechanical model with both translational and chain configurational degrees of freedom. Ipsen et al.’s model predicts a closed miscibility loop of Lo/Ld coexistence, but the loop terminates between 20 and 30 mol % cholesterol, consistent with a single phase at 30 mol % cholesterol. It should be emphasized that other authors have reported data which they interpret as a phase boundary between Lo and Ld that should be crossed as temperature increases at 30 mol %;43 this phase diagram is consistent with a nearest neighbor lattice model published by Alameida.44
With increasing computational power, it is becoming possible for the first time to make quantitative comparisons between simulations and experimentally determined lipid phase diagrams for models that resolve chemical detail. These efforts have the potential to drive improvement of commonly used lipid models like Martini, and also to resolve discrepancies among published phase diagrams. However, rigorous mapping of the phase boundaries and the determination of their nature requires obtaining equilibrium samples (i.e., no hysteresis) and a careful analysis of finite size effects.45 On the basis of a comparison of Zhang et al.’s data29 to our own, larger system sizes are especially important to identify regions of two phases coexistence, and might explain the absence of a boundary in our data at 30 mol % cholesterol. Efforts along these lines are underway.
Supplementary Material
ACKNOWLEDGMENTS
E.L and C.A. were supported by Grant NIH P20GM104316. Computations were performed on the University of Delaware’s community cluster “Mills” and on “Naja,” the latter supported by the NIH IDeA program through Grant NIH P20GM104316.
Footnotes
The authors declare no competing financial interest.
ASSOCIATED CONTENT
Supporting Information
The Supporting Information is available free of charge on the ACS Publications website at DOI: 10.1021/acs.jpcb.6b09728.
Figures showing the effect of the temperature-coupling scheme, time series of the enthalpy, comparison of orthorhombic and oblique simulation cells, and effect of the box dimensions (PDF)
REFERENCES
- (1).Gerl MJ; Sampaio JL; Urban S; Kalvodova L; Verbavatz J-M; Binnington B; Lindemann D; Lingwood CA; Shevchenko A; Schroeder C; et al. Quantitative Analysis of the Lipidomes of the Influenza Virus Envelope and MDCK Cell Apical Membrane. J. Cell Biol 2012, 196 (2), 213–221. [DOI] [PMC free article] [PubMed] [Google Scholar]
- (2).Róg T; Pasenkiewicz-Gierula M; Vattulainen I; Karttunen M Ordering Effects of Cholesterol and Its Analogues. Biochim. Biophys. Acta, Biomembr 2009, 1788 (1), 97–121. [DOI] [PubMed] [Google Scholar]
- (3).Oldfield E; Chapman D Effects of Cholesterol and Cholesterol Derivatives on Hydrocarbon Chain Mobility in Lipids. Biochem. Biophys. Res. Commun 1971, 43 (3), 610–616. [DOI] [PubMed] [Google Scholar]
- (4).Vist MR; Davis JH Phase Equilibria of Cholesterol/Dipalmitoylphosphatidylcholine Mixtures: Deuterium Nuclear Magnetic Resonance and Differential Scanning Calorimetry. Biochemistry 1990, 29 (2), 451–464. [DOI] [PubMed] [Google Scholar]
- (5).Kucerka N; Perlmutter JD; Pan J; Tristram-Nagle S; Katsaras J; Sachs JN The Effect of Cholesterol on Short- and Long-Chain Monounsaturated Lipid Bilayers as Determined by Molecular Dynamics Simulations and X-Ray Scattering. Biophys. J 2008, 95 (6), 2792–2805. [DOI] [PMC free article] [PubMed] [Google Scholar]
- (6).Parasassi T; Di Stefano M; Loiero M; Ravagnan G; Gratton E Cholesterol Modifies Water Concentration and Dynamics in Phospholipid Bilayers: a Fluorescence Study Using Laurdan Probe. Biophys. J 1994, 66 (3), 763. [DOI] [PMC free article] [PubMed] [Google Scholar]
- (7).Hjort Ipsen JH; Karlström G; Mourtisen OG; Wennerström H; Zuckermann MJ Phase-Equilibria in the Phosphatidylcholine-Cholesterol System. Biochim. Biophys. Acta, Biomembr 1987, 905 (1), 162–172. [DOI] [PubMed] [Google Scholar]
- (8).Bartels T; Lankalapalli RS; Bittman R; Beyer K; Brown MF Raftlike Mixtures of Sphingomyelin and Cholesterol Investigated by Solid-State 2H NMR Spectroscopy. J. Am. Chem. Soc 2008, 130 (44), 14521–14532. [DOI] [PMC free article] [PubMed] [Google Scholar]
- (9).Marsh D Liquid-Ordered Phases Induced by Cholesterol: a Compendium of Binary Phase Diagrams. Biochim. Biophys. Acta, Biomembr 2010, 1798 (3), 688–699. [DOI] [PubMed] [Google Scholar]
- (10).Marsh D Cholesterol-Induced Fluid Membrane Domains: a Compendium of Lipid-Raft Ternary Phase Diagrams. Biochim. Biophys. Acta, Biomembr 2009, 1788 (10), 2114–2123. [DOI] [PubMed] [Google Scholar]
- (11).Simons K; Ikonen E Functional Rafts in Cell Membranes. Nature 1997, 387 (6633), 569–572. [DOI] [PubMed] [Google Scholar]
- (12).Lee I-H; Saha S; Polley A; Huang H; Mayor S; Rao M; Groves JT Live Cell Plasma Membranes Do Not Exhibit a Miscibility Phase Transition Over a Wide Range of Temperatures. J. Phys. Chem. B 2015, 119 (12), 4450–4459. [DOI] [PubMed] [Google Scholar]
- (13).Stone MB; Veatch SL Steady-State Cross-Correlations for Live Two-Colour Super-Resolution Localization Data Sets. Nat. Commun 2015, 6, 7347–7356. [DOI] [PMC free article] [PubMed] [Google Scholar]
- (14).Kraft ML; Weber PK; Longo ML; Hutcheon ID; Boxer SG Phase Separation of Lipid Membranes Analyzed with High-Resolution Secondary Ion Mass Spectrometry. Science 2006, 313 (5795), 1948–1951. [DOI] [PubMed] [Google Scholar]
- (15).Levental I; Grzybek M; Simons K Proc. Natl. Acad. Sci. U. S. A 2011, 108, 11411–11416. [DOI] [PMC free article] [PubMed] [Google Scholar]
- (16).Vanommeslaeghe K; Hatcher E; Acharya C; Kundu S; Zhong S; Shim J; Darian E; Guvench O; Lopes P; Vorobyov I; et al. CHARMM General Force Field: a Force Field for Drug-Like Molecules Compatible with the CHARMM All-Atom Additive Biological Force Fields. J. Comput. Chem 2010, 31 (4), 671–690. [DOI] [PMC free article] [PubMed] [Google Scholar]
- (17).Dickson CJ; Madej BD; Skjevik ÅA; Betz RM; Teigen K; Gould IR; Walker RC Lipid14: the Amber Lipid Force Field. J. Chem. Theory Comput 2014, 10, 865–879. [DOI] [PMC free article] [PubMed] [Google Scholar]
- (18).Marrink S-J; Risselada HJ; Yefimov S; Tieleman DP; de Vries AH The MARTINI Force Field: Coarse Grained Model for Biomolecular Simulations. J. Phys. Chem. B 2007, 111, 7812–7824. [DOI] [PubMed] [Google Scholar]
- (19).de Meyer FJ-M; Benjamini A; Rodgers JM; Misteli Y; Smit B Molecular Simulation of the DMPC-Cholesterol Phase Diagram. J. Phys. Chem. B 2010, 114 (32), 10451–10461. [DOI] [PubMed] [Google Scholar]
- (20).Izvekov S; Voth GA Multiscale Coarse-Graining of Mixed Phospholipid/Cholesterol Bilayers. J. Chem. Theory Comput 2006, 2, 637. [DOI] [PubMed] [Google Scholar]
- (21).Hadley KR; McCabe C A Structurally Relevant Coarse-Grained Model for Cholesterol. Biophys. J 2010, 99 (9), 2896–2905. [DOI] [PMC free article] [PubMed] [Google Scholar]
- (22).Marrink S-J; Risselada HJ; Mark AE Simulation of Gel Phase Formation and Melting in Lipid Bilayers Using a Coarse Grained Model. Chem. Phys. Lipids 2005, 135, 223–244. [DOI] [PubMed] [Google Scholar]
- (23).Bennun SV; Hoopes MI; Xing C; Faller R Coarse-Grained Modeling of Lipids. Chem. Phys. Lipids 2009, 159, 59–66. [DOI] [PubMed] [Google Scholar]
- (24).Risselada HJ; Marrink S-J The Molecular Face of Lipid Rafts in Model Membranes. Proc. Natl. Acad. Sci. U. S. A 2008, 105 (45), 17367–17372. [DOI] [PMC free article] [PubMed] [Google Scholar]
- (25).Baoukina S; Mendez-Villuendas E; Bennett WFD; Tieleman DP Computer Simulations of the Phase Separation in Model Membranes. Faraday Discuss 2013, 161 (0), 63–75. [DOI] [PubMed] [Google Scholar]
- (26).Marrink S-J; Tieleman DP Perspective on the Martini Model. Chem. Soc. Rev 2013, 42 (16), 6801–6822. [DOI] [PubMed] [Google Scholar]
- (27).Rodgers JM; Sørensen J; de Meyer FJ-M; Schiøtt B; Smit B Understanding the Phase Behavior of Coarse-Grained Model Lipid Bilayers Through Computational Calorimetry. J. Phys. Chem. B 2012, 116 (5), 1551–1569. [DOI] [PubMed] [Google Scholar]
- (28).Waheed Q; Tjörnhammar R; Edholm O Phase Transitions in Coarse-Grained Lipid Bilayers Containing Cholesterol by Molecular Dynamics Simulations. Biophys. J 2012, 103 (10), 2125–2133. [DOI] [PMC free article] [PubMed] [Google Scholar]
- (29).Zhang Y; Lervik A; Seddon J; Bresme F A Coarse-Grained Molecular Dynamics Investigation of the Phase Behavior of DPPC/Cholesterol Mixtures. Chem. Phys. Lipids 2015, 185, 88–98. [DOI] [PubMed] [Google Scholar]
- (30).Melo MN; Ingolfsson HI; Marrink S-J Parameters for Martini Sterols and Hopanoids Based on a Virtual-Site Description. J. Chem. Phys 2015, 143 (24), 243152. [DOI] [PubMed] [Google Scholar]
- (31).Sodt AJ; Sandar ML; Gawrisch K; Pastor RW; Lyman E The Molecular Structure of the Liquid-Ordered Phase of Lipid Bilayers. J. Am. Chem. Soc 2014, 136 (2), 725–732. [DOI] [PMC free article] [PubMed] [Google Scholar]
- (32).Sodt AJ; Pastor RW; Lyman E Hexagonal Substructure and Hydrogen Bonding in Liquid-Ordered Phases Containing Palmitoyl Sphingomyelin. Biophys. J 2015, 109 (5), 948–955. [DOI] [PMC free article] [PubMed] [Google Scholar]
- (33).Abraham MJ; Murtola T; Schulz R; Páll S; Smith JC; et al. GROMACS: High Performance Molecular Simulations Through Multi-Level Parallelism From Laptops to Supercomputers. SoftwareX 2015, 1–2, 19–25. [Google Scholar]
- (34).Wassenaar TA; Ingólfsson HI; Boeckmann RA; Tieleman DP; Marrink S-J Computational Lipidomics with Insane: a Versatile Tool for Generating Custom Membranes for Molecular Simulations. J. Chem. Theory Comput 2015, 11 (5), 2144–2155. [DOI] [PubMed] [Google Scholar]
- (35).Bussi G; Donadio D; Parrinello M Canonical Sampling Through Velocity Rescaling. J. Chem. Phys 2007, 126 (1), 014101. [DOI] [PubMed] [Google Scholar]
- (36).Parrinello M Polymorphic Transitions in Single Crystals: a New Molecular Dynamics Method. J. Appl. Phys 1981, 52 (12), 7182–7190. [Google Scholar]
- (37).Rycroft CH VORO++: a Three-Dimensional Voronoi Cell Library in C. Chaos 2009, 19 (4), 041111. [DOI] [PubMed] [Google Scholar]
- (38).Landau DP; Lifshitz EM Quantum Mechanics; Pergamon Press: 1977. [Google Scholar]
- (39).McMullen TPW; Lewis RNAH; McElhaney RN Differential Scanning Calorimetric Study of the Effect of Cholesterol on the Thermotropic Phase Behavior of a Homologous Series of Linear Saturated Phosphatidylcholines. Biochemistry 1993, 32 (2), 516–522. [DOI] [PubMed] [Google Scholar]
- (40).McMullen TPW; McElhaney RN New Aspects of the Interaction of Cholesterol with Dipalmitoylphosphatidylcholine Bilayers as Revealed by High-Sensitivity Differential Scanning Calorimetry. Biochim. Biophys. Acta, Biomembr 1995, 1234 (1), 90–98. [DOI] [PubMed] [Google Scholar]
- (41).Binder K; Landau DP Finite-Size Scaling at First-Order Phase Transitions. Phys. Rev. B: Condens. Matter Mater. Phys 1984, 30 (3), 1477–1485. [Google Scholar]
- (42).Goldenfeld N Lectures on Phase Transitions and the Renormalization Group; Addison-Wesley: 1992. [Google Scholar]
- (43).Huang TH; Lee CWB; Das Gupta SK; Blume A; Griffin RGA 13C and 2H Nuclear Magnetic Resonance Study of Phosphatidylcholine/Cholesterol Interactions: Characterization of Liquid-Gel Phases. Biochemistry 1993, 32 (48), 13277–13287. [DOI] [PubMed] [Google Scholar]
- (44).Almeida PF A Simple Thermodynamic Model of the Liquid-Ordered State and the Interactions Between Phospholipids and Cholesterol. Biophys. J 2011, 100, 420–429. [DOI] [PMC free article] [PubMed] [Google Scholar]
- (45).Binder K Finite Size Effects at Phase Transitions; Springer: 1992. [Google Scholar]
- (46). The term “order parameter” has two distinct meanings in the context of lipid bilayer phase transitions. The first derives from 2H NMR quadrupolar splitting, which indicate the average degree of order in the hydrocarbon chain; this is similar to the meaning used throughout this paper. The second refers to any observable that distinguishes two thermodynamic phases.38 Although the two are clearly related, since deuterium order parameters do distinguish lipid phases, it is unclear whether the first can be used as the second.
Associated Data
This section collects any data citations, data availability statements, or supplementary materials included in this article.