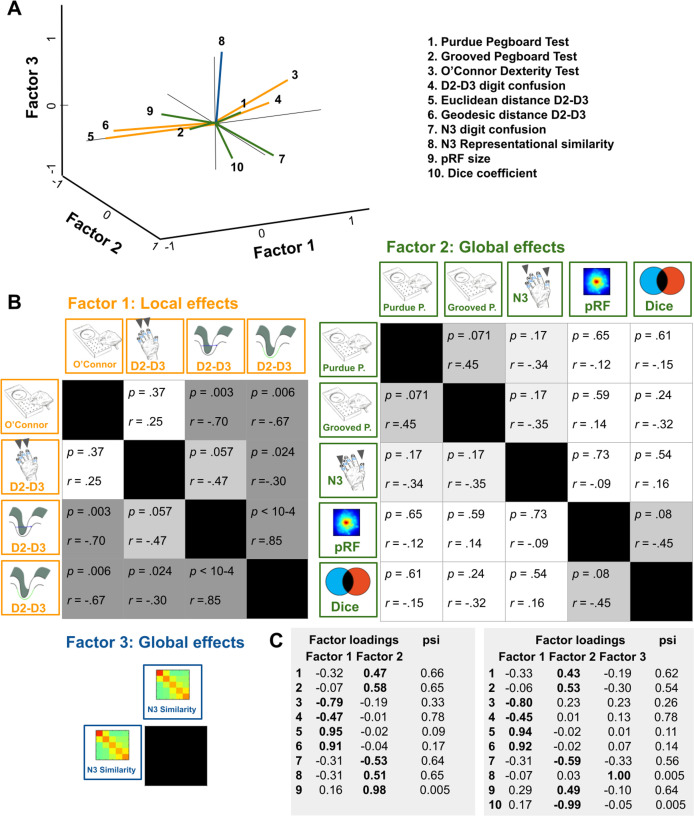
Figure 7. Relation between functional map architectures and behavioral phenotypes.
(A,B) With a three-factorial model, the functional data were categorized into features that link to local effects, that is that cover parts of the map (perceptual confusion between D2 and D3, cortical distance between D2 and D3, factor 1, orange lines) and those that link to global effects, that is that affect the whole map area (representational similarity to N3, pRF size, dice coefficient, factor 2, green lines, and perceptual confusion to N3, factor 3, blue line). Whereas motor performance in the O’Connor dexterity Test loaded positively onto age-related local effects (higher values in O’Connor test, which reflect better performance, relate to higher perceptual confusion between D2 and D3, and lower cortical distance between D2 and D3), performance in the Pegboard Test loaded negatively onto global effects (higher values in Purdue and Grooved Pegboard Test, which reflect worse performance, relate to lower perceptual confusion between N3). (A) factors and visualization of three-factor model, (B) p-values and correlation coefficients (r) of Pearson correlations, (C) factor loadings and psi values of two- and three-factor models. Used were data of n = 17 older adults.

