Fig. 3.
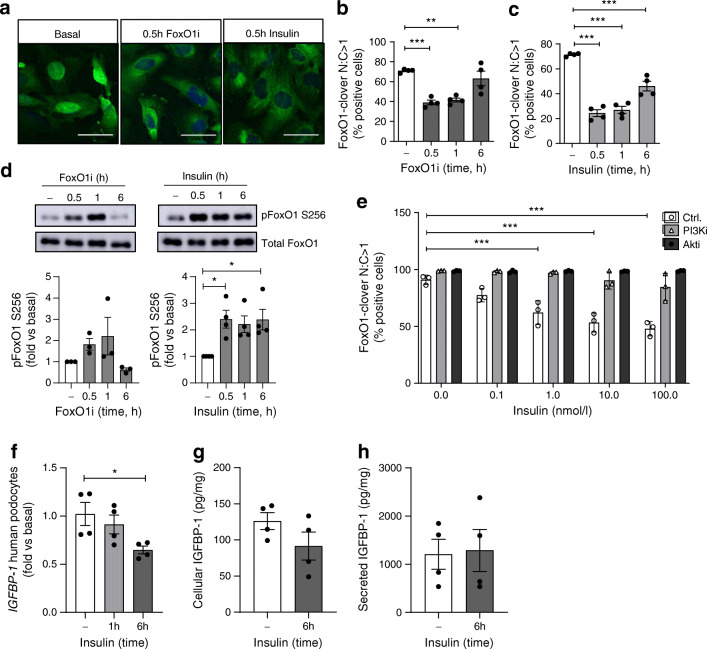
Insulin–PI3K–Akt signalling regulates FoxO1 activity and IGFBP-1 expression in human podocytes. (a) Representative images (scale bar, 50 μm) of human podocytes stably expressing FoxO1-clover and quantification of nuclear FoxO1-clover levels following (b) FoxO1 inhibition (50 ng/ml AS1842856) or (c) insulin stimulation (100 nmol/l), n = 4 experiments, **p < 0.01, ***p < 0.001, one-way ANOVA with Tukey’s multiple comparison test. (d) Representative western blots and matched densitometry demonstrating an increase in phosphorylation of FoxO1 (Ser 256) following insulin stimulation (100 nmol/l), n = 4, *p < 0.05 at 0.5 h, 1 h and 6 h, one-way ANOVA with Tukey’s multiple comparison test. (e) Quantification of nuclear FoxO1-clover in podocytes following 30 min insulin stimulation at the stated doses, with or without additional inhibition of PI3K (200 nmol/l wortmannin) or Akt (200 nmol/l GSK694002), n = 3, ***p < 0.001, one-way ANOVA with Tukey’s multiple comparison test. (f) qPCR results of IGFBP-1 mRNA following insulin stimulation (100 nmol/l), *p < 0.05, one-way ANOVA with Tukey’s multiple comparison test, n = 4. (g) IGFBP-1 levels (pg) to total protein (mg) in podocyte lysates, p = 0.17, unpaired t test, and (h) cell-free podocyte media, following insulin stimulation (100 nmol/l), p = 0.88, unpaired t test, n = 4. Akti, Akt inhibitor; Ctrl., control; FoxO1i, FoxO1 inhibitor; N:C, ratio of nuclear to cytoplasmic; PI3Ki, PI3K inhibitor

