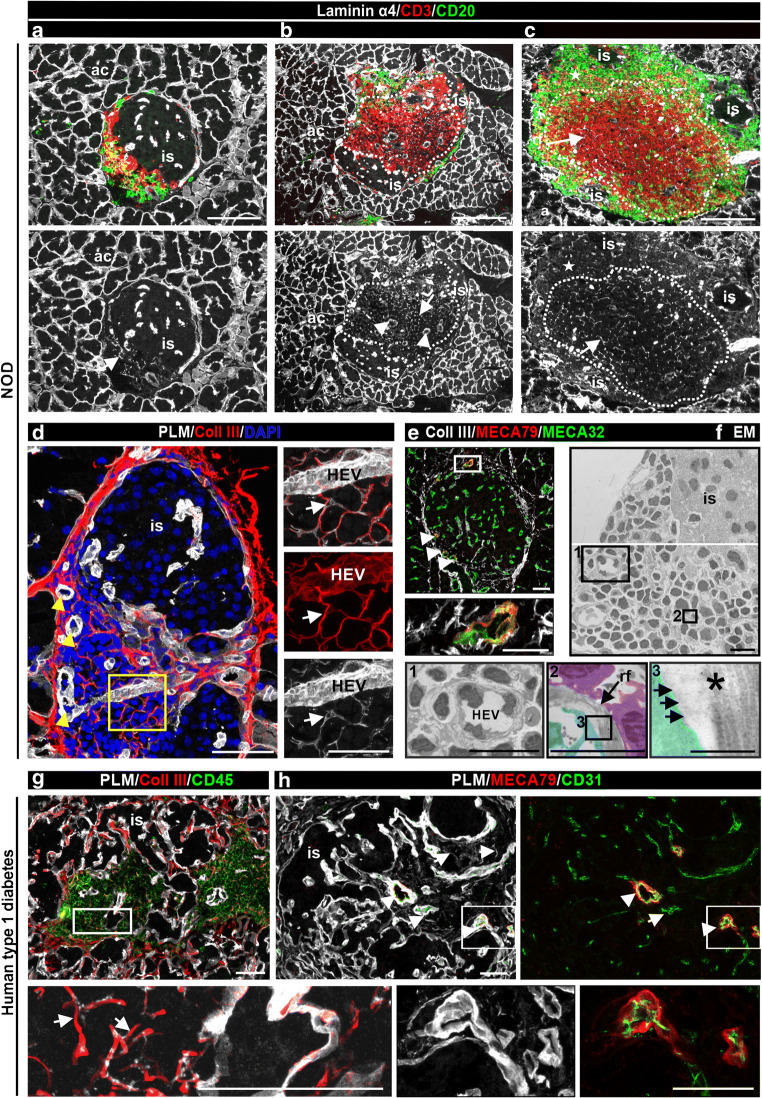
Fig. 5.
Comparison of pancreatic TLOs in NOD mouse and human type 1 diabetes samples. (a–c) Triple immunofluorescence staining of 14-week-old NOD mouse pancreases for CD3 to label T cells, CD20 to mark B cells and laminin α4 to mark the islet BMs, acinar BMs and the BM of RFs revealed B cells and T cells intermixed (a) and compartmentalised TLOs (b, c). Dashed lines mark T cell areas, stars mark B cell zones; arrowheads label HEVs and arrows mark RFs. ‘is’ indicates the healthy part of the islet. (d, g) Immunofluorescence staining for collagen III to label the core of RFs and PLM to mark BMs of inflamed islets of NOD mouse (d) and human type 1 diabetes samples (g). Arrowheads point to HEVs and arrows indicate the RFs (d). Boxed areas are shown at higher magnification. (e, h) MECA79 staining reveals HEVs in pancreas from NOD mouse (e, arrowhead) and human type 1 diabetes samples (h). All blood vessels are marked either with MECA32 (e) or CD31 (h) and PLM stains the BM of RFs and pancreatic islets. (f) Electron micrograph of an inflamed islet shows the ultrastructure of HEV (box 1) and of RFs (box 2). FRCs (pseudo-coloured in cyan) and lymphocytes (pseudo-coloured in violet) closely associate with RFs (box 2), which is shown at higher magnification in box 3; asterisk labels the inner collagen fibres and arrows mark the outer BM. The same micrograph with grid is shown in ESM Fig. 7. Boxed area is shown at higher magnification. Scale bars, 100 μm (a–c), 50 μm (d, e, g, h), 25 μm (d, e [areas shown at higher magnification]), 5 μm (f [boxes 1 and 2]) or 500 nm (f [box 3]). ac, acini; Coll, collagen; EM, electron micrograph; is, healthy islet; rf, RFs

