

Abstract
Little is known about the impact of sarcopenia, defined by reduced muscle mass and function, in pediatric chronic liver disease. We sought to compare psoas muscle surface area (PMSA) in children listed for liver transplantation to that of healthy controls and study the impact of sarcopenia on transplant-associated outcomes.
Methods:
Psoas muscle surface area was measured at the 4th lumbar vertebrae on CT or MRI and compared in pediatric liver transplant candidates versus healthy age and gender matched controls. The effect of PMSA (raw value and z-score) on survival was studied using multivariable proportional hazards model, while the impact of PMSA on other transplant-associated outcomes was assessed by multivariable linear or logistic regression. The correlation of PMSA with anthropometric values and markers of disease severity was studied using Spearman’s rank-order correlation.
Results:
Mean PMSA was significantly lower in liver transplant candidates (n=57, 699.4 mm2 ± 591.9 mm2) than controls (n=53, 1052.9 mm2 ± 960.7 mm2), p=0.02. For liver transplant candidates, there was an increased risk of death (either while on the wait list or following transplantation) with lower PMSA (HR 1.6 per 100 mm2, p=0.03, 95% CI 1.1-2.8), amounting to a 4.9 times higher risk of death for every 1 unit decrease in PMSA z-score (HR 4.9, p=0.05, 95% CI 1.2-34.5), adjusting for age and gender. In multivariable regression, PMSA did not correlate with post-transplant length of intubation or hospital length of stay, nor did it have a significant effect on peri-operative complications. PMSA also did not correlate with calculated (R=0.10, p=0.60) or appealed MELD/PELD scores (R= 0.10, p=0.69).
Conclusion:
Children who require liver transplantation have a significant reduction in muscle size compared to controls. Liver transplant candidates with lower PMSA experience significant increases in mortality. As such, sarcopenia may provide a novel indicator of disease severity in children with chronic liver disease.
Keywords: psoas muscle surface area, frailty, skeletal muscle, survival, malnutrition
Introduction
Sarcopenia, a reduced quantity and quality of skeletal muscle, is a common and significant co-morbidity in adults with chronic liver disease. Sarcopenia occurs in up to 70% of adults who require liver transplantation (LT), with profound adverse effects on patient outcomes (1). These include higher waitlist mortality, higher post-transplant mortality, and more frequent serious post-operative complications, including bleeding, sepsis, renal failure, bile leaks, and respiratory failure (2-9). Little is known about the impact of sarcopenia in pediatric chronic liver disease.
The physiologic differences between adult and pediatric patients are vast, particularly in regard to nutrition and body composition. Weight, height, and muscle mass vary greatly as children age. Thus, the understanding of sarcopenia in adults with chronic liver disease cannot be directly applied to the pediatric population. A small single center study suggested that children with end-stage liver disease (ESLD) have a smaller psoas muscle surface area (PMSA) than healthy controls (10). Another study showed that even in children who underwent LT, their estimated skeletal muscle mass remained low, with 41% of children having a skeletal muscle mass z-score ≤ −2 by dual-energy-X-ray absorptiometry (DEXA) measurement (11). Those patients with reduced muscle mass had increased lengths of hospitalization and ventilator dependence. While these studies are provocative in their novel assessment of sarcopenia in pediatric ESLD, the effects of pre-transplant muscle wasting on LT outcomes have not been defined in children.
Given the significant negative impact of muscle wasting in adult LT, we sought to evaluate muscle mass in children listed for LT and its impact on outcomes. We hypothesized that PMSA would be significantly lower in children listed for LT than healthy controls, with a negative impact on LT-associated outcomes.
Patients and Methods
We studied all children (age 0-18 years) listed for LT due to chronic/progressive, fibrotic or cholestatic liver disease at Children’s Hospital Colorado between March 2009 and August 2018 who had cross sectional abdominal imaging available within the 12 months prior to LT or listing (either computed tomography (CT) or magnetic resonance imaging (MRI)). We collected demographic, radiologic and transplant specific clinical data from the electronic medical record (EMR). Children were excluded from the study if cross-sectional imaging was not available, if they required liver-kidney transplant, if they required a liver transplant because of acute liver failure, hepatic malignancy, or an underlying metabolic disorder, or if they were listed for a re-transplant. Age and gender-matched controls with available CT abdominal imaging were identified from a radiology database at Children’s Hospital Colorado. The medical record was reviewed and controls were excluded if they had severe chronic lung disease, neuromuscular comorbidities, congenital heart disease, chronic kidney disease, chronic gastrointestinal disease, multiple congenital anomalies, <30-week gestation, body mass index (BMI) z-score ≤ −2, or were undergoing chemotherapy. Abdominal imaging in controls was obtained primarily for trauma (73%) with the remainder (27%) performed to assess for intra-abdominal pathology such as appendicitis or bowel obstruction. This study was approved by the Colorado Multiple Institutional Review Board.
PMSA Measurements:
For both cases and controls, the surface area of the right and left psoas muscle was measured at the 4th lumbar vertebrae (L4) on abdominal CT or MRI using Synapse 3D (Fujifilm Medical Systems USA). Both radiologic methodologies were used as CT and MRI have been shown to correlate well with each other in measuring cross-sectional muscle area (20). L4 was first identified on sagittal images, allowing for identification of the corresponding level on axial images subsequently used for the PMSA measurement (Figure 1). The left and right PMSA values were combined to calculate a total PMSA at L4. A second investigator performed PMSA measurements for a subset of subjects chosen at random (n=20). Inter-class correlation was used to estimate the inter-rater reliability coefficient.
Figure 1. Measurement of Psoas Muscle Surface Area.

(A) Midline sagittal CT abdominal image demonstrates the lumbar vertebrae, including L4; the corresponding level is then located on the axial image (B) allowing for PMSA measurement.
Adult studies of PMSA commonly measure muscle area at L3 or L4 (1,2,4,6). We measured PMSA at L4 because normative data have been previously derived for healthy children ages 1 – 20 years using this technique by the Morphomic Analysis Group at the University of Michigan School of Medicine (12). The Morphomic Analysis Group previously computed reference z-scores from quantile regression curves using the age and sex-adjusted mean of a healthy pediatric population who underwent abdominal CT at their institution (z = (value – 50th percentile)/((75th percentile – 25th percentile)/1.34)) (12). Using this normative data, we calculated PMSA z-scores in both LT candidates and controls. A PMSA z-score of ≤ −2 is two standard deviations from the mean of the normative data and can reasonably be consider a definition of sarcopenia. However, as there are not clearly validated definitions of sarcopenia in pediatric liver disease, we studied PMSA and PMSA z-score as continuous variables.
In subjects listed for LT, laboratory, anthropometric, and LT-associated outcome data were collected from the EMR. The pediatric end-stage liver disease score (PELD, used in patients <12-years-old) or model for end-stage liver disease score (MELD, used in patients ≥12-years-old) were calculated at the time of LT and, if relevant, exception MELD/PELD scores were collected from the EMR as well. Weight, height, weight-for-length (children <2-years), and body mass index (BMI, children ≥2-years) were collected from the EMR for both LT subjects and controls at the available time point closest to the time of abdominal imaging. For subjects in whom concurrent height was unavailable, height was extrapolated using prior height percentiles. LT candidates also had anthropometric measurements including mid-arm circumference (MAC) and triceps skin folds (TSF) obtained from the EMR. These measurements, performed by a trained dietician, are a part of our center’s clinical standard of care for children awaiting LT.
The following outcomes were collected from the EMR: death (on the wait list, following removal from the wait list, or after LT); length of intubation following LT; length of initial intensive care unit (ICU) stay; total hospital length of stay (LOS); peri-operative complications during the initial transplant hospitalization (return to the operating room, hepatic artery thrombosis (HAT), portal venous thrombosis (PVT), biliary complication, serious infection); and number of hospital readmissions in the first 6 months after LT.
The effect of PMSA (both raw values (mm2) and z-score values) on survival was studied using multivariable proportional hazards, incorporating age and gender in the statistical model. The impact of muscle mass on other transplant-associated outcomes (length of intubation, ICU LOS, total hospital LOS, peri-operative complications, and hospital readmissions) was assessed by multivariable linear or logistic regression. The correlation of PMSA with anthropometric values and MELD/PELD score was studied using Spearman’s rank-order correlation. A p-value of <0.05 was considered significant.
Results
Of the 114 patients listed for LT for indications other than acute liver failure during the study period, we studied 57 subjects (median age at time of abdominal imaging 1.3 years; IQR 0.6-9.8 years; 51% female) (Table 1). Thirty-eight LT candidates were excluded from the analysis because of lack of cross-sectional abdominal imaging within 12 months of LT or listing; 7 because of need for re-transplantation; 7 because their indication for LT was a liver tumor; 4 because their indication for LT was metabolic liver disease (without associated fibrosis or cirrhosis); and 1 due to need for liver-kidney transplantation (Figure 2). Subjects excluded due to lack of cross-sectional imaging were similar to included subjects in age and gender (mean age 5.4 years vs 5.8 years, p=0.80; 55% female vs 51% female, p=0.65). The proportion of subjects with biliary atresia, the leading indication for LT, was also similar between those included (49%) and excluded (32%) from the study (p=0.08).
Table 1.
Demographics, anthropometrics, and psoas muscle surface area (PMSA) measurements in liver transplant candidates and age/gender matched controls.
| Variable at time of pre- transplant imaging |
Listed for LT (n=57) |
Controls (n=53) |
Mean Difference |
p-value |
|---|---|---|---|---|
| Median age at abdominal imaging (years) | 1.3 (0.6-9.8) | 1.3 (0.7-11.1) | - | 0.80 |
| Female Gender | 51% | 47% | - | 0.70 |
| Weight z-score | −1.2 ± 1.2 | 0.1 ± 1.1 | - | <0.001 |
| Height z-score | −1.4 ± 1.2 | 0.1 ± 1.0 | - | <0.001 |
| Weight-for-length z-score* | −0.3 ± 0.9 | −0.1 ± 1.1 | - | 0.40 |
| BMI‡ (kg/m2) | 17.3 ± 2.4 | 18.3 ± 4.4 | - | 0.12 |
| BMI z-score | 0.0 ± 1.0 | 0.3 ± 1.2 | - | 0.37 |
| BSA (m2) | 0.7 ± 0.5 | 0.8 ± 0.6 | - | 0.26 |
| Mean PMSA at L4 (mm2) | ||||
| All ages | 699.4 ± 591.9 | 1052.9 ± 960.7 | 353.5 | 0.02 |
| ≤1 year of age (N=26) | 341.0 ± 55.4 | 419.1 ± 53.4 | 78.1 | <0.001 |
| >1 year of age (N=31) | 999.9 ± 668.4 | 1577.4 ± 1040.4 | 577.5 | 0.01 |
| z-score | −1.5 ± 1.0 | −0.3 ± 0.9 | 1.2 | <0.001 |
| Mean PMSA at L4 standardized to Height (mm2/cm) | 6.5 ± 2.6 | 8.7 ± 4.5 | - | 0.003 |
| Mean PMSA at L4 standardized to BSA (mm2/m2) | 959.4 ± 224.8 | 1164.1 ± 285.7 | - | <0.001 |
Data are given as mean ± standard deviation or median (IQR).
Weight-for-length used in subjects <2 years of age
BMI used in subjects ≥2 years of age
BMI (body mass index); BSA (body surface area); PMSA (psoas muscle surface area)
Figure 2. Consort Diagram of Liver Transplant Candidate Study Population.
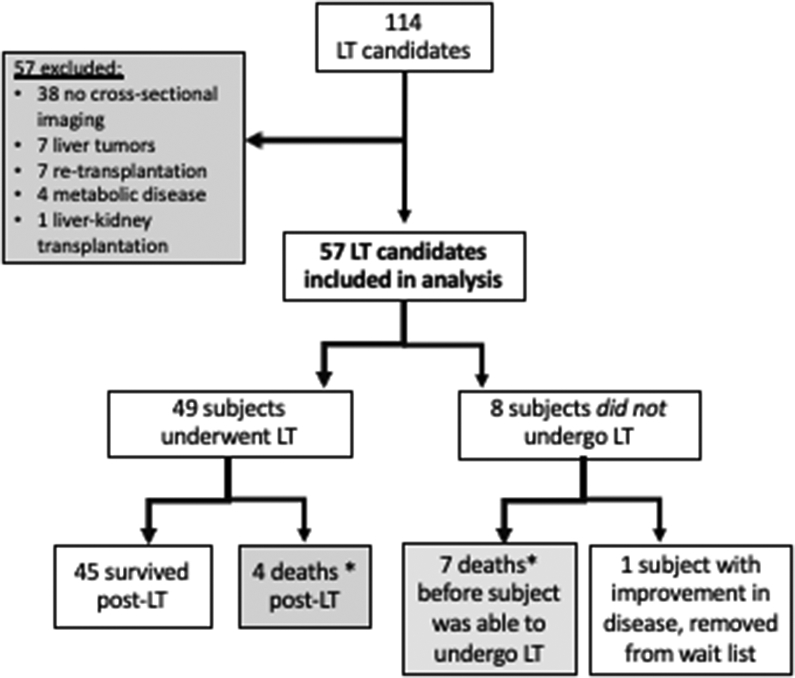
*Deaths included in survival analysis (n=11)
LT candidates were compared to 53 age (median age 1.3 years; IQR 0.7-11.1 years; p=0.80) and gender matched (47% female, p=0.70) healthy controls (Table 1). Concurrent height was only available in 54% of controls, thereby height was extrapolated from the last recorded height percentile for all others. Weight z-score (−1.2 ± 1.2 for LT candidates vs. 0.1 ± 1.1 for controls, p <0.001) and height z-score (−1.4 ± 1.2 for LT candidates vs. 0.1 ± 1.0 for controls, p<0.001) at the time of imaging were significantly different between groups. However, the BMI z-score (0.0 ± 1.0 for LT candidates vs. 0.3 ± 1.2 for controls, p=0.37) and weight-for-length z-score (−0.3 ± 0.9 for LT candidates vs. −0.1 ± 1.1 for controls, p=0.40) were similar.
The most common indication for liver transplant was biliary atresia (58%) (Table 2). Of the 57 subjects listed, 49 patients underwent LT. Seven patients died prior to transplant (4 died on the waitlist and 3 were removed from the waitlist because they were too sick to transplant) (Table 4). One additional patient was removed from the waitlist because of improvement in autoimmune hepatitis with ongoing medical management. The median age at transplant was 1.9 years with a range from 5 months to 18 years. Forty-one percent (20/49) of patients underwent LT before 1 year of age. Four patients died following transplantation (Table 4).
Table 2.
Indications for liver transplantation and mean age for each indication.
| Indication for LT | Total patients n=57 |
Mean age (years) at time of LT n=49‡ |
|---|---|---|
| Biliary atresia | 33 (58%) | 3.2 (4.4) |
| Auto-immune liver disease | 8 (14%) | 13.6 (3.6) |
| - Autoimmune hepatitis | 4 | |
| - Autoimmune hepatitis/primary sclerosing cholangitis overlap | 4 | |
| Alagille syndrome | 4 (7%) | 5.6 (5.2) |
| Cirrhosis, not otherwise specified | 4 (7%) | 3.6 (5.1) |
| Progressive familial intrahepatic cholestasis type II | 3 (5%) | 8.1 (7.2) |
| Other | 3 (5%) | 6.9 (5.7) |
| Cystic fibrosis-associated liver disease | 2 (4%) | 15.5 (0.6) |
Data are given as n (%) or mean (standard deviation).
Subjects who did not undergo transplant (n=8) were not included in the mean age at LT calculation.
Table 4.
Clinical Characteristics of Deceased Subjects
| Timing of Death |
Primary Diagnosis |
Calculated PELD or MELD* (Appealed) |
Complications of Liver Disease |
Cause of Death |
Age at Time of Death |
PMSA at L4 (mm2) |
PMSA z-score** |
|---|---|---|---|---|---|---|---|
| On the waitlist | Biliary Atresia | 18 (appealed PELD 40) | Malnutrition, ascites and SBP¥ | Sepsis, MSOF†, cerebral hemorrhage | 7 mo. | 331.9 | N/A |
| On the waitlist | Biliary Atresia | 17 (appealed PELD 27) | Malnutrition, variceal hemorrhage | Pulmonary and esophageal hemorrhage | 11 mo. | 253.4 | N/A |
| On the waitlist | Biliary Atresia | 14 (appealed PELD 24) | Malnutrition, ascites, esophageal varices | Death at home, cause unknow | 12 mo. | 347.5 | −0.0 |
| On the waitlist | Cirrhosis, unknown etiology | 10 (appealed PELD 27) | Variceal hemorrhage, hepatorenal syndrome | Sepsis, MSOF, pulmonary hemorrhage | 12 mo. | 338.9 | N/A |
| After removal from the waitlist | Biliary Atresia | 26 | Malnutrition, ascites, hepatorenal syndrome | Fungal sepsis, MSOF, cerebral edema and herniation | 8 mo. | 265.6 | N/A |
| After removal from the waitlist | Autoimmune Hepatitis | 31 | Malnutrition, ascites, esophageal varices | Pneumonia, sepsis, ACLF£ | 15 yr. | 1224.3 | −1.9 |
| After removal from the waitlist | Autoimmune Hepatitis | 15 (appealed MELD 25) | Malnutrition, ascites, variceal hemorrhage | Pneumonia, sepsis, MSOF | 17 yr. | 532.6 | −4.3 |
| 0 days after LT | Biliary Atresia | 24 (Status 1B) | Malnutrition, variceal hemorrhage | Severe coagulopathy, hemorrhagic shock | 11 mo. | 338.9 | N/A |
| 8 days after LT | Biliary Atresia | 9 (appealed PELD 30) | Malnutrition, recurrent cholangitis, ascites | Primary non-function, cerebral edema and herniation | 5 yr. | 360.0 | −1.2 |
| 17 days after LT | Alagille Syndrome | 7 (appealed PELD 27) | Malnutrition, pruritus | MSOF, sepsis, cerebral hemorrhage and herniation | 18 mo. | 367.0 | −1.9 |
| 46 days after LT | Langerhans Histiocytosis, Secondary Sclerosing Cholangitis | 17 (appealed PELD 25) | Malnutrition, ascites | Intracranial infection with cerebral edema and herniation | 2 yr. | 366.5 | −1.9 |
Calculated MELD or PELD score closest to the time of abdominal imaging (appealed MELD/PELD listed in parenthesis, if applicable)
SBP (spontaneous bacterial peritonitis)
MSOF (multisystem organ failure)
ACLF (acute on chronic liver failure)
PMSA z-score cannot be calculated for subjects <1 year of age
For LT candidates, PMSA was measured on CT in 51 subjects (89%) and on MRI in the remaining 6 (11%); all controls had CT imaging. Inter-rater reliability analysis of PMSA measurements performed by a second investigator in 20 subjects indicated almost perfect agreement with an inter-class correlation of 0.997 (95% CI 0.992-0.999). Mean PMSA was significantly lower in children listed for LT (699.4 mm2 ± 591.9 mm2) than in controls (1052.9 mm2 ± 960.7 mm2), p=0.02. Even after PMSA was standardized to height and body surface area, muscle area remained significantly lower in LT candidates than controls (Table 1). LT recipients had a median wait time of 2.6 months (IQR 1.3 - 5.1 months) from listing to transplant. At the time of transplant, mean calculated PELD score (patients <12-years, n=40) was 15.9 ± 9.3 and mean calculated MELD score (patients ≥12-years, n=9) was 14.7 ± 4.2. Of the 49 patients who underwent LT, 34 (69%) were allocated an organ based on exception points rather than their calculated score (mean appealed MELD/PELD was 26.9 ± 8.0). Abdominal imaging was obtained at a mean 3.1 months ± 3.0 months prior to LT.
Survival analysis using Cox proportional hazards, adjusted for age and gender, showed an increased risk of death (either while awaiting LT or following LT) with smaller PMSA (HR 1.6 per 100 mm2, p=0.03, 95% CI 1.1-2.8). In other words, holding age constant and controlling for gender, the risk of death increased by 60% per 100 mm2 decrease in PMSA. Of note, we observed a mean difference in PMSA between LT candidates and controls of 353.5 mm2. We also observed this degree of difference among LT candidates. For example, a comparison of two subjects with an age difference of 3 days, both LT candidates, had a PMSA difference of 391.3 mm2.
Following LT, patients spent a mean 1.2 days ± 3.0 days intubated, 7.5 days ± 8.8 days in the ICU and 16.2 days ± 11.6 days total in the hospital. In univariate analysis, lower PMSA correlated significantly with longer intubation (R= −0.40, p=0.004), ICU LOS (R= −0.52, p<0.001), and total hospital LOS (R= −0.42, p=0.003) following transplant. However, in multivariable analysis, once age was included in the analytic model, PMSA no longer correlated with length of intubation (partial R2<0.01, p=0.57), ICU LOS (partial R2<0.01, p=0.89), or total hospital LOS (partial R2<0.01, p=0.85). Furthermore, PMSA did not have a significant effect on the odds of return to the operating room (OR 1.0 per 100 mm2, p=0.86, 95%CI 0.6-1.3), HAT (OR 1.0 per 100 mm2, p=0.87, 95%CI 0.5-1.3), PVT (OR 0.7 per 100 mm2, p=0.52, 95% CI 0.2-1.6), biliary complications (OR 0.8 per 100 mm2, p=0.74, 95% CI 0.2-2.3), or hospital readmissions in the 6 months following LT (OR 1.1 per 100 mm2, p=0.07, 95% CI 1.0-1.3). The odds of developing serious infection following LT increased with higher PMSA (OR 1.2 per 100 mm2, p=0.002, 95% CI 0.8-1.7).
Using normative data from the Morphomic Analysis Group at the University of Michigan Medical School, we calculated z-score values for PMSA in both LT candidates and controls (Figure 3). This was only possible in subjects >1-year-old at the time of imaging as the normative data only exists for children 1-20 years of age. LT candidates had a mean PMSA z-score of −1.5 ± 1.0 compared to −0.3 ± 0.9 for controls (p<0.001). Seven of the 31 LT candidates (22.6%) >1 year of age had a PMSA z-score ≤ −2 as compared to only 1 of 29 controls (3.4%, p=0.05). Cox survival analysis using PMSA z-score as the predictor demonstrated a 4.9 times higher risk of death for every 1 standard deviation decrease in PMSA z-score (HR 4.9, p=0.05, 95% CI 1.2-34.5). Figure 4 demonstrates the effect of PMSA z-score on survival in LT candidates >1 year of age, at three representative sample ages.
Figure 3. PMSA Z-score Scatterplot.

This scatterplot provides visual representation of the PMSA z-score distribution for all subjects >1 year of age who either survived (♦) or died (on the waitlist, after removal from the waitlist, or following liver transplantation) (●). Only subjects that were ≥1 year of age at the time of imaging are included, as z-score calculations are not available for subjects <1 year of age. The majority of subjects who died had a PMSA z-score of ≤ −2.
Figure 4. Effect of PMSA z-score on Survival for Liver Transplant Candidates.

This figure demonstrates the effect of PMSA z-score on survival in LT candidates >1 year of age, at three representative ages: (A) sample age 3.1 years, (B) median age 8.4 years, and (C) sample age 14.6 years. Survival was poorer for lower PMSA z-score (e.g. z-score −2 vs −1), p=0.05. The effect of PMSA z-score on survival was more pronounced in the younger age groups (A and B) than in the older age group (C).
As seen with the raw PMSA value, PMSA z-score did not correlate with ICU LOS (R= −0.16, p=0.43) or total hospital LOS (R= −0.19, p=0.34) and did not predict peri-operative complications (return to the operating room (OR 3.2, p=0.18, 95% CI 0.6-3.4), HAT (OR 0.7, p=0.64, 95% CI 0.1-2.8), biliary complications (OR 1.3, p=0.82, 95% CI 0.1-8.7), PVT (OR 1.2 p=0.82, 95% CI 0.1-9.2)), or hospital readmissions (OR 1.2, p=0.39, 95% CI 0.7-2.7)). PMSA z-score also did not correlate with calculated MELD/PELD score at the time of LT (R= 0.10, p=0.60) or appealed MELD/PELD score (R= 0.10, p=0.69) (Figure 5). PMSA z-score correlated significantly with weight z-score (R= 0.61, p<0.001), height z-score (R= 0.58, p<0.001), BMI z-score (R=0.43, p=0.03), and MAC z-score (R= 0.42, p=0.007), but did not correlate with weight-for-length z-score or TSF z-score (Table 3).
Figure 5. Correlation Between PMSA z-score and Calculated MELD/PELD Score.

There was poor correlation between the PMSA z-score and the calculated MELD or PELD score at the time of liver transplantation, regardless of the underlying etiology of liver disease (i.e. biliary atresia or other primary liver disease).
Table 3.
Correlation of PMSA z-score with markers of disease severity and anthropometrics.
| Correlation with PMSA z-score |
Spearman R |
p-value |
|---|---|---|
| Calculated MELD/PELD | 0.10 | 0.60 |
| Adjusted MELD/PELD | 0.10 | 0.69 |
| Weight z-score | 0.61 | < 0.001 |
| Height z-score | 0.58 | < 0.001 |
| BMI z-score | 0.43 | 0.03 |
| Weight-for-length z-score | 0.20 | 0.80 |
| MAC z-score | 0.42 | 0.007 |
| TSF z-score | 0.02 | 0.90 |
MELD (model for end-stage liver disease); PELD (pediatric end-stage liver disease); BMI (body mass index); MAC (mid-arm circumference); TSF (triceps skin folds)
Discussion
A growing body of evidence highlights the prevalence of sarcopenia in adults with chronic liver disease and the adverse impact on outcomes for those requiring liver transplantation. Given the vast physiologic differences between children and adults, the aforementioned literature cannot be applied to children. This study systematically identifies deficits in PMSA, indicating the presence of significant sarcopenia in pediatric LT candidates compared to healthy controls. Furthermore, the presence of sarcopenia (as reflected by lower PMSA) predicts higher mortality for children who require liver transplantation (while on the waitlist or following LT).
Significant differences between the height and weight of LT candidates and controls emphasize that malnutrition and stunting commonly plague children with chronic liver disease. In healthy children, BMI and weight-for-length are routinely used indicators of adequate nutrition and growth. Similarities in BMI and weight-for-length between LT candidates and controls, however, serve as critical reminders that these parameters often overrepresent the nutritional adequacy of children with liver disease. The validity of these standard measurements is confounded by organomegaly, fluctuating ascites, and stunting of height progression, thereby not adequately reflecting malnutrition (13). Measurement of PMSA allows for a novel assessment of nutritional status, unaffected by organomegaly and fluid overload. Practically, however, the correlation between PMSA z-score and MAC z-score supports the current use of MAC anthropometrics in clinical practice, as a rapid and effective method to assess muscle bulk in the office setting.
PMSA had a significant detrimental effect on mortality for pediatric LT candidates. The risk of death (while on the waitlist or following LT) was 4.9 times higher for every 1 standard deviation decrease in PMSA z-score; for example, the risk of death would increase by 390% for a PMSA z-score of −2 as compared to a z-score of −1. The limitation of this z-score based analysis, however, is that we are only able to study LT candidates >1 year of age, thereby excluding one-third of the studied LT candidates (the youngest and potentially most vulnerable sub-group of the at-risk population) and decreasing the sample size (likely contributing to the wide confidence interval in this case). Given the importance of capturing the effect of muscle size on survival in this particularly vulnerable sub-population, we also performed age and gender adjusted survival analysis of the entire LT cohort using raw PMSA values, as opposed to the z-score. When we examined the effect of the raw PMSA value on overall mortality in LT candidates, we found that the risk of death was 1.6 times as likely for every 100 mm2 decrease in PMSA.
The effect of sarcopenia, as measured by PMSA, on mortality in pediatric LT candidates has not been studied previously. With 1 in 10 infants and 1 in 20 older children dying on the liver transplant waitlist each year, there is an urgent need to further stratify children with ESLD who are at highest risk of death (14). MELD/PELD scores were designed to predict the risk of death without transplantation and thereby allocate organs to the sickest potential recipients first. In pediatrics, however, these scores often inadequately capture disease severity. Sixty-nine percent of our pediatric LT candidates received an organ based on MELD/PELD exception points rather than their calculated score, similar to national data (15). Interestingly, PMSA z-score did not correlate with either the calculated MELD/PELD score at the time of LT (R= 0.10, p=0.60) or the appealed MELD/PELD scores (R= 0.10, p=0.69). The pediatric transplant community needs a more robust tool that will adequately reflect the severity of liver disease, and thereby potential risk of death, in children requiring liver transplantation. The data provided in this study demonstrate that sarcopenia may provide additional context for defining disease severity and risk of death in children with chronic liver disease.
While CT and MRI measurements of PMSA have been used extensively in adults who require LT, this is a novel technique to assess outcomes in children with chronic liver disease. This study, however, has several limitations. Retrospective data collection resulted in non-uniform timing of imaging prior to LT used to assess PMSA. Furthermore, serial imaging was not available to determine if muscle size changed over time and with worsening disease severity as individual patients progressed towards LT. The differences in PMSA between LT-candidates and controls ≤1 year of age was substantially smaller than in those >1 year of age (78.1 mm2 vs 577.5 mm2), although both differences were statistically significant. In this study, we were unable to determine if this reflects less sarcopenia in younger patients due to shorter length of illness before transplant versus an inherent reflection of their disease process. The heterogenous underlying disease conditions in the LT candidates may also impact the pathophysiology of muscle wasting, however we only included children with chronic/progressive cholestatic and/or fibrotic liver disease. We excluded cases in which there was not underlying structural chronic liver disease, such as hepatic malignancy and metabolic disorders (e.g. ornithine transcarbamylase deficiency or glycogen storage disease), as we suspect these diseases may affect muscle physiology differently. Factors beyond the underlying liver disease may also contribute to muscle wasting (e.g. pulmonary status in a child with cystic fibrosis). In addition, the very small muscle size in the youngest children had the potential to amplify any variations in measurements. While PMSA did not predict the occurrence of post-transplant complications (e.g. return to the operating room and hepatic artery thrombosis), this may have been due to the small number of each of these individual events. While the increased risk of infection with increasing PMSA size was unexpected (OR 1.2 per 100mm2, 95% CI 0.8-1.7), this result is statistically insignificant as the 95% confidence interval crosses one and should be interpreted with caution (21). Finally, given its retrospective nature, this study does not include a measure of muscle function, another important component of sarcopenia (16).
This study demonstrates significant sarcopenia in children with chronic liver disease, with an alarming negative impact on survival. Little is known about the mechanisms of muscle loss (or perhaps lack of muscle gain) in this specific population. In adults with cirrhosis, myostatin, a myokine which inhibits protein synthesis and activates proteolysis, seems to play a key role (17,18). Elevated ammonia upregulates myostatin expression in the muscle of adults with cirrhosis, and serum myostatin levels are elevated in these patients; furthermore, myostatin levels negatively correlate with muscle mass (19). Other mechanisms under investigation include the role of hormonal factors (like testosterone and growth hormone) and chronic inflammation, although this research is primarily in adults (17-19). Multiple mechanisms likely overlap with resultant muscle loss in children with chronic liver disease. An improved understanding of the mechanisms driving sarcopenia in pediatric liver disease will be necessary to develop effective screening and intervention strategies for this vulnerable population.
In conclusion, children with chronic liver disease have significant reduction in muscle size. We have shown the negative impact on survival in LT candidates with lower PMSA. In the future, robust and well-designed prospective studies will be necessary to further understand the impact of sarcopenia on outcomes in pediatric chronic liver disease and the mechanisms by which muscle wasting occurs. This will require an ascertainment of changes in developmental status and body composition throughout childhood, which may help to improve our understanding of both nutritional and functional muscle status in pediatric chronic liver disease.
Acknowledgments
Funding Source: NIH T32 DK067009 Institutional Training Grant in Pediatric Gastroenterology, University of Colorado
Abbreviations:
- BMI
body mass index
- CT
computed tomography
- DEXA
dual-energy-X-ray absorptiometry
- EMR
electronic medical record
- ESLD
end-stage liver disease
- HAT
hepatic artery thrombosis
- ICU
intensive care unit
- LOS
length of stay
- LT
liver transplantation
- MAC
mid-arm circumference
- MELD
model for end-stage liver disease
- MRI
magnetic resonance imaging
- PELD
pediatric end-stage liver disease
- PMSA
psoas muscle surface area
- PVT
portal vein thrombosis
- TSF
triceps skin folds
Footnotes
Conflict of Interest: The authors have indicated they have no potential conflicts of interest to disclose.
References
- 1.van Vugt JL, Levolger S, de Bruin RW, van Rosmalen J, Metselaar HJ, IJzermans JN. Systematic Review and Meta-Analysis of the Impact of Computed Tomography-Assessed Skeletal Muscle Mass on Outcome in Patients Awaiting or Undergoing Liver Transplantation. Am J Transplantation 2016;16:2277–2292. [DOI] [PubMed] [Google Scholar]
- 2.Tandon P, Ney M, Irwin I, Ma MM, Gramlich L, Bain VG, et al. Severe muscle depletion in patients on the liver transplant wait list: its prevalence and independent prognostic value. Liver Transpl 2012;18:1209–1216. [DOI] [PubMed] [Google Scholar]
- 3.Carey EJ, Lai JC, Sonnenday C, Tapper EB, Tandon P, Duarte-Rojo A, et al. A North American Expert Opinion Statement on Sarcopenia in Liver Transplantation. Hepatology 2019;70(5):1816–29. [DOI] [PMC free article] [PubMed] [Google Scholar]
- 4.Englesbe MJ, Patel SP, He K, Lynch RJ, Schaubel DE, Harbaugh C, et al. Sarcopenia and mortality after liver transplantation. J Am Coll Surg 2010;211 (2):271–278. [DOI] [PMC free article] [PubMed] [Google Scholar]
- 5.Lee CS, Cron DC, Terjimanian MN, Canvassed LD, Mazurek AA, Vonfoaerster E, et al. Dorsal muscle group area and surgical outcomes in liver transplantation. Clin Transplant 2014;28 (10):1092–1098. [DOI] [PMC free article] [PubMed] [Google Scholar]
- 6.Krell RW, Kaul DR, Martin AR, Englesbe MJ, Sonnenday CJ, Cai S, Malani PN. Association between sarcopenia and the risk of serious infection among adults undergoing liver transplantation. Liver Transpl 2013;19:1396–1402. [DOI] [PMC free article] [PubMed] [Google Scholar]
- 7.Kaido T, Ogawa K, Fujimoto Y, Ogura Y, Hata K, Ito K, et al. Impact of sarcopenia on survival in patients undergoing living donor liver transplantation. Am J Transplant 2013;13:1549–1556. [DOI] [PubMed] [Google Scholar]
- 8.Durand F, Buyse S, Francoz C, Laouénan C, Bruno O, Belghiti J, et al. Prognostic value of muscle atrophy in cirrhosis using psoas muscle thickness on computed tomography. J Hepatol 2014;60:1151–1157. [DOI] [PubMed] [Google Scholar]
- 9.Van Vugt JL, Alferink LJ, Buettner S, Gaspersz MP, Bot D, Murad SD, et al. A model including sarcopenia surpasses the MELD score in predicting waiting list mortality in cirrhotic liver transplant candidates: A competing risk analysis in a national cohort. J Hepatol 2018;68:707–714. [DOI] [PubMed] [Google Scholar]
- 10.Lurz E, Patel H, Frimpong RG, Ricciuto A, Kehar M, Wales PW, et al. Sarcopenia in Children with End-Stage Liver Disease. J Pediatr Gastr Nutr 2018;66:222–226. [DOI] [PubMed] [Google Scholar]
- 11.Mager DR, Hager A, Ooi PH, Siminoski K, Gilmour SM, Yap JY. Persistence of sarcopenia after pediatric liver transplantation is associated with poorer growth and recurrent hospital admissions. J Parenter Enter Nutr 2018;00:1–10. [DOI] [PubMed] [Google Scholar]
- 12.Harbaugh CM, Zhang P, Henderson B, Derstine BA, Holcombe SA, Wang SC, et al. Personalized medicine: Enhancing our understanding of pediatric growth with analytic morphomics. J Pediatr Surg 2017; 52:837–842. [DOI] [PubMed] [Google Scholar]
- 13.Hurtado-Lopez EF, Vasquez-Garibay EM, Trujillo X, Larrosa-Haro A. Body composition predicts growth in infants and toddlers with chronic liver disease. J Pediatr Gastr Nutr 2017;65:117–9. [DOI] [PubMed] [Google Scholar]
- 14.Perito ER, Roll G, Dodge JL, Rhee S, Roberts JP. Split Liver Transplantation and Pediatric Waitlist Mortality in the United States: Potential for Improvement. Transplantation 2019;103:552–557. [DOI] [PMC free article] [PubMed] [Google Scholar]
- 15.Salvalaggio PR, Neighbors K, Kelly S, Emerick KM, Iyer K, Superina RA, et al. Regional Variation and Use of Exception Letters for Cadaveric Liver Allocation in Children with Chronic Liver Disease. Am J Transplant 2005;5(8):1868–74. [DOI] [PubMed] [Google Scholar]
- 16.Lurz E, Quammie C, Englesbe M, Alonso EM, Lin HC, Hsu EK, et al. Frailty in Children with Liver Disease: A Prospective Multicenter Study. J Pediatr 2018;194:109–115. [DOI] [PubMed] [Google Scholar]
- 17.Bhanji RA, Montano-Loza AJ, Watt KD. Sarcopenia in cirrhosis: Looking beyond the skeletal muscle loss to see the systemic disease. Hepatology 2019;70:2193–2203. [DOI] [PubMed] [Google Scholar]
- 18.Dasarathy S and Merli M. Sarcopenia from mechanism to diagnosis and treatment in liver disease. J Hepatol 2016; 65(6): 1232–1244. [DOI] [PMC free article] [PubMed] [Google Scholar]
- 19.Nishikawa H, Enomoto H, Ishii A, Iwata Y, Miyamoto Y, Ishii N, et al. Elevated serum myostatin level is associated with worse survival in patients with liver cirrhosis. J Cachexia Sarcopenia Muscle 2017;8(6):915–925. [DOI] [PMC free article] [PubMed] [Google Scholar]
- 20.Tandon P, Mourtzakis M, Low G, Zenith L, Ney M, Carbonneau M, et al. Comparing the Variability Between Measurements for Sarcopenia Using Magnetic Resonance Imaging and Computed Tomography Imaging. Am J Transplant 2016;16:2766–2767. [DOI] [PubMed] [Google Scholar]
- 21.Greenland S, Senn SJ, Rothman KJ, Carlin JB, Poole C, et al. Statistical Tests, P values, Confidence Intervals, and Power: A Guide to Misinterpretations. Eur J Epidemiol 2016;31:337–350. [DOI] [PMC free article] [PubMed] [Google Scholar]