

Abstract
Scanning ion conductance microscopy (SICM) has emerged as a versatile tool for studies of interfaces in biology and materials science with notable utility in biophysical and electrochemical measurements. The heart of the SICM is a nanometer-scale electrolyte filled glass pipette that serves as a scanning probe. In the initial conception, manipulations of ion currents through the tip of the pipette and appropriate positioning hardware provided a route to recording micro- and nanoscopic mapping of the topography of surfaces. Subsequent advances in instrumentation, probe design, and methods significantly increased opportunities for SICM beyond recording topography. Hybridization of SICM with coincident characterization techniques such as optical microscopy and faradaic electrodes have brought SICM to the forefront as a tool for nanoscale chemical measurement for a wide range of applications. Modern approaches to SICM realize an important tool in analytical, bioanalytical, biophysical, and materials measurements, where significant opportunities remain for further exploration. In this review, we chronicle the development of SICM from the perspective of both the development of instrumentation and methods and the breadth of measurements performed.
Graphical Abstract

1. INTRODUCTION
Scanning ion conductance microscopy (SICM) was introduced in 1989 by Paul Hansma and coworkers as a microscopy technique for high-resolution and noncontact imaging of samples.1 As a scanning probe microscopy (SPM) technique, SICM (in the original configuration) utilizes ion current that flows between an electrode inside a glass pipette and a second electrode that resides in the bulk solution to create a surface-sensitive feedback signal. The topography of a surface can be recorded by laterally scanning the pipette over an interface with changes in ion current used to report the position of the pipette tip relative to the surface. A steady evolution of improvements, both in instrumentation and in understanding fundamental principles, by an interdisciplinary research community has developed SICM into a versatile tool for studies in biophysical, materials, interfacial and electrochemical science. Over the past 30 years, more than 300 peer-reviewed publications and multiple reviews2–13 have chronicled the development of SICM.
In this review, we first present the fundamentals of SICM, including instrumentation and mathematical models of SICM. The evolution of SICM is discussed with a focus on the development of different scan modes, advances in instrumentation, optimization of algorithms, and hybrid SICM techniques. Finally, we emphasize the extensive applications of SICM in chemistry and biological science.
2. PRINCIPLES OF SICM
2.1. Instrumentation
A typical SICM instrument consists of several components (Figure 1a): a nanopipette, which serves as the scanning probe, piezoelectric actuators, that control fine movement in the X, Y, and Z directions, DC/stepper motor for coarse positioning, a current amplifier for recording ion current, and additional electronics that include a data acquisition system and scan controller. SICM scanning can be achieved by moving the probe, the sample stage, or both, depending on the chosen method of motion control. Ion current (I), usually generated by applying a potential bias between a pipette electrode (PE) back-inserted into the electrolyte-filled pipette and a reference electrode (RE) in the bath electrolyte, is highly sensitive to the distance change when the separation between the pipette and sample is similar to the radius of the pipette. This distance-dependent ion current signal is magnified by the current amplifier, and the amplified current is used as a feedback signal to control the tip–sample distances to enable noncontact positional control of the tip of the nanopipette relative to an interface. When the pipette is far from the substrate, a steady-state ion current (I∞) is recorded between the pipette and reference electrodes. As the pipette is lowered toward the sample surface, the ion current begins to decrease because the proximity of the substrate impedes the flow of ions. The relationship between ion current and tip–sample distance (i.e., an approach curve) can be described by mathematical equations derived from geometric models that account for the resistive elements of the system. The first model, developed by Nitz et al.14 in 1998, is still widely used today due to ease of implementation and reasonable agreement with experimental data. Nitz proposed the total resistance between the pipette electrode and reference electrode primarily consists of two components: the resistance of the pipette (Rp), which depends on the geometry of the pipette and the conductivity of the electrolyte solution with which it is filled, and the access resistance (Rz), which is related to the conductivity of the electrolyte solution and the gap formed between the tip and interface. Rp can be described as follows:
| (1) |
where κ is the conductivity of the electrolyte, h is the pipette height to base, ri is the internal radius of the pipette tip, re is the internal radius of the pipette base, and α is the inner half cone angle (see Section 2.1.1). The quantity re/h can be approximated by tan α, considering that the length of the conical part of the pipette is much larger than the tip (ri).15
Figure 1.

(a) Schematic of a typical SICM instrument setup. An electrolyte-filled nanopipette is used as the probe and mounted on a piezoelectric actuator and a DC/stepper motor. A potential is applied between the pipette electrode (PE) and the reference electrode (RE) (in bath electrolyte) to generate an ion current. The current is magnified by the current amplifier and used as feedback to control the movement of the pipette. (b) A typical SICM approach curve plotted as the normalized ion current (I/I∞) versus tip–sample distance normalized to the tip radius (d/ri). The ion current is stable when the tip is far away from sample surface and drops exponentially as the pipette tip–sample distance approaches a distance nominally equivalent to the inner tip radius.
The access resistance, Rz, was estimated by describing the gap formed as three resistors, the value of which was calculated from a set of assumed electric fields. The final expression of Rz was given by
| (2) |
where ro is the outer radius of the pipette tip and d is the tip–sample distance. The distance-dependent ion current, I(d), can thus be calculated from applied potential (U), Rp and Rz:
| (3) |
With eq 3, one can approximate an approach curve if the pipette geometry is known and vice versa. Figure 1b shows a typical SICM approach curve, plotted as the normalized ion current (I/I∞) versus the distance between the nanopipette tip and substrate (expressed here in values relative to the tip radius d/ri). Under an applied potential and while the pipette is positioned at distances far from the surface, a steady-state ion current that depends solely on the pipette resistance (Rp) is achieved. When the tip moves closer to the surface, the value of the access resistance (Rz) rapidly increases and eventually dominates the current response. The relationship between the magnitudes of these two resistances, Rp and Rz, is critical to imaging, and provides limits on what resolution can be physically realized. Further, the nonlinear relationship between Rp and Rz provides a feedback signal that is highly sensitive to subtle changes in position for distances that are on the order of the pipette radius, ri. As the pipette moves closer to the surface, the current changes rapidly as the gap between the tip and surface shrinks, making the ion current sensitive to small changes in position.
With a distance-dependent ion current, the topography of a sample surface can be acquired by setting up an electronic feedback loop that maintains a constant percentage of ion current drop (i.e., a threshold) and laterally scans the pipette across a sample surface. The selection of the ion current threshold used in experiments balances two imaging considerations: the desire for measuring spatial variations (topography) of a sample and the need to keep the tip far enough from the sample to prevent accidental tip/sample damage. A topographical map is collected and processed by data acquisition software through recording the pipette movement in the Z-direction required to maintain a constant tip–sample distance during scanning. Additions to the SICM setup, such as an inverted optical microscope and fluorescence detection for visualizing biological samples,16,17 may also be incorporated depending on the required experimental application.16–19 Many research groups choose to design home-built SICM instruments to allow for a greater degree of customization compared to commercial SICM models.20–23
2.1.1. Probes.
Nanopipettes for SICM imaging are typically made from either borosilicate or quartz glass capillaries. Pipettes are prepared by pulling glass capillaries with a pipette puller that applies heat and mechanical pulling force to generate two nearly identical sister pipettes. The above-described method for fabricating pipettes can be used to prepare both single and multibarrel pipette probes from single or multibarrel capillaries, respectively.24 Dual barrel pipettes, for example, allow for more complex measurements and have been used in several hybrid SICM techniques (see Section 3). Though pipette fabrication is relatively fast and straightforward, considerable time and practice is required to develop a pulling program that reproducibly generates pipettes of the appropriate geometry. Typical pipette geometry considerations include the inner pipette tip opening radius (ri), outer pipette tip opening radius (ro), and inner half cone angle (α) (Figure 2a).
Figure 2.

(a) Schematic of pertinent nanopipette geometric parameters which are the internal radius of the pipette tip, ri, outer radius of the pipette tip, ro, and inner half cone angle, α. (b) Electron micrograph of the side-on perspective of a nanopipette.
Pipette dimensions can be estimated by optical and electron micrographs.15,25,26 For instance, optical and electron microscopies (Figure 2b) can be used to measure the length of the pipette taper and the inner and outer radius of the tip opening. As the nanopipette tip diameter approaches sub-20 nm, measuring the pipette geometry and dimensions by scanning electron microscopy (SEM) and transmission electron microscopy (TEM) becomes more challenging.27 SEM characterization often requires application of a conductive metal coating to reduce charging of the glass nanopipette, but the coating can change the apparent pipette dimensions.27,28 Furthermore, nanopipette measurements by TEM can also be distorted because TEM requires a thin (<200 nm) sample.27 In addition, without special care, the energy density deposited by electron microscopes can deform the tips of pipettes, complicating characterization.
Electrochemical characterization to determine the geometric parameters of pipettes is straightforward, especially for nanopipettes with small diameters that are hard to characterize by microscopy approaches.28 An electrolyte-filled pipette containing a back-inserted electrode can be placed in a bath electrolyte containing the same composition (a similar procedure required for SICM measurements, thus the additional effort required is minimal). A potential applied between the electrode placed in the bath solution and the electrode inside the pipette can then be used to collect current–voltage (IV) curves, from which the total pipette resistance can be extracted. From eq 1 or similar equations,27–30 the tip radius can be estimated from the experimentally measured resistance and a reasonable cone angle estimation. Alternatively, if the tip radius and cone angle are known, the pipette resistance can be estimated.
2.1.2. Electrodes.
Chloridized Ag wires often serve as the pipette and reference electrode for SICM because their reference potentials are stable over prolonged experimental time scales.31 Though some reports have claimed artifacts32 stemming from Ag/AgCl contamination originating from the pipette electrode. For experiments where Ag/AgCl is not appropriate, electrodes, such as platinum33,34 or palladium–hydrogen,35 can be employed.
2.1.3. Electrolytes and Solvents.
In SICM experiments, like any electrochemical measurements, the electrolyte must be judiciously selected. Electrolyte conductivity is a key consideration for SICM because the ionic species in solution generate the ionic current and act to minimize the solution resistance. Selection of ionic species should be considered because the transference number, defined as the fraction of current carried by each ion, and mobility will influence ionic flux.36 For studies related to fundamentals and theories of SICM, potassium chloride is a commonly used ionic salt because the transference number of K+ and Cl− are ~0.5, which results in ca. equal ionic fluxes.36,37 The concentration of ions also dictates the thickness of the electrical double layer on the pipette wall,38 which can change the current–voltage response of the electrolyte-filled pipette. Physiological buffers and cell culture media (e.g., phosphate buffered saline, Eagle’s Medium, etc.) are also widely used for SICM investigations of biological samples.26,39 Under such conditions with ionic strength equal to ca. 150 mM NaCl, reasonably sized nanopipettes can generate ion currents up to several nanoamperes, which provides sufficient signal-to-noise ratio (S/N) for stable SICM feedback and imaging. For advanced biological measurements with SICM, attention should be paid to the presence of species that can foul or clog the nanopipette tip, although suitable signal for imaging can typically be generated even in complex media.
The vast majority of SICM experiments are carried out in aqueous solutions when the electrolyte concentration in the pipette and bath solution are equal and symmetric. Though, SICM has been conducted in asymmetric solution conditions when the concentration of electrolyte in the pipette and bath solution are unequal,23,40–42 in biphasic solution conditions,43,44 and nonaqueous solutions, including ionic liquids.45–47
2.2. Finite Element Modeling (FEM) of SICM
As more complex applications of SICM developed, precise models for interpreting SICM signals and fitting approach curves became necessary and have greatly aided image analysis and improvements in instrument performance. While simulations of electrochemical systems have long been prevalent,48–52 commercial software packages have made solutions tractable for more complex models where analytical solutions cannot be easily reached. In particular, attempts to improve basic analytical models have been performed with FEM, which can include more realistic geometric factors and physiochemical realities, such as surface charge and the electric double layer.15,53–55 In a typical FEM study, the pipette geometry and material, determined from experimental characterization as described above, is defined. Volumes of conductive fluid inside and outside of the pipette are defined by setting boundary conditions with specific materials properties such as charge density, solution viscosity, dielectric constants, etc. In addition, the charge number, ion mobility and concentration of the ion species in the bath are described.8 In the most straightforward models, partial differential equations based on the Nernst–Planck Equation (describing the flux of ions and molecules) and Poisson’s equation (describing the distribution of electrical potential) are evaluated by subdividing the volume of the model into smaller and simpler finite elements via space discretization. The solution is approximated by minimizing the associated error function between the finite elements, and finally generates a model which can predict currents, ion distributions, etc. More advanced parametrization can include other variables, such as pressure, as well.56,57
Earliest FEM models of SICM were first developed to explain the behavior of ion current under different tip–sample distances.58,59 Later, Edwards et al. applied FEM to investigate the current response of SICM as a function of pipette geometry and demonstrated that a larger pipette inner half cone angle and a larger ratio of glass to aperture radii make SICM more sensitive to tip–sample separation.53 Additionally, the current response has also been studied for a pipette scanned toward different surface features. FEM models that followed improved results with more accurate and complex descriptions of pipette geometry and properties of pipette wall (e.g., surface charge) and sample. In addition to predicting approach curves, FEM models have also been used to evaluate the lateral resolution of SICM,60 characterize the properties of nanopipettes,28 and calculate the influence of sample properties, such as ion permeability,61 slope of surface,62 surface charge,63–66 and electrocatalytic activity35 on the current response. Such models have been developed to explain possible distortion or artifacts in SICM images and can also be used to aid in interpretation of surface properties in diverse applications of SICM (see Section 4).
With FEM analysis, Rheinlaender et al. developed the most detailed approach curve equation to date.15 A general model for the analysis is shown in Figure 3a, b, and currents are evaluated by integrating the ion current density through the pipette limiting diameters (Figure 3c). The total resistance of the ion current through the nanopipette is still divided into a pipette resistance, Rp described by eq 1, and an access resistance, Rz.
Figure 3.
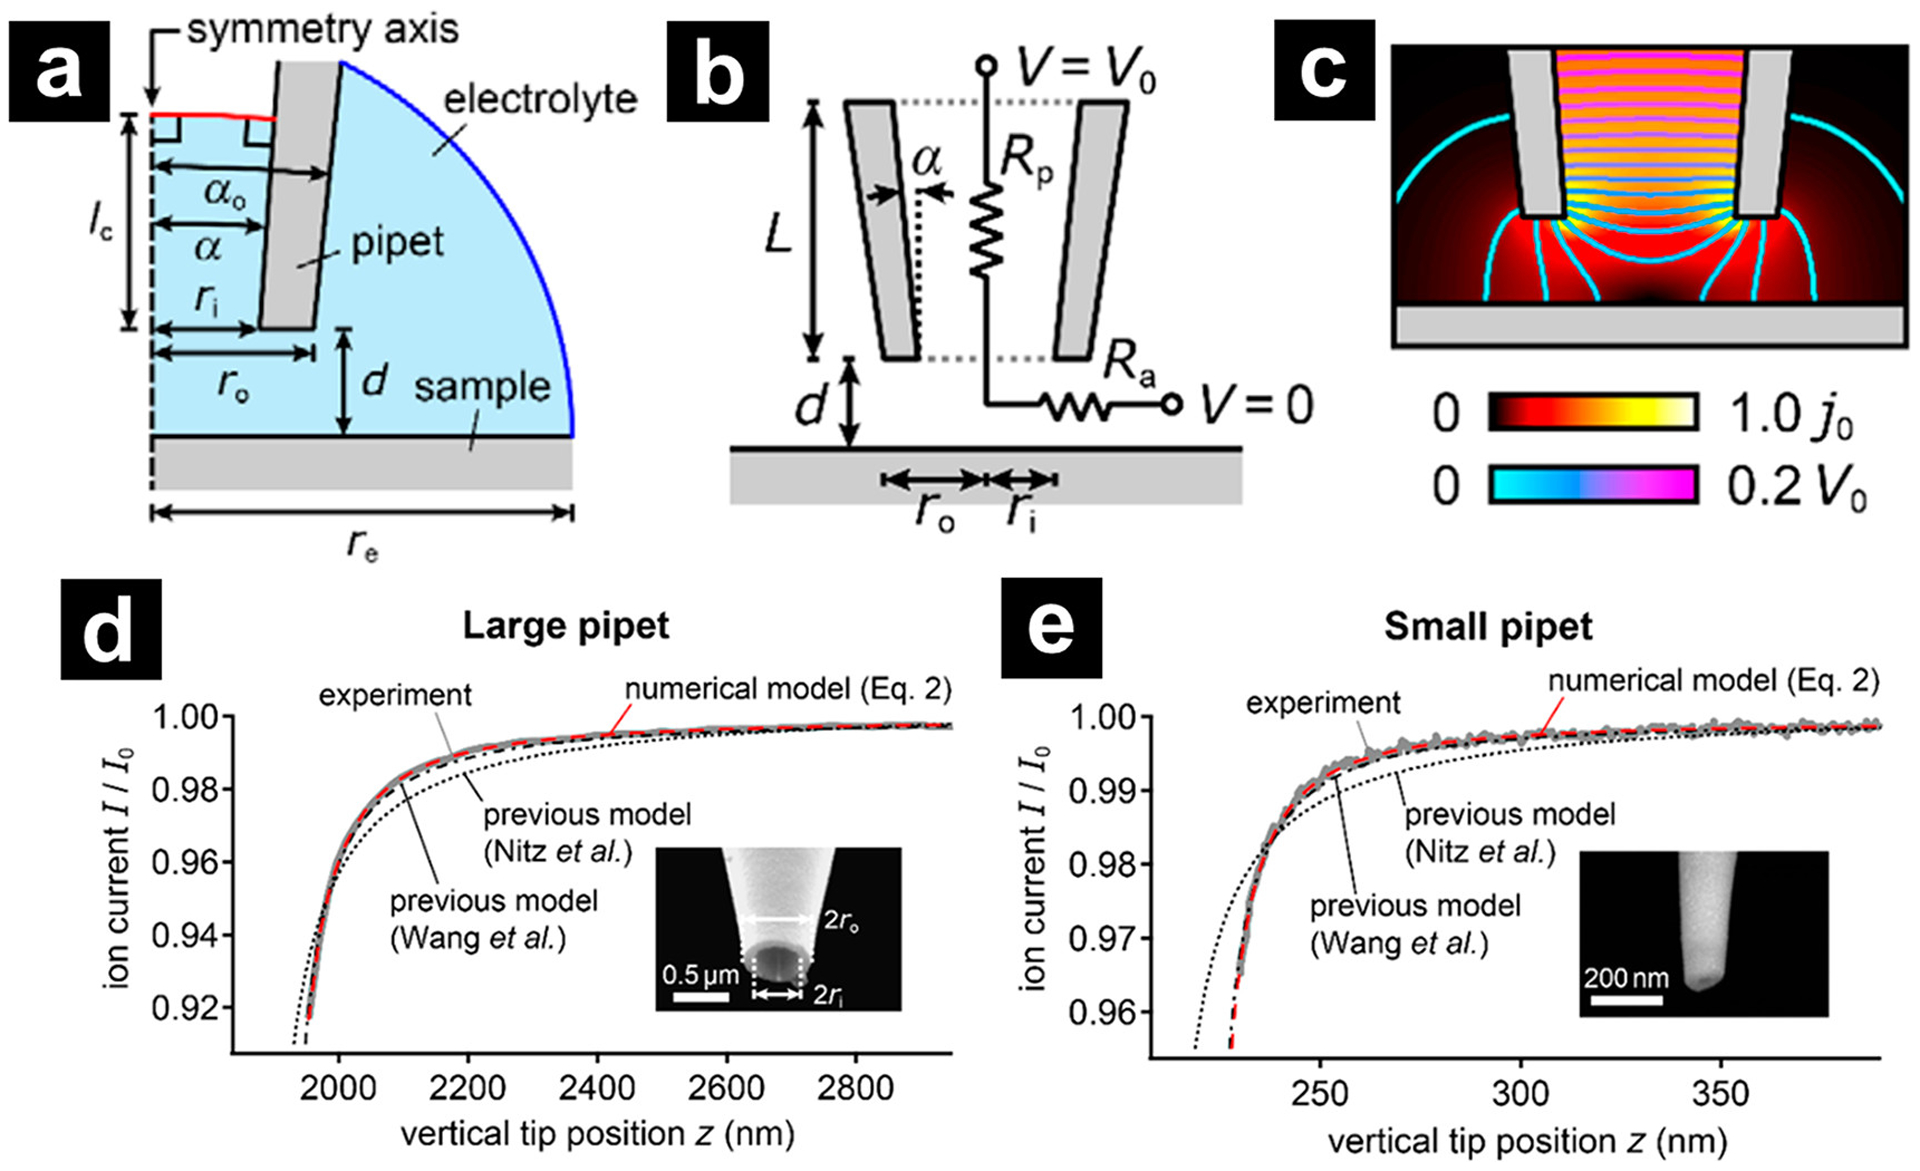
(a) Schematic of the finite element model of the tip region in cylinder symmetry (not to scale). (b) Schematic of the geometry and equivalent circuit for the ion current through the nanopipette. (c) Representative FEM calculation of the ion current density (color scale) and electrical potential (contour lines) in the tip region. (d, e) Experimental approach curves with (d) large (0.5 μm) and (e) small (200 nm) opening radii and comparison with the predictions from the numerical model based on FEM and from the previous models by Nitz et al. (dotted gray trace) and Wang et al. (dash-dotted gray trace). Reprinted from ref 15. Copyright 2017 American Chemical Society.
For obtaining Rz, a table with Rz values calculated by FEM for known ro/ri and d/ri ratios is used (see Table S1 in ref 15). Additionally, general equations approximating Rz from FEM under different tip–sample distance conditions were generated.
| (4) |
| (5) |
Combining Ohm’s Law, eq 1, and the appropriate eq (Equation. 4 or 5) for a given range of d/ro ratio provides a more accurate determination of the distance dependent ion current (I(d)), as follows.
| (6) |
As shown in Figure 3d and 3e, the prediction from the numerical model matched well with the experimental data and showed significant improvement over the Nitz model14 and minor improvements to a model previously reported by Mirkin and coworkers.54 The model can also accurately predict the pipette geometry from experimental approach curves by fitting the data to eqs 4–6.
3. DEVELOPMENT OF SICM
3.1. Scan Mode Development
3.1.1. Nonmodulated Mode.
Direct current (DC) mode is the simplest and was the original scan mode developed for SICM.1 As mentioned in Section 2.1, a constant potential applied between the pipette electrode and reference electrode generates an ion current. As the pipette is approached close to the sample surface, the narrowing gap between the tip and surface generates an increasing access resistance and results in an exponentially decaying current. This current drop is used as direct feedback to control the movement of the pipette in the vertical direction for DC scanning mode. Briefly, the pipette is continuously approached to the surface until a preset set point (where the set point is a preset value, e.g., 99% of the steady-state ion current at distances far from the sample surface) is achieved, and the position of the Z-scanner is recorded. The pipette is then laterally scanned across a predefined scan area, and the ion current is recorded continuously during this process. Based on changes in the ion current, which result from changes in the access resistance during lateral movement of the pipette, the vertical position of the pipette is adjusted accordingly by the Z-scanner to maintain the set point. A topographic image of the scan area is then generated by plotting the Z-scanner positions as a function of the X and Y coordinates.
3.1.2. Modulated Mode.
High-resolution and noncontact scanning properties make SICM suitable for fragile and noninvasive sample measurements, especially for biological samples.39,67,68 However, the DC current is susceptible to drift during prolonged DC mode scanning,69 which can cause the change of tip sample distance and result in either the tip crashing into the surface or disengaging from the surface. The use of alternating current (AC) feedback in modulated modes helps solve this problem. Depending on the methods used to generate AC signal, modulated modes can be further classified into distance-modulated and bias/phase/amplitude-modulated modes.
Early on, distance-modulated mode was key to establishing robust imaging for complex samples.17,69,70 Here, a small oscillation with a fixed amplitude is applied to the Z-piezo actuator during scanning to dither the tip vertically in space at a constant displacement. When close to a surface, this oscillation induces an AC component in the measured ion current, which can be analyzed with a lock-in amplifier for feedback control (Figure 4a).17,69,70 Figure 4b shows a typical distance-modulated mode approach curve. At distances far from the surface, vertical dithering of the tip does not change the ion current because the distance-dependent access resistance between the tip and surface has not developed. The magnitude of AC current increases quickly when the tip is approached closer to the surface as the access resistance begins to dominate the ion current response, resulting in an exponential increase in the AC component of the signal. Similar to DC mode, noncontact scanning can be achieved by scanning the pipette across sample surface with a constant AC current magnitude. AC feedback depends on measuring relative changes (the magnitude of the AC response) and, as a result, minimizes the effects from thermal fluctuations, electrode polarization, or partial blockage of the pipette (relative to DC methods), which greatly extends the application of SICM in complicated environments. Although later scan modes have dominated in more modern SICMs, distance-modulated mode retains utility for the study of samples in select settings, for instance concentration gradients or electric field gradients.71
Figure 4.

(a) Schematic of distance-modulated mode and (c) bias/phase/amplitude-modulated mode of SICM and the (b) AC magnitude change or (d) phase shift during the approach. Panels a and b are adapted from ref 70. Copyright 2001 Elsevier Ltd. Panels c and d are adapted from ref 72. Copyright 2014 American Chemical Society.
Limited by the resonant frequency of the piezoelectric actuator (typically several kHz), the distance-modulated mode suffers from slow scanning speed. The development of bias-modulated,72–74 phase-modulated,75 and amplitude-modulated76 SICM have helped to overcome this limitation. Similar to conventional distance-modulated modes, these scan modes use an AC signal as feedback to control the vertical movement of the pipette. However, instead of physically dithering the pipette, an AC component of the signal is generated by introducing an additional voltage modulation to the existing DC voltage (Figure 4c).
As shown in Figure 4d, when approaching in bias/phase/amplitude-modulated mode, the magnitude of change is reminiscent of that observed in DC mode (the AC magnitude is stable when the tip is far away from the surface and drops exponentially when the tip gets closer to the surface). Phase shift, another parameter usually taken into consideration when analyzing AC signals, shows a monotonic increasing trend when the pipette is approached to the surface in bias/phase/amplitude-modulated modes. Based on the characteristics of the current/phase approach curves in the bias/phase/amplitude-modulated SICM, one can summarize that both the AC current change (negative feedback) and phase shift (positive feedback) can be used as feedback to control the vertical movement of pipette. However, both signals have an effective frequency range, which is up to 500 Hz for current feedback and 100 Hz to 30 kHz for phase feedback.72 Higher modulation frequencies attenuate both the current and phase change, and result in sensitivity loss in measurement of height.
Similar to distance-modulated SICM, bias/phase/amplitude SICM provides more sensitive feedback and avoids factors that induce drift in DC modes. At the same time, bias/phase/amplitude mode scans faster than distance-modulated mode because the alternating current is generated by the alternating voltage instead of the physical oscillation of the piezo, meaning the frequency of the AC signal is no longer limited by the mechanical properties of piezo actuators. As a result, the modulation frequency can be easily tuned to several tens of kHz, which can significantly increase scan speeds, though attention should be paid to achieve optimum S/N ratio. Additionally, in some conditions, bias-modulated modes allow low or no DC offset to be used, which can provide an advantage in minimizing electrode polarization at long scan times.
Use of higher modulation frequencies (compared to lower modulation frequencies) can reduce the slope of the approach curves for the region when the tip is close to the surface, resulting in loss of feedback sensitivity.72 This change can be explained with an equivalent RC circuit. As shown in Figure 5a, SICM can be simplified as a resistor Rtotal (the resistance from the orifice of the pipette tip, the gap between the pipette and the substrate, and the resistance of electrolyte) in parallel with a capacitor Ctotal (the wall of the pipette, and stray capacitance). The application of the voltage modulation, Uac, results in a total alternating current of Iac in this simplified SICM circuit. Iac is then divided between Ctotal and Rtotal and generates a capacitive current Icap and an ion current Itip that pass through the pipette tip, which are used as the feedback control in SICM. At low frequencies, Iac flows predominantly through the resistive components and results in an Itip with a similar magnitude to that generated in distance-modulated mode. In contrast, at high modulation frequencies, the capacitance component, Ctotal, becomes an alternate pathway for current flow. Because the impedance of a capacitor is inversely proportional to the AC frequency, the pipette wall generates almost no impedance to the high frequency AC current and Icap becomes the primary component in the total alternating current. As a result, Itip/Iac, is greatly diminished under the same applied potential, sacrificing the signal used for feedback control.72 To avoid the division of Iac by Ctotal and maintain the magnitude of Itip at high modulation frequencies, bias/phase/amplitude SICM with capacitance compensation was developed by introducing an additional operational amplifier.73 The additional operational amplifier generates an additional capacitive current pathway with a capacitance of Ccomp and a current of Icomp. The relationship between Iac, Itip, and Icap is illustrated in Figure 5b as a vector diagram. The introduction of Icomp yields a new total capacitive current of I′cap and increased the ratio of ion current to compensate the ion current loss during the usage of high frequency modulations.
Figure 5.

(a) Simplified equivalent circuit of the SICM when an electrolyte-filled single barrel pipette was immersed in electrolyte solution, where Uac and Iac represent the amplitude of potential modulation and the total alternating current in the system. Ctotal represents the total capacitance in the system, while Rtotal represents all the resistive components in solution. Icap and Itip are capacitive current and the ion current measured at the tip, respectively. The relationship between Iac, Itip, and Icap is illustrated in (b). Capacitance compensation generates an additional current Icomp with the opposite direction to Icap, the total capacitive current is reduced to I′cap. As a result, the percent of Itip in the total AC current increases. Figures are adapted from ref 73. Copyright 2015 Institute of Electrical and Electronics Engineers.
3.1.3. Pulse Mode.
Pulse mode77–79 is another alternative scanning mode that was designed for long-term measurements. In this mode, each approach process is divided into a number of small steps, typically 10–100 nm. After each small step, a current pulse is applied between the electrodes and the required potential to reach the current amplitude is measured to calculate the access resistance. The resistance is compared with the steady-state resistance when the pipette is far from the surface. When the access resistance exceeds a predetermined value, the approaching process is terminated, and the pipette position is recorded for topography reconstruction. The pipette is then retracted and repositioned at the next XY-coordinate for the next approach. Pulse mode provides a novel approach for noncontact imaging. However, the application of current pulses requires a charging and discharging process at each approach step, which slows the scanning speed, especially for systems with a high parasitic capacitance. This drawback limits the application of this scan mode. Although not widely adopted in SICM scanning, pulse mode contributed greatly to the development of hopping mode.
3.1.4. Hopping Mode.
To advance topographic imaging of cell samples with complicated surface structures, hopping mode,80,81 and standing approach (STA) mode82,83 were developed. These modes share a similar strategy for noncontact imaging, in which the pipette is repetitively approached (often at each pixel) to the surface from a position far away from the surface to avoid any possible collision of the pipette and surface feature (Figure 6a). Essentially, these modes constantly perform approach curves, although over controlled, short distances. Approach retract scanning (ARS) mode84–86 further divides the approach process into two components: a coarse approach region and a fine approach region dictated by changes in the ion current magnitude. A faster approach speed is used during the coarse approach until an intermediate set point (e.g., 99.5% of the steady-state current) is achieved. Then, the approach speed is reduced for the fine approach until a higher, final set point is achieved. The introduction of the fine approach process acts to reduce tip–sample interactions caused by the overshoot of the tip and increases the precision of topography measurement.
Figure 6.

(a) Schematics of a conventional hopping mode and (b) a high-speed hopping mode with small retract height and back step movement. (c) Hopping mode with feature prediction and (d) transverse-fast scanning mode. Panel a is adapted from ref 80. Copyright 2009 Nature Research. Panel b is adapted from ref 87. Copyright 2017 American Chemical Society. Panel c is adapted from ref 88. Copyright 2017 Elsevier Ltd. Panel d is adapted from ref 89. Copyright 2018 Cambridge University Press.
Although beneficial for noncontact scanning, the use of hopping mode inherently reduces scan speed due to the repetitive vertical movement of pipette. This is especially uneconomical when scanning relatively flat areas of a sample where completely retracting the tip to the original starting point is not required. Optimization of pipette travel routes during scanning is commonly used to overcome this drawback. The Dietzel group77,78 and Korchev group80 incorporated adaptive resolution and hop height for different parts of the scan area which minimized the time required for imaging. To implement adaptive scanning, a low-resolution prescan was recorded to estimate the roughness of different parts of the scan area. With knowledge of the topography, a high retract height and pixel resolution was then used in areas of the sample with high roughness and a low height and resolution was used in the flat areas.
Other significant scan protocols and algorithms have been developed subsequently to optimize scan routines and increase scanning speed. Matsue and coworkers87 incorporated an automated hopping height adjustment function with conventional hopping mode (Figure 6b). In this new algorithm, the hop height was set to a value smaller than the surface roughness (typically, under 500 nm) for high-speed scanning on flat areas. When scanned over areas with features of interest, current decrease during the lateral movement of pipette triggered a back-step process, in which the pipette was moved back to a previous XY position and a higher hop height was used until the pipette scanned over the feature. Mugabo and coworkers also developed a similar adaptive scanning mode that made use of feature prediction (Figure 6c).88 Briefly, a pipette was moved to an interface until it reached a set point in conventional hopping mode. Next, the pipette was stepped laterally a short distance to the next pixel, and the current change was monitored during this process. If the current dropped by a preset value, then the system determined the next measurement point as a feature with a steep increase in topography. The pipette was then fully retracted and moved over the feature at a safe height, to resume scanning. Otherwise the pipette was moved directly to the next point without retracting. With this strategy, the pipette does not have to be retracted over areas that are relatively flat or have a decrease in height, which limits the total distance the pipette travels, greatly reducing the scan time.
Transverse-fast scanning mode (TFSM) is another advanced hopping mode proposed by the Mugabo and coworkers.89 Different from the aforementioned methods, TFSM reduced the total travel distance by setting a maximum height for each line scanned in an image (Figure 6d). To determine the height limit for each line, the pipette was approached from a position far away from the surface to the sample surface by a distance Δz. Then the pipette was quickly scanned horizontally to search for an ion current drop. If the current remained constant during this process, the pipette was further approached by another Δz and the same horizontal scan was carried out again. This procedure was repeated until a preset current drop was achieved. The height was then set to a maximum height for that line, and the pipette was always retracted to this max height to minimize the retraction required. Although the process of searching for the max line height requires additional time, less time is consumed overall when compared to unguided retract heights. Ultimately, TFSM was found more efficient (in time) than conventional hopping mode.
Development of angular approach SICM is another advance in hopping mode SICM.90 In many SICM setups, the Z-piezoelectric actuator is mounted directly over the objective of an inverted microscope. This design is especially useful if an optical technique, such as confocal microscopy, is used as the pipette tip and focal point of the microscope objective can be colocalized. However, the design interferes with the possibility for mounting diaphragms, condensers, and polarizers, and can also limit the function of the optical microscope. Angular approach hopping SICM addressed this problem by mounting the SICM scan head (XYZ piezoelectric actuators and pipette) on a standard patch-clamp micromanipulator held to the side of the central axis of optical path of the microscope. An approach angle between 0° and 90° relative to the surface normal and a beveled pipette are used to compensate for the off-axis placement of the pipette. An attribute of angular approach SICM is interfaces that often inaccessible to scanning probes (e.g., cell edges contacting the substrate) can be investigated. Furthermore, an upright optical microscope can be used in this setup allowing optical imaging of samples grown on non-transparent substrates. This setup also provides more space for different mountings, such as patch-clamp headstages and an upright reflective light microscope, to create additional opportunities for the hybridization of SICM with other techniques.
3.1.5. Hybrid Mode.
Hybrid mode is another method to achieve high-resolution and fast-scanning with SICM through image reconstruction.91 Briefly, the first line of the scan area was acquired by hopping the pipette to create an accurate line profile. From the second line, a set point range was defined and the pipette was laterally scanned over the sample surface following the trajectory of the previous line for fast-scanning purposes. The ion current set point range consisted of an upper and lower limit. During scanning, ion current was monitored and used as feedback to adjust the scan trajectory so that the ion current fell within the defined set point range. Ion current exceeding the upper set point limit indicated the tip was too far from the sample surface and, as a result, the scan trajectory was adjusted to bring the pipette closer to the sample surface for subsequent points. In contrast, when the ion current fell below the lower set point limit, the pipette was moved away from the sample surface for successive scanned points. As the recorded Z-positions of the pipette were not topographically accurate and can only reproduce low spatial frequency features, additional calibration of topographic heights was necessary.
3.2. Instrumentation Improvement
In step with other scanning probe platforms, SICM has continuously developed for a higher scanning speed, higher resolution, and lower noise. Many of these improvements are realized with advances in instrumentation and in software.
3.2.1. High-Speed SICM.
While the advantages of SICM, including the label-free, noncontact imaging, are attractive for biological samples, the overall speed of imaging by SICM can be a drawback. Thus, the development of high-speed imaging is an area of significant development. Methods to achieve high-speed SICM imaging can be classified into two categories. The first, focuses on the instrumentation improvements, specifically, using piezo actuators with high resonant frequency and better control electronics to realize faster rates of pipette movement. The second category emphasizes the optimization of scan routines, specifically, reducing the time spent on areas with limited changes in topography. Developments in scan routines was discussed previously (Section 3.1). Here, we will mainly discuss efforts made in instrumentation for high-speed SICM.
Most modern SICM scan modes are based on some version of hopping mode, and thus the majority of probe travel occurs in the vertical direction. With this in mind, an obvious route to elevate imaging speed is to improve the approach and retract rate of the Z-piezo. For normal SICM hardware, Z-piezos with travel range in the tens of microns and resonant frequencies of several kHz are used in SICM to provide range in measuring complex samples.1,39 Ando and coworkers reduced the single pixel acquisition time to ~1 ms with a 100 kHz resonant frequency Z-piezo actuator.92,93 With improvements in piezo design, Schäffer and coworkers also reported use of approach rates as high as 11 kHz that resulted in pixel acquisition times to ~0.6 ms.94 Higher frequency piezo actuators provide the most direct route to higher approach/retract speeds, but consequences of fast movement exist. One side effect that occurs more frequently in high-speed imaging is “overshoot”, depicted in Figure 7. During the scanning, the pipette is continuously approached to the sample surface by the Z-piezo actuator. When the predefined threshold is reached, (labeled the trigger position in Figure 7, which is analogous to the set point) the controller reverses the direction of movement, retracting the tip from the sample surface. This reversal in direction is not instantaneous, due to the response time of the piezo and signal delay in the circuit. As a consequence, the tip continues to approach to the sample surface, defined in Figure 7 as an “overshoot time” (Δt). The distance traveled during this period, the overshoot distance (Δz), is proportional to the approach rate of the piezo actuator and inversely proportional to the resonant frequency of the piezo. For conventional SICM, overshoot is not a serious problem because slow approach rates result in minimal overshoot distances. But for high-speed SICM, the overshoot cannot be ignored because the approach rate can reach several hundred micrometers per second, where even a short overshoot time may result in a significant overshoot distance.
Figure 7.

Time course of the sample’s z-position (upper graph) and of the ion current (lower graph) during an approach curve in the hopping mode. The sample is vertically approached toward the nanopipette tip with a velocity vAppr. At the trigger position, a preset current trigger occurs at the trigger time tTrig (dotted vertical line). The controller then inverts the slope of the z-piezo drive signal (kink in green dashed line in upper graph) to retract the sample from the nanopipette. Owing to the finite response time of the z-piezo and to signal delay, the sample does not revert its direction immediately but continues approaching the tip for an “overshoot time” Δt (red bar and black arrowheads) until the sample is at the position physically closest to the tip (“retract position”), indicated by the minimum of the current at the retract time tRetr (red dashed line). Reprinted from ref 94. Copyright 2019 Royal Society of Chemistry.
To compensate the overshoot time, Simeonov et al. improved the scan protocol by adding a turn step to the conventional hopping mode,94 in which the pipette was immediately retracted by several tens of nanometer with the maximum speed after reaching the threshold. After the fast retraction process, the pipette was further retracted to the predefined retracted point under the control of the regular retraction process of hopping SICM. This overshoot compensation strategy requires a high resonant frequency piezo. However, resonant frequency and travel range are trade-offs because of the physical property of piezoelectric ceramic materials, which lead to short travel ranges for high frequency piezos.
To overcome this hardware limitation, a wide-range (low-frequency) and high-frequency (short-range) shear piezoelectric actuator stack was employed.22,95,96 The wide-range piezo controls the regular vertical movement of the pipette during scanning. After reaching the set point for each approach, the additional high-frequency shear piezo controls the immediate retraction of pipette to compensate the overshoot distance generated by the wide-range piezo.
The use of a high resonant frequency piezo actuator for the X scanner also helps increase the scan speed.92–94 Because high frequency piezos usually have a short travel range, an amplification in travel range is necessary for the practical application of a high frequency piezoelectric scanner. This problem was also addressed by Ando and coworkers.92 As shown in Figure 8, the travel range can be mechanically magnified with flexure-based XY nanopositioning stage.97 The piezo stacks are connected to beam flexures and the z-piezo through amplification levers and circular flexure hinges. With this design, the small vibration on the piezoelectric actuators can be magnified several times depending on the thickness of the beam flexure near the z-piezo unit.
Figure 8.

(a) Schematic of the mechanical amplifier, in which the piezo stacks are connected to beam flexures (inside the orange dash circle) and the z-piezo through amplification levers and circular flexure hinges. The travel range of the nanopositioner is amplified to (b) 16 and (c) 34 μm under 100 Hz sinusoidal voltage application when the beam flexures are (b) 300 and (c) 200 μm thick. Reprinted from ref 92. Copyright 2017 American Institute of Physics.
These improvements to overcome overshoot problems and improve the travel limits of high frequency piezos have reduced the pixel acquisition time to submillisecond regions. When combined with the various improvements in scan routines and control algorithm,98 high-speed SICM is a promising tool to address practical biological problems.87,99 For easy reference and comparison between different scan modes, scan speeds of SICM have been estimated for selected reports from the literature and reported in relative values as pixel frequency (the number of pixels measured per second) in Table 1. Note: these values are estimations and the reader is encouraged to consider additional image collection factors in any full analysis.
Table 1.
Pixel Frequency for Different SICM Scan Modes
| scan mode | sample | scan area (μm2) | pixel | time | pixel frequency (Hz) |
|---|---|---|---|---|---|
| distance-modulated mode | silicon substrate275 | 10 × 10 | 256 × 256 | 10 min | 109 |
| pulse mode | hippocampal cells77 | 15 × 15/30 × 30 | 60 × 60 | 30 min | 2 |
| hippocampal cells78 | 30 × 30 | 60 × 60 | 20 min | 3 | |
| oligodendrocyte precursor cells79 | 30 × 30 | 30 × 30 | 10 min | 1.5 | |
| ARS mode | HeLa cells86 | 60 × 60 | 128 × 128 | 10 min | 27 |
| H460 cells84 | 5 × 5/10 × 10/20 × 20 | 128 × 128 | 15–52 min | 5–18 | |
| ARS mode with predicted movement | myocardial fibroblast cells88 | 64 × 64 | 128 × 128 | N/A | 26 |
| breast cancer cells88 | 64 × 64 | 128 × 128 | N/A | 19 | |
| ARS mode with continuous control | cardiac fibroblast cells85 | 100 × 100 | 100 × 100 | 244 s | 41 |
| STA mode | MCF-7 cells82 | 100 × 100 | 128 × 128 | 450 s | 36 |
| hopping mode | A6 cells91 | 40 × 40 | 128 × 128 | 25 min | 11 |
| hopping mode with fast retraction | HeLa cells22 | 64 × 21.25 | 512 × 170 | 45 min | 32 |
| Cos-7 cells95 | 1 × 1/1.5 × 1.5/2 × 2 | 32 × 32 | 7–17 s | 60–146 | |
| alveolar epithelial cells96 | 6.4 × 6.4 | 64 × 64 | 2 min | 34 | |
| AT1-like cells96 | 1.2 × 1.2 | 20 × 20 | 6s | 67 | |
| AT1-like cells96 | 2×2 | 32 × 32 | 15 s | 68 | |
| hopping mode with adaptive retracted height | A431 cells87 | 10 × 10 | 64 × 64 | 18 s | 228 |
| TFSM mode | murine cardiomyocytes89 | N/A | N/A | N/A | 32–36 |
| MCF-7 cells89 | N/A | N/A | N/A | 19–22 | |
| automation region of interest (AR) mode | hippocampal cells99 | 30 × 30 | 64 × 64 | 68 s | 60 |
| hippocampal cells99 | 15 × 15 | 128 × 128 | 98 s | 167 | |
| hybrid mode | A6 cells91 | 40 × 40 | 600 × 1024 | 10 min | 1024 |
| hopping mode with high-speed piezo actuators | PDMS substrate92 | 25 × 25 | 50 × 50 | 3.5 s | 714 |
| PDMS substrate92 | 25 × 25 | 100 × 100 | 26 s | 385 | |
| Platelets94 | 5×5 | 32 × 32 | 0.6 s | 1707 | |
| A6 cells94 | 5×5 | 64 × 64 | 1.4s | 2925 | |
| U2OS cells94 | 10 × 10 | 100 × 100 | 6s | 1667 | |
| HeLa peripheral edge93 | 12 × 12 | 200 × 100 | 20–28 s | 650–1000 | |
| HeLa microvilli93 | 2×2 | 100 × 100 | 22 s | 455 | |
| actin filaments93 | 0.8 × 0.8/2 × 2 | 100 × 100 | 5s | 2000 |
3.2.2. Other Instrumentation Development.
Similar to high-speed SICM, use of wide-range piezoelectric actuators can expand the scan area of SICM. Schierbaum et al. reported the use of a millimeter-scale piezo scanner for macro-SICM measurement.100 In addition to improvements gained through piezo scanners for high-speed and large-scale image acquisition, improvements in pipettes are a key area of improvement for SICM measurement because the lateral resolution of scanning probe microscopy is inversely proportional to the size of tip of the probe. Minimizing the pipette diameter becomes a predominant method to improve SICM image resolution. In a notable example of this, reduction of the pipette inner diameter to 13 nm allowed Korchev and coworkers to resolve single proteins at a cell surface.26
Multiprobe SICM is another direction to improve imaging, in which two or more probes are used in the SICM setup. Zhuang et al. introduced a double probe SICM configuration for physical current drift cancellation by replacing the reference electrode with a reference probe operated with exact same conditions as the scan probe.101 Kawashima et al. reported a method to fabricate a SiO2 nanoneedle array and demonstrated the possibility of multisite SICM measurements.102 Of note, application of pipettes with two or even more barrels is also widely accepted for multifunctional measurements, such as electrochemical reactions,103–107 surface potential measurements,108 and conductance measurements.20,99,109–112 Details of these techniques will be discussed in Section 3.4 in this review.
3.3. Algorithm Improvement
3.3.1. Scan Area Expansion.
As described in previous sections, a wide-range piezoelectric actuator can be used to expand the scan range of SICM to millimeter ranges (Macro-SICM). However, increases in the scan scale also increase the cost for SICM and unavoidably reduces resolution because of the decrease of piezo resolution. The Yu group provided an alternate solution for Macro-SICM with a stitching algorithm.113 Briefly, the large-scale area was divided into a number of small scans that were collected as a series of images. After collecting the topography information on all the subareas, a stitching algorithm was applied to the image set, in which each image was regarded as a subaperture.114 The mismatch between overlapping images was measured and minimized by tilt and drift compensation. As a result, a macro-scale image can be generated in postexperiment data analysis. Compared with the method developed by the Schäffer group,100 modification on scan algorithms achieved similar large-scale imaging without upgrading of hardware, while retaining high-resolution.
3.3.2. Boundary Delimitation.
Multiple studies have made use of SICM to investigate volume changes during dynamic cellular process, where boundary determination becomes important, especially for cell types with long extensions (e.g., astrocytes). Happel et al. proposed a boundary delimitation algorithm (BDA) to determine the soma area of cells by fitting polynomials along the parallel curves over the longer axis of the cell.115 The feasibility of this approach was demonstrated for oligodendrocyte precursors, but this algorithm is limited to cells with a bipolar conformation. Wen et al. proposed a universal boundary determination algorithm for more complicated samples,116 in which a boundary point determination criteria (BPDC) was setup based on the height difference between arbitrary adjacent points. Briefly, a threshold Δthre was determined and only adjacent points with height difference larger than Δthre were considered as the boundary between the features of interest and the substrate. The probe was initially placed at a position close to the feature and scanned until the first point meeting the BPDC was found, which represented the first boundary point. Then, the probe was scanned across the sample surface with a sinusoidal waveform in the XY plane to find the next boundary point that met the BPDC. This process was repeated until the probe was brought back to the first boundary point, with the area inside the boundary points denoting the contours of the feature imaged. Further, because BDA can depict the sample boundary in a scan area, this method is also able to decrease the scan time by limiting the scan area to the regions of interest. For instance, Xie and coworkers optimized scanning routines after determining the boundary of the sample and reduced the scan time.116
3.3.3. Compressive Sensing (CS).
As described in Section 3.1.4 and 3.2.1, improvements in both instrumentation and scan protocols have greatly reduced the scan time for SICM, especially in hopping mode. Application of compressive sensing (CS) algorithms in SICM is another strategy that can increase the scan speed of SICM. According to the Nyquist–Shannon sampling theorem, the sampling frequency must be higher than twice the maximum frequency of the signal to avoid the loss of information. However, for sparse signals, it has proven possible to break the Nyquist frequency limit to acquire high frequency signals recorded at under-sampling rates with compressive sensing algorithms. This serves to greatly reduce the number of measurement points required for scanning probe microscopy and hence the measurement time. This algorithm has found application previously in atomic force microscopy117,118 and been applied in SICM measurements recently.119–121
The CS algorithm is a process of signal compression and reconstruction. Usually, the topography data collected by SPM techniques can be represented by a p × q vector with totally n element, where p and q represent the pixel numbers for length and width. During image acquisition, the topography data can be transformed into a sparse representation with a special projection matrix (for instance, a Fourier transform). Signal compression can then be achieved by multiply the sparse representation of signal with a measurement matrix Φ ∈ Rm×n to result in an observation vector of m elements (m ≪ n). Within this process, the size of image has been compressed by an underdamping ratio of . After scanning, the compressed results are reconstructed with a reconstruction algorithm to recover the complete image.
Experiments reported have demonstrated the application of compressive sensing to reduce the scan points and hence increase the scan speed. However, compressive sensing is not widely employed for SICM measurement. One reason is the application of compressive sensing requires a complete scan of the entire area first to generate the effective measurement matrix. Although a low-resolution scan can be used within this process, it still increases the total time for data acquisition. If the time involved in generating the postexperiment image reconstruction is considered as well, time saved by CS algorithm may be subtle compared with a regular SICM scan.
3.4. Advanced Sample Characterization with SICM
The rapid development of SICM in instrumentation and algorithms has greatly expanded applications in the chemical, material, and biological sciences. At the same time, multifunctional SICM, where multiple physical and chemical properties are measured concurrently with topography, has become a powerful route to increase the analytical information collected. While technical improvements described vide supra are impressive, SICM in even the simplest incarnation provides a compelling platform for measurement at the micro/nanoscale.
3.4.1. Mechanical Property Measurement.
Understanding cell mechanics is of great importance for cell physiology and pathology investigations. Experiments have clearly demonstrated the relationship between changes in mechanical properties at the cellular level and abnormal cell functions or pathologies.122–124 However, conventional methods such as micropipette aspiration (MA),125 microfluidic devices,126,127 and optical tweezers128,129 typically reveal bulk mechanical properties of an entire cell. AFM is able to resolve the local mechanical properties of cells,130,131 but may result in the damage of biological samples.21 The development of SICM, especially the invention and optimization of the hopping mode, provides an alternative method for the measurement of local mechanical properties.
The application of SICM for elasticity measurement was illustrated by Korchev and coworkers.132 The instrument setup used in the experiment is the same as conventional SICM. A patch-clamp pipette holder was used to mount a glass pipette and the port on the side of holder was utilized to develop a pressure at the tip of the pipette. The pipette was first approached to cell surface without pressure. After being approached close to cell surface, the tip was maintained at a constant distance from the surface with feedback. Pressure was subsequently applied inside the pipette to generate a hydrostatic pressure near the tip which triggered local deformation of the cell membrane in the region under the tip. The ion current through the tip was used to track the shape change of membrane. In postexperiment data analysis, the position change of piezo was plotted with the applied pressured to extract the Young’s modulus of cells.
Pellegrino et al. proposed an alternative method for measuring elasticity of cells.133,134 Instead of maintaining a constant tip to sample distance, the pipette was approached to a cell surface several times under different applied pressures and the apparent Young’s modulus of the surface were calculated based on these collected approach curves. When no pressure was applied inside the pipette, the pipette was approached to the surface until a preset current drop was achieved. The distance approached by the z-piezo was first measured and recorded as Δz0. Pressure was then applied to the inner pipette barrel and the resultant Δz value was used to determine the relative difference in distances before the set point was reached in the absence (Δz0), and presence (Δz) of pressure. Pipette travel distances were then plotted for a range of applied pressures to obtain a deformation vs pressure curve, from which the Young’s modulus of the cell can be extracted.
Schäffer and coworkers also used approach curves to extract elasticity of cells.135,136 Different from the previous described methods, approach curves were collected at the same applied pressure over surfaces with different elasticity. As shown in Figure 9a, for distances far from the surface (currents larger than ~99% of the steady-state current), the approach curve was similar, regardless of the sample surface (Region I). As the tip approached closer to the surface (Region II), differences in slopes of the approach emerged that were correlated to the elasticity of the surface at different positions. To quantify the elasticity, the slope of approach curves between 98% and 99% current was calculated and recorded as S and the apparent Young’s modulus (E) can then be calculated by
| (7) |
where p0 is the applied pressure, A is a pipette dependent factor, S and S∞ denote the measured slope and the slope at an infinitely stiff sample, respectively.
Figure 9.
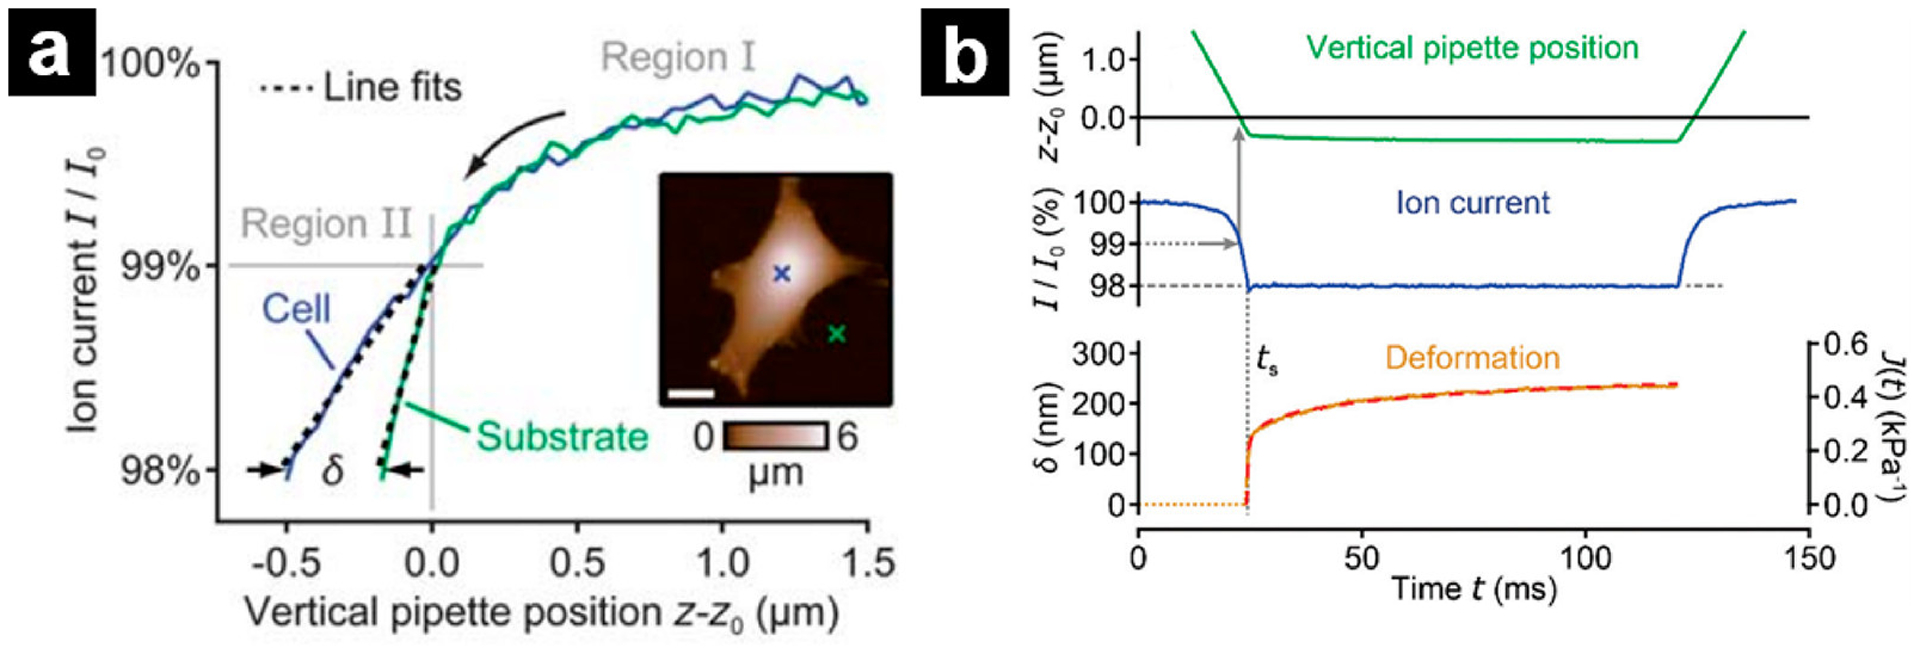
(a) Plots of ion current vs vertical pipette position (“IZ-curve”) on a living fibroblast cell and on the substrate (respective positions indicated by crosses in the topography image, inset). In the initial phase of the approach, the two IZ-curves overlap (region I). The vertical pipette position at 99% current gives the undeformed sample height, z0. Below 99% current (region II), the current drops at a smaller rate on the soft cell than it does on the stiff substrate, reflecting their different stiffnesses. The slope between 98 and 99% current is determined with a line fit. Scale bar (inset): 15 μm. Reprinted from ref 135. Copyright 2013 Royal Society of Chemistry. (b) Traces of vertical pipette position (top), ion current (middle), and measured sample deformation δ (bottom, left axis) or creep compliance J (bottom, right axis) as a function of time during the viscoelastic property measurement on cell surface. ts indicates the time point of the start of the creep measurement (dotted vertical line). Reprinted from ref 137. Copyright 2019 Royal Society of Chemistry.
Viscoelasticity is another mechanical property that describes a material’s deformation response to an instant loading force, which has been measured by SICM.137 Similar to the elasticity measurement method described by Schäffer and coworkers,135 the pipette was approached to the surface under a constant pressure until a preset threshold was reached (typically, 98% of the stable current). Then the threshold current was maintained temporarily with feedback (typically, 100 ms) and the viscoelastic creep of the sample was recorded. Typical changes of the pipette position, ion current, and sample deformation δ(t) during this process were illustrated in Figure 9b. Sample deformation δ(t) of the surface can be described with the following equation:
| (8) |
where z(t) and z0 represent the vertical pipette position at 98 and 99% of the steady-state current, and δ0 is a parameter depending on the pipette geometry.
It needs to be noted that the pipette was approached to the surface with a relative high-speed (inner radius of pipette/approach rate ≈1 ms). As a result, the force introduced to the cell surface also increased quickly, similar to an instant loading force. This loading force generated an instant deformation of the sample, which was followed by slow viscoelastic creep, which is depicted in the bottom panel of Figure 9b. The deformation of the sample can be described with creep compliance of the sample J(t) as well:
| (9) |
where p0 is the applied pressure and a is a constant related with the pipette geometry. This equation can be further transformed into a self-referencing format:
| (10) |
in which J0 is the creep compliance of sample at t0 (typically, t0 is set to 1s) and β is a parameter used to describe the viscoelasticity property of the sample.
3.4.2. Surface Charge Measurement.
As SICM is a surface sensitive technique that can operate at distances with relevance to the thicknesses of the electrical double layer (EDL). Further, because SICM relies on moving ions through the interfacial region between the tip and substrate, the influence of the composition of the EDL, a consequence of surface charge can be investigated with SICM. For pipette probes used in SICM imaging, absent the SICM setup, ion current rectification (ICR) can play a role in ion transport.37 When the pipette is immersed in solution, deprotonation of silanol groups generates a fixed negative charge at the pipette wall. To compensate the charge on the pipette wall, an EDL develops that can also perturb the local concentrations of cations and anions at the tip of the nanopipette, which when combined with the asymmetry in shape, can create nanofluidic structures with interesting transport properties. Because of the asymmetric structure of nanopipette, the EDL on the tip of pipette forms a cation selective region where cations dominate the migration and diffusion, resulting in a diode-like current–voltage response, ICR, which has been widely explored.138–140 The ICR effect is not limited to the pipette. A similar phenomenon is observed when the pipette is approached close to a substrate. In this case, the gap between the pipette tip and the surface form an additional asymmetric structure that couples to the transport properties of the nanopipette. When the access resistance is the dominant feature in ion transport, the EDL at the substrate surface can have a significant influence on rectification observed (surface induced ICR).47,63,66,141,142 Several routes to extract information related to surface charge based on this effect have been developed with SICM.
Unwin and coworkers reported the first approach to image surface charge based on the phase shifts observed in distance-modulated mode.66 Briefly, when a pipette tip is approached to a surface, physical modulation of the pipette continuously perturbs the EDL, accumulating and depleting ions near the tip opening.143,144 If the time constant of the system is small, (in this report, 1.74 ms) the accumulation/depletion of ions generates a phase shift in the measured ion current, which is proportional to electrostatic interactions in the EDLs between the pipette and surface. Figure 10 shows an example of the change in the AC component of the ion current when the pipette is approached to the charged surface, where a plasma-etched glass substrate and a (3-aminopropyl) triethoxysilane (APTES) functionalized glass substrate are used as the negative and positive surfaces, respectively. A significant phase shift is observed in the conditions where an amplification of the modulated current exists. An AC phase image can be plotted with respect to pipette position to illustrate the surface charge in the scan area, where a higher phase shift is related to a more significant electrostatic interaction between the tip and surface. Surface charge density values could be extracted by fitting results to finite element models in postexperiment data analysis.
Figure 10.
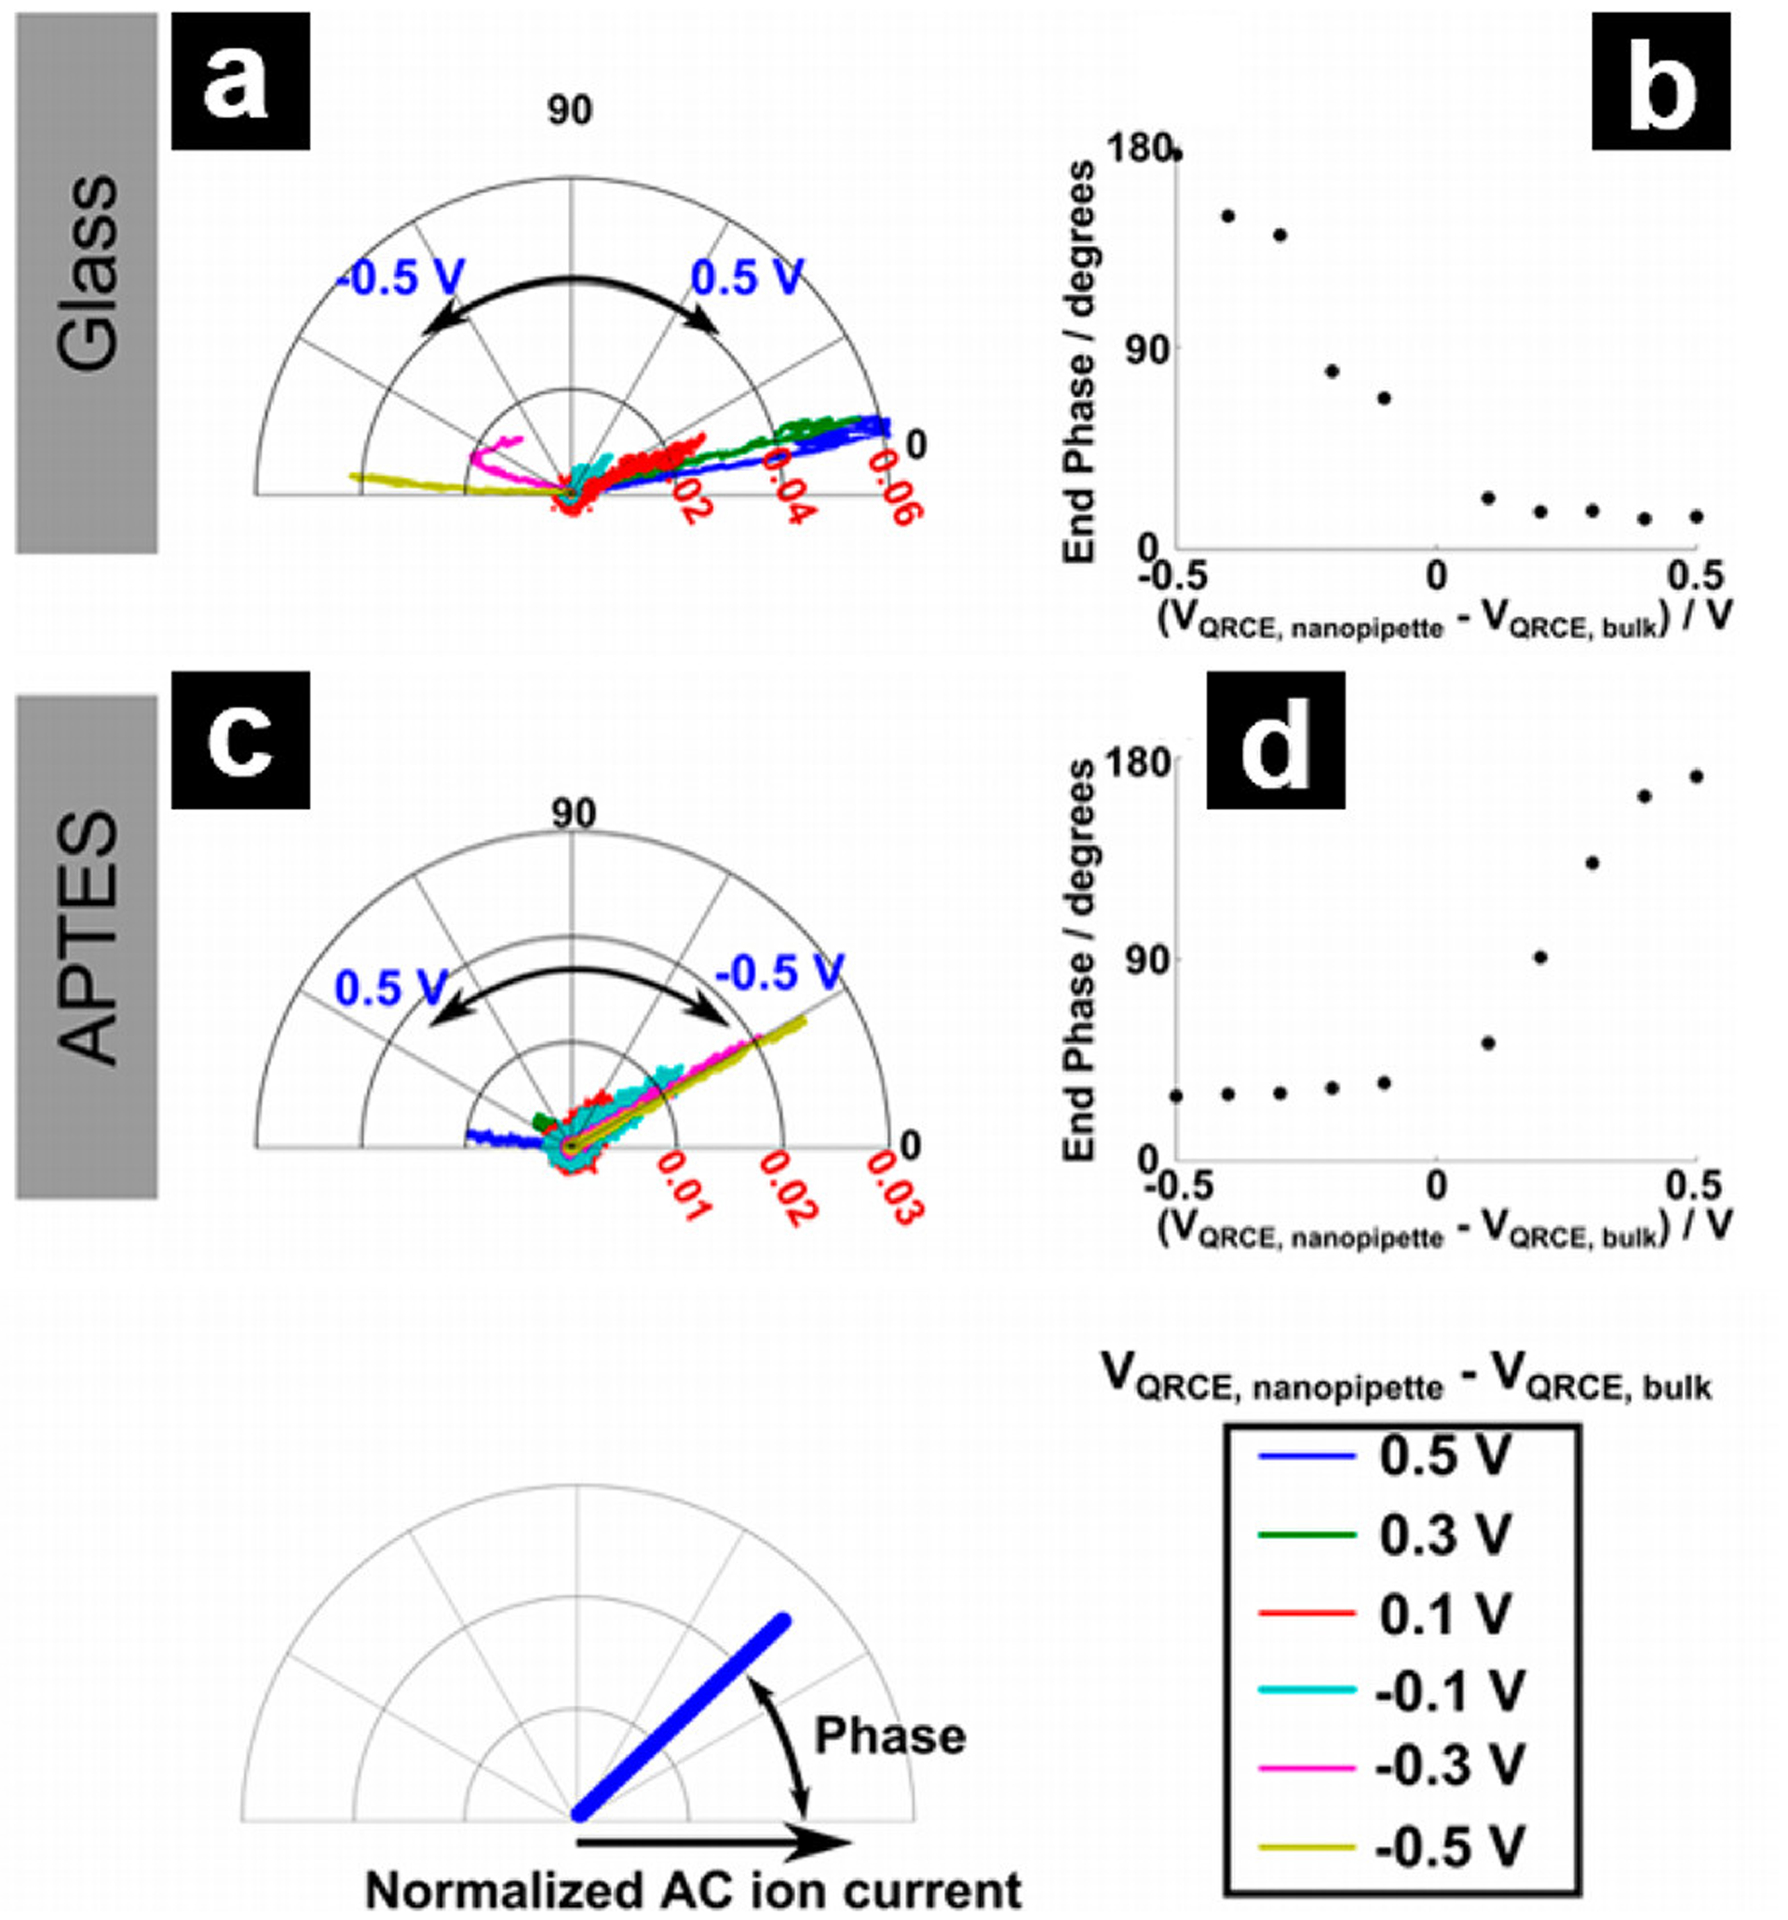
Polar plots, with the distance from the origin defined by the AC ion current magnitude normalized by the bulk DC ion current and angle defined by the ion current phase, as shown in the inset diagram at the bottom left, of the AC ion current over glass (a) and APTES (c) substrates. The phase value at the smallest nanopipette–surface distance with respect to the applied bias on glass (b) and APTES (d). Reprinted from ref 66. Copyright 2014 American Chemical Society.
Current enhancement or reduction that results from the EDL interactions between the tip and surface inevitably influence the feedback mechanism of SICM, especially at high scan potentials. As a consequence, artifacts that depend on surface charge can also be manifested in topographic images. The usage of bias-modulated mode addressed this issue.64,65 Instead of a constant bias, a voltage modulation with mean bias of 0 V is applied in this method and the phase shift of the AC current is used as feedback to control movement of pipette. After the pipette is approached close to surface, the applied potential is swept (typically, between −0.4 and 0.4 V) to acquire a cyclic voltammogram (CV). The same potential sweep is applied after the pipette is retracted away from the surface and used as a reference to exclude the ICR from the pipette. The surface charge in the scan area can then be revealed by plotting either the phase shift or the current changes at extreme potentials (−0.4 or 0.4 V) with the XY coordinates. Similarly, the exact values of surface charge can be extracted with finite element analysis in postexperiment data analysis. Compared with distance-modulated mode, bias-modulated mode avoids the surface charge induced artifacts in topography measurement. At the same time, the introduction of self-referencing greatly reduces the influence of pipette ICR and current drift. Several other similar self-referencing surface charge measurement methods are developed, in which the surface charge is revealed based on the change of current–time (IT) responses41,145–147 or the IV responses.148,149
As mentioned previously, charged features on a sample can introduce artifacts in topographic images when the net scan bias is not zero.150,151 Artifacts can also be used to quantify the surface charge density. Quantitative surface conductivity microscopy (QSCM), was developed on this basis.150,152,153 To probe surface charge, the same area is scanned twice. One of the scans is completed under a positive potential while the other scan is under a negative potential with the same amplitude. In postexperiment data analysis, the height difference between the positive scan and negative scan is plotted with XY coordinates to represent the surface charge on the surface. The exact values for the surface charge density can be extracted with finite element analysis.
Surface charge measurement with SICM can be a relatively slow and complicated technique because most of the methods are developed based on the current change, which requires special modifications on the hardware and software to incorporate CV, IT, or IV measurement into topography measurement. The development of QCSM simplifies the measurement by extracting the surface charge density from topography artifacts instead of current changes, which makes the surface charge measurement possible with conventional SICM without further modification.
Surface charge is also related to the surface potential. He and coworkers reported a clever route to simultaneous topography and surface potential measurement.108,154 The protocol uses hopping mode and a dual barrel pipette as the probe. In the experiment, the scan potential was applied inside one of the barrels to generate ion current for feedback control while the other barrel was used to record the open circuit potential during scanning. At the same time, the z-piezo position was monitored continuously as well. After the scan was complete, the open circuit potential when the pipette was far from the surface was subtracted from the one measured when in proximity to the surface, to provide a surface potential map.
3.4.3. Conductance Measurement.
Nanoscale ion transport, especially across interfaces such as membranes, is an important topic to fundamentally understand biological and materials systems. Probing ion transport requires delicate measurement techniques with high spatial resolution, criteria for which SICM is well-suited. For example, epithelia play a critical role in regulating the transport of ions and large molecules for living organisms primarily through energy-consuming transcellular pathways and passive paracellular pathways through cell junctions.155,156 Conventional Ussing chambers157 can be used to capture macroscale transport properties of epithelia and tissues. For local information, transcellular ion transport is typically studied by patch-clamp techniques.158 Direct measurement of paracellular conductance at the nanoscale still remains an area of active study. Recent advances in SICM have provided routes to address this measurement challenge.
Conductance measurements with SICM have been developed by Baker and coworkers.42 During distance-modulated SICM scanning, the DC current is recorded at the same time. Because the tip is in close proximity to the sample surface during scanning, the DC current is directly related to the local conductance (or local ion concentration). Therefore, an image reflecting local conductance can be generated by plotting the DC current with respect to XY coordinates. Track-etched polyimide membranes are used as samples to demonstrate the feasibility of SICM for ion transport measurement. As shown in Figure 11, the location of electrodes in the SICM setup can be used to isolate different conductance pathways. For instance, in Figure 11a the reference electrode is placed on the bottom chamber to utilize the electric field between the reference electrode and the pipette electrode to drive the movement of ions. Extensive experiments have been carried out with this model to investigate the influence of concentration gradient,42 pipette modulation, and imaging distance71 on the ion current over the pore. The method can be improved by moving the reference electrode to the top chamber and adding a third Ag/AgCl electrode in the bottom chamber as working electrode (Figure 11b). With this configuration, transmembrane potential and scan potential for SICM can be applied separately at different electrodes, allowing local conductances to be measured at the pipette tip.159 However, the three-electrode configuration still suffers from the potential fluctuations on the reference electrode under significant current flow. This drawback is addressed by introducing a fourth Pt counter electrode on the top chamber (Figure 11c.)160 The additional counter electrode carries the majority of the current. As a result, the current passing through the reference electrode is negligible, allowing the measurement of samples with high membrane conductances.
Figure 11.

Schematic of the (a) two electrode, (b) three electrode, (c) four electrode, and (d) five electrode configuration for conductance measurements. Panel a is adapted from ref 42. Copyright 2009 American Chemical Society. Panel b is reprinted from ref 159. Copyright 2011 American Chemical Society. Panel c is adapted from ref 160. Copyright 2012 American Chemical Society. Panel d is reprinted from ref 110. Copyright 2014 American Chemical Society.
The development of the current-based conductance measurement methods is a process of addition of electrodes in the setup and the four-electrode configuration is the extent of development for current measurements. To facilitate biological measurements, an additional electrode has been added in a configuration termed potentiometric-SICM (P-SICM).20,109–112 Different from the current-based conductance measurement methods, P-SICM uses a dual barrel pipette as the probe and uses the potential change at the tip to extract local conductance information (Figure 11d). Five electrodes are used in this system, with the fifth electrode, the potentiometric electrode inserted in the other barrel of the pipette for local potential measurement. The placement of the other four electrodes is the same as the four-electrode configuration for current-based measurements and serves the same purpose. Local conductance can be calculated with the following equation:
| (11) |
where G represents the apparent conductance, E is the electric field measured by the potentiometric electrode, ρ denotes the specific resistance of the bath solution, and Ve is the range of applied transmembrane potential. In experiment, a self-referencing measurement is used to get the electric field, and the potential deflections are measured at a point close to the surface and then a position far away from the surface. In this report,109 tip to sample distances of 200 nm and 12.5 μm were used, which can be represented in terms of eq 12 as follows.161,162
| (12) |
Here, the electric field is calculated with Δ0.2 μm and Δ12.5 μm, the potential deflections at a pipette sample distances of 200 nm and 12.5 μm, respectively, and Δz the height difference between these points.
An alternating current version of P-SICM (AC-PSICM) was also developed that used a sinusoidal transmembrane potential instead of linear potential sweep in normal P-SICM.163 A four-electrode configuration is used for AC-PSICM, including a three-electrode configuration (WE, RE, CE) to apply the AC sinusoidal transmembrane potential and an additional potential electrode inside a single barrel pipette to detect the resultant potential deflection. This signal is then fed into the lock-in amplifier to extract the phase information, which can be converted to conductance in postexperiment data analysis. The use of sinusoidal transmembrane potential provides additional benefits when compared with the linear potential sweep. For instance, resistance from difference parts of the sample can be resolved based on the distinct frequency responses of the sample. The image acquisition rate may also be increased as well by increasing the frequency of the sinusoidal wave.
Compared with the current-based conductance measurement methods, P-SICM shows an improved signal-to-noise ratio. A physiological solution environment with a transmembrane potential of ~100 mV generates adequate signal for measurement, which makes the application of P-SICM to epithelial monolayers possible.111,112 The heterogeneity of local conductance at cell surfaces can be divided into the following steps. First, a topography image of the area of interest was acquired. Then several features on the topography image were picked up and the conductance was measured successively by manually positioning the tip on these features. Usually, this measurement was repeated several times on other areas of the sample with similar features and data was analyzed by a series of statistical tests to demonstrate the difference between features.
This time-consuming measurement was later developed into an automated, simultaneous topography and conductance measurement with improvement in scan protocol.20 This protocol was developed on the basis of hopping mode with the same P-SICM instrument setup. A “pause” state was introduced to the scanning when the pipette reached the set point and after retraction of hopping, respectively, where the SICM feedback was turned off temporally and the transmembrane potential was applied across the sample. The resultant potential deflection on the potential electrode was recorded at the same time and processed during the scanning. This automated scan protocol greatly simplifies the conductance measurement in both experiment and postexperiment data analysis. Additionally, the time used for conductance measurement is greatly reduced, which reduced drift and error in manual positioning of the pipette tip. Automated P-SICM also provides higher throughput analysis of the entire sample area.
3.4.4. Differential-Concentration and Biphasic SICM.
Usually, SICM uses the same electrolyte solution for both the pipette and bulk solution. Concentration differences in solutions that fill the pipette and the bulk solution creates a liquid junction potential that generates an interfering ion current. This additional potential can complicate quantitation and analysis. However, in some instances, varying the composition of the electrolyte solution in the pipette and bath can be used as an advantage. For instance, concentration differences between pipette and bulk solution favors charge measurement. When a lower concentration is used inside the pipette, the electric field magnitude near the tip can be reduced by orders of magnitude compared with conventional SICM with symmetric concentration which benefits live cell imaging. Also, the liquid junction potential can be used to drive current flow, which has interesting additional benefits in imaging complex interfacial phenomenon.41 Differential-concentration SICM can be operated in the opposite configuration as well with lower concentration in bulk solution. In this case, the concentration gradient between pipette and bulk solution favors the outward flow of diffusion, which may be used for chemical delivery.23,41 Similar to this configuration, Choi et al. developed a biphasic SICM approach that enables the operation of SICM in electrolyte with extremely low ion concentration, or even in the absence of ions.43 To generate ion current for feedback, a dual barrel pipette was filled with a relatively high concentration electrolyte (typically, 100 mM KCl). The pipette electrode and reference electrode were back-inserted into the pipette barrels and a potential was applied between the electrodes to generate ion current for feedback control. Because the concentration of bulk solution is low, ions diffused from the pipette to the regions near the tip and generate a higher concentration region near the tip. This concentrated region provides a pathway for current to pass through from one pipette barrel to the other. When the tip approaches to the surface, the current initially increases and then decays quickly, which is different from approach curves in conventional SICM. When the tip is at a position relatively far away from the substrate, the approach of the pipette narrows the diffusional space under the pipette and builds up a high concentration region, creating the first region in the approach curve where the ion current increases. When the pipette further approaches to the surface, the access resistance begins to dominate the ion current, resulting in a second region where the current decreases similar to conventional SICM. This special approach curve shape makes the BP-SICM capable of handling both the positive feedback (based on current increase) and negative feedback (based on current decrease). Both of them have their own advantages in scanning. Positive can be used for the measurement of fragile samples because the tip to sample distance is larger compared with conventional SICM. In contrast, negative feedback provides a higher resolution image.
3.5. Hybrid SICM Techniques
Another strategy to expand the functionality of SICM imaging is through hybridized SICM techniques. Several techniques have been proposed including SICM atomic force microscopy (SICM-AFM),21,164 scanning near-field optical microscopy-SICM (SNOM-SICM),165,166 confocal microscopy-SICM,16,17 total internal reflection fluorescence-SICM (TIRF-SICM),18,167 fluorescence resonance energy transfer-SICM (FRET-SICM),168 super-resolution microscopy-SICM,19 scanning electrochemical microscopy-SICM (SECM-SICM),103,104,169–172 patch-clamp-SICM,173,174 and ion channel probe-SICM (ICP-SICM).175 In the following sections, we consider advances in these hybrid SICM techniques.
3.5.1. SICM-AFM.
SICM has been paired with AFM for hybrid SICM-AFM imaging.55,67,176–178 In this technique, electrolyte-filled bent glass micropipettes67 or AFM cantilevers with a hollow microchannel, known commercially as FluidFM probes,55,176,177 serve as the SICM-AFM probes. Exactly as in conventional AFM, a laser deflected off the probe provides feedback in contact or tapping mode, and the SICM portion of the hybrid probe is used for measuring variations in ion transport.67,177 An electrode is back-inserted into the electrolyte-filled SICM-AFM probe and another electrode is placed in the bath electrolyte and a potential is applied between the two electrodes to monitor changes in ion current.55,67,176,177 The first report of SICM-AFM in 199667 was presented as a technique to overcome feedback instability in SICM’s infancy, though improved SICM feedback came about with the development of distance-modulated feedback. Other advantages of hybrid SICM-AFM are the decoupling of ion current measurements from topography67 and the ability to operate this hybrid technique at a low electrolyte concentration, conditions difficult to achieve in conventional SICM because low ion current amplitudes lead to poor feedback.176 In low electrolyte concentration conditions, sample properties such as surface induced ICR become amplified because of the increased thickness of the electrical double layer. In the most well-developed example of SICM-AFM, surface charge mapping was demonstrated on a partial polystyrene film and a partial poly-d-lysine films on glass substrates to demonstrate the amplification of surface induced ICR at low ionic strengths (<10 mM).176
3.5.2. SNOM-SICM.
Scanning near-field optical microscopy (SNOM) is one of the techniques that was first explored for hybridization with SICM165,166,179 because the probe sizes and tip–sample distance of the two techniques are complementary. In SNOM-SICM, the electrolyte-filled nanopipette serves as the light source of SNOM by back-inserting an optical fiber in the pipette179 or by filling the pipette with a fluorescent complex that can be excited by an external laser source.166 The resulting SNOM-SICM probe can be approached to the near-field region above the sample with SICM feedback and the nanopore of the probe can serve as a local light source. This combination allows simultaneous SICM topography and super-resolution SNOM optical images to be collected. Robust feedback control of SICM allows SNOM to operate stably in aqueous solution, an advantage for SNOM especially in surface analysis of biological samples.
3.5.3. Confocal-SICM.
As SICM often uses an inverted optical microscope to assist in positioning the probe and sample, optical microscopy techniques can often be easily implemented with SICM. Confocal microscopy is one of the most straightforward and powerful examples.16,17 In surface scanning confocal microscopy (SSCM, Figure 12a) that combines confocal microscopy and SICM, the sample is imaged by raster scanning the sample stage while the pipette tip and laser focus are coincident on a region of the sample. As the sample scans in the XY-direction, the pipette moves in the Z-direction to keep a constant tip–sample distance, while the confocal setup also records fluorescence from the region under the tip, which allows for the subsequent generation of correlated confocal-SICM images. This combination is amenable to the studies of fluorescence-tagged molecules or proteins (e.g., receptors and ion channels) on a localized region of the cell surface and detailed topographic imaging.180 SSCM has been utilized to study the uptake of viruses or nanoparticles16,181,182 into a cell (Figure 12b) and endocytic pathways and dynamics,95,183,184 thus expanding the applications of SICM in the study of membrane biology.
Figure 12.

(a) Schematic of SSCM. Optical and topographical contouring with an SSCM. The dotted line indicates the position of the optical image of the cell surface obtained in a single scan. (b) Overlay of simultaneously obtained topographic and fluorescence images of fluorescent Cy3-labeled virus-like particles adsorbed to the surface of Cos-7 cells. Reprinted from ref 16. Copyright 2002 United States National Academy of Sciences.
3.5.4. TIRF- and FRET-SICM.
Another optical technique that can be hybridized with SICM is total internal reflection fluorescence (TIRF), which is beneficial for a range of near surface measurements, such as single molecule fluorescence tracking. TIRF-SICM is often used for local delivery where the SICM probe can be used to release molecules or ligands at the localized area of a sample surface by applying hydrostatic pressure or a voltage pulse (Section 4.4.1). The size of the delivery spots can be close to the diffraction limit of light (~100s of nm), and TIRF can be used to further improve resolution. TIRF-SICM has been demonstrated powerful for monitoring intracellular diffusion of single molecules delivered by SICM, and for quantifying local chemical changes with the help of fluorescence probes.18,167
Advantages of local delivery by SICM also can be applied to the combination of SICM and fluorescence resonance energy transfer (FRET) microscopy. FRET-SICM has been applied to investigate the distribution of specific cellular components or nanostructures reacting to the stimulation induced by SICM delivery.168 In FRET-SICM, a topography image of the sample area is first collected with SICM to guide the probe to a desired position for FRET measurement. The probe then releases stimulus in a highly localized fashion to trigger the cellular components (e.g., receptors) leading to the production of signaling molecules. The signaling molecule-specific FRET probe is used to measure their concentration. Hence, the distribution of target cellular components on different cell regions as well as their role in cell signaling process can be depicted. FRET-SICM has now gained extensive applications in studying the locations, dynamics, and functions of different beta-adrenergic receptors on the surface of cardiomyocytes.168,185–189
3.5.5. Super-Resolution Microscopy-SICM.
The lateral resolution of SICM has been reported on the order of the pipette inner opening radius,19 which is comparable to many fluorescence techniques. Recently, significant advances in super-resolution microscopy techniques have provided the next step in high-resolution optical imaging. Super resolution techniques have been incorporated with SICM in several formats. For example, direct stochastic optical reconstruction microscopy (dSTORM) has been used to quantify the number of fluorescent molecules deposited by a SICM tip onto a surface190 or into living cells to label internal structures.191 Stimulated emission depletion (STED) microscopy has also been combined with SICM to allow recording of subdiffraction fluorescence and surface topographic information on the distribution of the cytoskeletal proteins underneath the cell membrane (Figure 13).192 Usually, the combination of SICM and super-resolution microscopy is still performed on separate instruments due to the complexity of building the combined instrument from scratch. However, these aforementioned studies have proved successful image correlations demonstrating that in the near future, simultaneous super-resolution microscopy-SICM analysis will become a powerful tool to study the dynamics of cell surface and protein distribution at diffraction-unlimited resolution.
Figure 13.

Correlative STED and SICM scanning. (a) SICM topography of fixed HeLa cells. (b) Gray-coded height difference of adjacent pixels. Scale bar in (a) applies to the image in (b), too. (c and d) Cropped and rotated (c) confocal and (d) STED images of fluorescently labeled actin in the same region of (a) and (b). Reprinted from ref 192. Copyright 2018 American Chemical Society.
3.5.6. SECM-SICM.
Coupling SICM with scanning electrochemical microscopy (SECM) has provided a powerful advance and natural step in electrochemical imaging. SECM-SICM overcomes some limitations of each technique, namely, SICM lacks chemical specificity and SECM lacks feedback control that can be easily decoupled from the faradaic current signal. Instrument setup is modified for SECM-SICM imaging, compared to conventional SICM, to include electrical contact from the SECM electrode to a current amplifier/potentiostat. Commonly, the sample is grounded or floating while the SECM electrode is biased during image collection,103 although other SECM modes can be used.105 There are two general strategies for SECM-SICM probe fabrication. In the first strategy, a single barrel pipette can be transformed into a SECM-SICM probe by coating the pipette exterior with a conductive coating (i.e., Au,169,171,193 carbon,172 Ti/Pt or Ti/Au170) followed by an insulative coating (i.e., Al2O3,169, parylene C,171,172,193 or electrophoretic paint170), and then the occluded tip is exposed, for instance, by milling with a focused ion beam (Figure 14a, b). In a second strategy, SECM-SICM probes can be fabricated from a dual barrel pipette by filling one barrel with a conductive material (the SECM barrel), such as pyrolytic carbon, while the other barrel (the SICM barrel) is filled with electrolyte solution.103,104 Carbon electrodes are popular in this case, where the SECM barrel is prepared by flowing butane gas through one barrel while the tapered end of the pipette is exposed to an argon environment and heated with a butane torch to form pyrolyzed carbon (Figure 14c). Probe characterization by optical and electron microscopies illustrates the resulting dual barrel SECM-SICM probe following fabrication (Figure 14d, e).
Figure 14.

(a) Schematic for fabrication of SECM-SICM pipette from a single barrel pipette: (I) as-pulled pipette, (II) deposited Ti adhesion layer and gold electrode film, (III) Al2O3 insulative layer, and (IV) focused ion beam milling to expose the Au electrode and tip opening. (b) Electron micrograph of single barrel SECM-SICM probe after milling which shows the tip opening, the crescent shaped Au film, and the insulative exterior coating. Reprinted from ref 169. Copyright 2010 American Chemical Society. (c) Schematic for the fabrication of SECM-SICM pipette from a dual barrel pipette. (d) Optical micrograph of the fabricated SECM-SICM dual barrel pipette. (e) End-on electron micrograph and schematic of the probe where the carbon deposited barrel appears lighter compared to the empty barrel. Reprinted from ref 103. Copyright 2011 John Wiley & Sons, Ltd.
Further SECM-SICM probe modification can be carried out to create pH-sensitive probes.104,194 Probe modification of the SECM portion of the SECM-SICM probe by electrodeposition of iridium oxide194 or electropolymerization of aniline to form polyaniline,104 which are pH-sensitive materials, have allowed for the monitoring of localized pH changes at porous membranes194 and calcite crystals.194 In both cases, the potential difference between the SECM electrode and a reference electrode was recorded during image acquisition, which was then converted into pH values in postexperiment data analysis by using a previously collected calibration curve. Local pH measurement can also be achieved through the incorporation of zwitterion-like membranes into a dual barrel pipette where the current–voltage response of the membrane can be used to differentiate pH differences over the sample surface.195
3.5.7. Patch-Clamp-SICM.
Conventionally, ion channels are usually studied by microscopy-based techniques196–198 and patch-clamp techniques.158,199 Microscopy-based techniques enable the visualization of ion channel distributions in cell membranes by labeling ion channels with specific markers.200 Alternatively, patch-clamp techniques provide a method to study the electrophysiological properties of ion channels by limiting the cell membrane to a small area, the membrane patch formed at the tip of a glass pipette. Both techniques have drawbacks. Immunolabeling can change the intrinsic properties of ion channels. Moreover, microscopy techniques such as electron microscopy or atomic force microscopy may require chemical fixation of cells before imaging, which can alter delicate biological structure. Patch-clamp techniques can demonstrate the existence of specific ion channels on cell membrane but are unable to locate the exact positions of ion channels. SICM techniques can provide a solution to measure localized ion channel response.173 Local ion channel measurement is achieved with two independent pipettes. The first pipette is used to form a whole-cell configuration patch with a cell of interest. The second pipette is used as an SICM probe and scanned across the cell surface to collect a topographic image. The solution inside of the SICM pipette is also loaded with agonists that activate ion channels in the cell membrane when the pipette tip scans over an ion channel in the cell membrane. The current response of the first pipette (attached in whole-cell mode) is recorded as the second pipette scans, and this current is plotted as a function of the position of the second pipette.
High-resolution SICM images can also be used to guide site selection for patch-clamp. This approach to combine SICM and patch-clamp has been dubbed “smart patch-clamp”.174 Smart patch-clamp uses the pipette positioning instrumentation in SICM, which greatly increases the accuracy of tip position. Smart patch-clamp also allows identification of fine features, such as microvilli at cell surfaces or fine dendritic branches of neurons, which can be difficult to visualize in vitro. A trade-off exists between SICM and patch-clamp measurements, as a small tip opening (typically with resistance of 100 MΩ) is beneficial for collecting high-resolution topography images. In contrast, patch-clamp benefits from larger pipettes (typically with resistance of ~10 MΩ) because this size increases the chance to capture an area of membrane with ion channels and favors breakage of the membrane to form the whole-cell configuration. Moreover, if the pipette and patch resistance are of comparable magnitude, the potential across the membrane can be much smaller than the potential that is applied on the electrode, leading to error when collecting the current response of ion channels. This difference in requirements of the SICM tip was solved by first using a sharp pipette to collect a topographic image.201–203 After image collection, the tip was moved over a solid surface, and under the control of z-piezo actuator, advanced toward the surface to break the tip of the pipette and enlarge the tip opening. The tip was then positioned at the area of interest for patch-clamp measurement. This process was found to be quite reproducible and creates a robust route to investigating ion channels by patch-clamp with positional guidance from SICM.
3.5.8. Ion Channel Probe-SICM.
The development of SICM favors the investigations of ion channels in a cell membrane, on the other hand, incorporating ion channels with SICM generates a new platform for selective measurement of specific ions or molecules. Baker and coworkers proposed a method to assemble an ion channel probe (ICP) and demonstrated the possibility of topography measurement. Figure 15a shows the instrument setup of an ICP, where a piece of lipid membrane is formed at the pipette and the ion channels on the membrane are used for measurement.175 In these studies, ICPs were constructed with black lipid membranes (BLMs) and α-hemolysin (α-HL). Briefly, BLMs were formed on the pipette orifice with a tip-dip method.204,205 The pipette was first immersed in bulk solution and lipids were then introduced into the solution near the tip. The pipette was subsequently lifted up and then lowered into the solution again. The formation of BLM can be visualized through a resistance change of the pipette under the applied pulse wave. α-HL channels were added into the bulk solution under a negative potential (vs Ag/AgCl electrode in bulk solution) Similarly, the current drop can be used to monitor the number of α-HLs inserted inside the BLMs. This work demonstrated the possibility of combining ion channels with pipette for topography measurement with ICP. BLMs and α-HL were initially used for the design of ion channel probes because they are easy to fabricate and provide a reliable ion channel response. However, native α-HL is a nonselective ion channel, which limits the chemical response of the ICP. Subsequently, White and coworkers206 utilized a similar ion channel probe design for β-cyclodextrin (βCD) flux measurement. A synthetic porous membrane was used to isolate the bulk solution into two chambers, where the solution in the lower chamber contains additional βCD. The probe was scanned laterally across the pores on the membrane under the control of XY piezoelectric actuator. The increase of ion current in the pipette electrode demonstrated the detection of βCD diffusion from the lower chamber to the top chamber. The development of ICP is not limited to hollow glass pipettes, fine gold needles can be used as the probe as well.207
Figure 15.

(a) Schematic of an ICP with a signal barrel pipette configuration. Reprinted from ref 175. Copyright 2014 American Chemical Society. (b) A double barrel configuration ICP-SICM with the SICM feedback isolated from the ion channel probe measurement. Reprinted from ref 208. Copyright 2016 Royal Society of Chemistry.
Ligand gated ion channels provide an alternate route to develop ICPs, as ligand gated ion channels respond selectively.208,209 Ligand gated ion channels are, however, more difficult to incorporate in BLMs than α-HLs. To use ligand-gated ion channels, as shown in Figure 15b, ICPs were constructed from a dual barrel pipette with an inside-out patch or outside-out membrane patch at one barrel.158 This double barrel pipette design is beneficial for selective chemical mapping as the ICP is isolated from the SICM loop, in which the current change induced by ion channel activities at the ICP barrel does not influence the SICM feedback. With the incorporation of ICP and SICM, the ICP can be positioned at the area of interest for single point measurement or scanned across an area for simultaneous topography and chemical species measurement. The selection of different ion channels provides a choice for different chemical measurements, for example big potassium (BK) channel for calcium ion measurement,208,209 and transient receptor potential vanilloid 1 (TRPV1) channel for capsaicin measurement have been demonstrated.209
4. APPLICATIONS OF SICM
4.1. High-Resolution Topography Scanning
SICM produces three-dimensional topography images with nanometer-scale resolution at scales close to electron microscopy and other scanning probe microscopy techniques, such as AFM. The most significant advantage of SICM as an imaging tool is the nondestructive nature and ability to measure in biological solutions (buffers, media), which make SICM highly beneficial for studies of proteins210 and delicate subcellular features at both living and fixed cells.39,68,211 The development of hopping mode80 has further enabled long-term and real-time scanning of highly complex surfaces with significant changes in topography that are difficult to examine with other imaging techniques. In this respect, SICM has been applied to study subcellular morphology for wide-range of cell types, including but not limited to epithelial and endothelial cells,212–216 cardiomyocytes,217,218 brain cells,219–221 blood cells,222 fibroblasts,223 and stem cells,224 etc. Under special circumstances, features as small as protein complexes have even been observed experimentally.26
Using SICM as a tool to investigate subcellular structures present at the surface of living cells has been one of the most prevalent applications to date. For example, topographical SICM images of cardiomyocytes allow visualization of complex structures, which include Z-grooves associated with the boundary of muscle sarcomeres, cell crests and invaginations representing T-tubule openings.56,225 The derived structural regularity, such as the Z-groove index and T-tubule ratio, is an indicator of changes in surface morphology that result from external disruption or heart failure.6,226 In addition to observation of cell morphology, SICM further enables three-dimensional topographical mapping of the apical cell surface and provides precise information regarding both the cell size and cell height, from which cell volume measurements of a single live cell can be developed.115,227
Multiple studies have compared the performance of SICM to AFM in resolving delicate structures of the samples.21,86,228,229 Most AFM scan modes rely on mechanical force between the cantilever tip and the sample as the feedback for imaging, and thus involve more significant physical interaction between tip and sample, which can cause damage to living cells. Seifert et al. imaged microvilli of both fixed and live epithelial A6 cells with SICM and AFM, respectively.230 As shown in Figure 16, in the AFM image of live cells, although the microvilli could be resolved, obvious morphological distortions that result from the inherent imaging force also existed. After fixation, microvilli became more prominent, and image contrast increased. The average height of microvilli in live samples was significantly lower than the fixed sample, likely due to nonzero imaging forces. In contrast, no obvious difference between SICM images of live and fixed microvilli or evident topographic deformation was observed, as measured microvilli height and width did not change after fixation. Seifert et al. clearly demonstrated that SICM can be advantageous compared to AFM when imaging soft living cell samples, in terms of imaging quality and accuracy. However, image distortion can happen to SICM when the imaging threshold level (set point) is too high.30,231 For example, Nakajima et al. examined the influence of threshold levels (0.6, 0.8, 1.0, and 2.0% decrease) used to image the cilia of epithelium on the trachea, followed by comparison to an SEM image.9 In Figure 17, the effects of threshold are clear, as increases in the threshold level resulted in changes in the morphology of cilia as observed by SICM. Specifically, when the threshold was higher than 0.6% of the steady-state ion current (I∞), cilia appeared thinner than those observed by SEM. This distortion was attributed to the weak hydrostatic force between the tip and the sample under high threshold level (Section 4.5). From this study a general “rule-of-thumb” emerged, that suggested true contact-free measurement and higher accuracy were best achieved at threshold levels under 1%. Although, obviously, the sample, tip, and imaging conditions play a large role in SICM resolution.
Figure 16.

Comparison between AFM and SICM of live and fixed cell imaging (a, AFM first, then SICM; b, SICM first, then AFM) and corresponding measured height and width of microvilli. Reprinted from ref 230. Copyright 2015 American Chemical Society.
Figure 17.

Image quality of SICM in relation to the threshold was investigated on the luminal surface of a ciliated cell in the trachea. In the left image (the threshold of the current decrease was set at 0.6%), the individual cilium was clearly visualized like in the SEM image (in ref 9). The right four images show that the thickness of the cilium is changed depending on the threshold level in SICM images. The line profiles of the portion indicated by red lines show that the thickness of the cilium is apparently thinner in SICM images than in SEM images when the threshold level was bigger than 0.6%. Reprinted from ref 9. Copyright 2018 Elsevier Ltd.
4.2. Surface Characterization
4.2.1. Morphology Analysis.
SICM topographic imaging has also been applied to investigating the surface morphology in nonbiological experiments that include crystal dissolution,232,233 lithium ion battery electrochemistry,45,46 metal–organic frameworks,234 and for electrochemically actuated conducting polymers.235 For example, SICM coupled with optical microscopy was applied to investigate the dissolution kinetics at furosemide crystals by collecting SICM line scans over a crystal to monitor the decrease in crystal height and width during dissolution (Figure 18).232 Finite element modeling supported by experimental data showed that dissolution at the (001) face of furosemide crystals was influenced by surface kinetics, while the (010) and () faces were predominately controlled by mass transport. In a different study, the impact of lithiation on battery electrode materials was investigated by SICM.45 Electrically grounded samples were studied by AC mode scanning where the AC and DC components of the ion current were used for topographical feedback and monitoring localized changes in ionic current, respectively. Prior to lithiation, surface roughness in the topographical image of the as-deposited tin/copper films matched well with the ion current image, indicating that variations in ion current were predominately driven by nanoscale variations in sample thickness (Figure 19a). Following lithiation, local areas on the sample displayed an increase in topography (Figure 19b) likely from the decomposition of the Li-containing electrolyte at the tin/copper film surface.236 Closer examination of the sample after lithiation revealed an increase in current at a tall topographical feature and a drop in current around the peripheral regions (green line in Figure 19b and line profile in Figure 19c). The decreased current around the periphery of the feature was attributed to solid electrolyte interphase (SEI) formation, which obstructs the flow of ions to the underlying tin/copper film while inducing a higher rate of lithiation at the protruding area. The yellow line in Figure 19b and the corresponding line profile in Figure 19d demonstrate that tall features in the topographical map sometimes correspond to decreased current. Specifically, the feature highlighted by the black arrow (Figure 19d) showed a similar topographic height to other features in this line profile, but the ion current magnitude was comparable to the background regions. This suggests that SEI film can block current flow in the tin electrode.
Figure 18.

(a) Optical micrographs for the dissolution of a furosemide crystal recorded at different time points. (b) SICM line scans recorded at 4 (■), 10 (●), 15 (◆), 20 (*), 23 (★), and 26 (×) minutes after the beginning of dissolution. Reprinted from ref 232. Copyright 2016 American Chemical Society.
Figure 19.

SICM topographical (left) and DC current images (right) of a glass substrate coated with thin films of copper then tin before (a) and after (b) 24 μAh·cm−2 lithiation. Line scan profiles for the green (c) and yellow (d) lines in (b). Reprinted from ref 45. Copyright 2011 John Wiley & Sons, Ltd.
4.2.2. Surface Charge.
SICM is highly sensitivity to variations in the local ionic environment at the tip–sample interface, where the surface charge properties of the material may be a contributing factor (see Section 3.4.2 for details about SICM instrumentation and scanning protocols for surface charge mapping). One method for measuring the surface charge involves collecting current–voltage measurements close to a sample surface and quantifying the charge by reporting the ion current rectification. Previously, ion current rectification measurements were applied to study Li+ transport through nanoconstrictions within a membrane in a polycarbonate solvent, an environment similar to traditional battery experiments.47 Localized sample sites of higher surface charge can also be measured in SICM imaging. For example, correlation between surface charge and catalytic activity was obtained for carbon catalysts after the introduction of surface defects.237 Highly oriented pyrolytic graphite (HOPG) was exposed to plasma irradiation for varying lengths of time to induce surface defects and the localized surface charge was monitored by SICM. Following plasma irradiation, SICM topography of the HOPG showed larger topographical features, which were attributed to defect sites showing larger surface charge, compared to pristine HOPG. In another study, changes in feature height on TiO2 nanotubes were attributed to local sites that had higher surface charge and higher photocatalytic activity.151 Further development of SICM instrumentation has introduced scanning protocols where surface charge mapping can be decoupled from topography. Chemically modified surfaces have been the sample of choice for demonstrating simultaneous topography and surface charge mapping by the following variations of SICM: distance-modulated SICM where the AC phase is sensitive to surface-induced rectification,66 bias-modulated SICM,65 fast pulsed-potential SICM,145 and a differential SICM protocol where current–voltage curves were measured close to and far from the surface of interest.148 In an interesting application, the surface charge and topography of untreated, bleached, and conditioner treated human hair was visualized by SICM.147 In hair samples treated with bleach, damage to the hair resulted in local sites of highly negative surface charge density. Following conditioner treatment of the bleach haired, a more positive, homogeneous surface charge density was recorded, indicating that the conditioner could temporarily alter the surface charge of the bleached hair.
Surface charge of living biological samples has also been investigated by SICM. For example, Perry et al. utilized bias-modulated SICM to simultaneously acquire topography and surface charge maps of human adipocyte cells,64 whose functional role is the storage and regulation of lipids in mammalian systems. This measurement was based on the influence of surface charge on the DC current of the SICM probe when in proximity to the sample as well as the phase shift of AC components, which provides higher sensitivity. Figure 20 shows surface charge maps of adipocyte cells under physiological conditions in the form of DC current images and AC phase shift data with positive and negative tip bias, respectively. There is a clear contrast between the positively charged collagen substrate and the cell body. An interesting feature of the cell is a linear charge region along its length (Figure 20d and g), which is evidenced at both tip polarities, but has a smaller contrast at negative bias. This charge region could also be correlated to the topography feature, which appeared as a “valley” apparent from the line profile across the cell presented in Figure 20e. This region is characterized by high positive charge and might pinpoint the location of key proteins in the cell membrane, which are considered to mediate fatty acid uptake and other functions.
Figure 20.

Bias-modulated SICM imaging of part of an adipocyte cell on a collagen support under physiological conditions. (a) Optical microscope image of the spindle-shaped cell with the bias-modulated SICM scan region indicated by white dashed lines. (b) Topographical map containing 26 × 26 pixels and corresponding normalized (with respect to bulk responses) DC ion current images at (c) negative (−0.4 V) and (d) positive (0.4 V) tip biases. (e) Line profile along the black dotted line in (b) shows the change in topography across the cell and reveals a trough feature in the cell surface morphology. AC phase data at (f) −0.4 V and (g) 0.4 V reveal a strong contrast between the cell and collagen support. Reprinted from ref 64. Copyright 2016 American Chemical Society.
4.3. Cell Dynamics Studies
Since inception, continuous improvements have greatly elevated the robustness of feedback control, temporal resolution, and artifact prevention in SICM. These improvements make SICM a powerful tool to observe the dynamics of various cellular processes taking place at the cell surface, through repetitive scanning of a specific area of the cell sample over time. A variety of processes have been investigated, such as membrane dynamics,17,238–242 stimulus-induced cell morphology changes,22,243–247 cell swelling,248 microvilli movement,87,249–251 particle-cell membrane interactions,16,96,108,182,252–257 exocytosis,258 endocytosis,95,184 and apoptosis.259,260
One of the main focuses for SICM research for studying cell dynamics is recording time-lapse images of the nanostructures on the cell surface. For example, Shevchuk et al. studied the mechanism of clathrin-coated pit closure, an ending step of clathrin-mediated endocytosis, in Cos-7 cells by monitoring the topography change of pits and simultaneous fluorescence imaging of pit closure-associated proteins.95 They found that 70% of pits closed with the formation of a protrusion (cap) that grew on one side of the pit which then covered the entire pit and disappeared, as demonstrated in SICM time-lapse images (Figure 21a). Fluorescence images demonstrated that these protrusions were associated with fluorescent signals of clathrin and actin-binding protein (Figure 21b). In addition, both the rate of pit formation and cap formation can be acquired by SICM imaging. This finding provided direct observation of key topographical changes during the entire life cycle of individual clathrin-coated pits, confirmed by simultaneous fluorescence measurements, and contrasted with the conventional understanding of how pits closed and cleaved from flat membrane sheets. The study opens an alternative mechanism for pit closure.
Figure 21.

(a) SICM topographical images showing a cap formation process. The red circles indicate membrane protrusions associated with clathrin-coated pits. (b) Time-lapse topographical and fluorescent confocal image pairs showing pit formation, growth, steady-state, and closure. The formation of a protrusion seen in the topographical image occurs right before pit closure and disappearance of the clathrin light chain (Clc)-EGFP fluorescence (red circles). Reprinted from ref 95. Copyright 2012 Rockefeller University Press.
In addition to internal cellular processes, the interaction between external objects (e.g., particles, microcapsules) and the cell membrane is also a topic widely investigated by SICM. Targeted delivery of these types of substances into cells by cell engulfment is a promising strategy for nanomedicine and nanobiosensors261,262 and therefore necessary to fully understand the mechanism of uptake of these objects by living cells. For example, Chen et al. investigated the topography simultaneously with local elastic modulus of A549 alveolar epithelial cells throughout the whole course of microcapsule internalization.257 As shown in Figure 22, a full life cycle of cell engulfment can be visualized. The cell membrane first created fine, finger-like protrusions concentrating on the bottom of the capsule, and then some of these protrusions gradually restructured into membrane ruffles, followed by thin layers of membrane extending over the top of the capsule. Failure of the restructuring of the finger-like membrane protrusions into membrane ruffles will lead to a “stalled” internalization. Measurements of mechanical properties also revealed that the modulus of large protrusions in the vicinity of the capsule was apparently higher than normal membrane, suggesting higher density of actin inside protrusions. As the membrane extended over the capsule, the roughness decreased, indicating restructuring of the underlying actin-myosin skeleton from finger-like protrusions into thin membrane layers.
Figure 22.
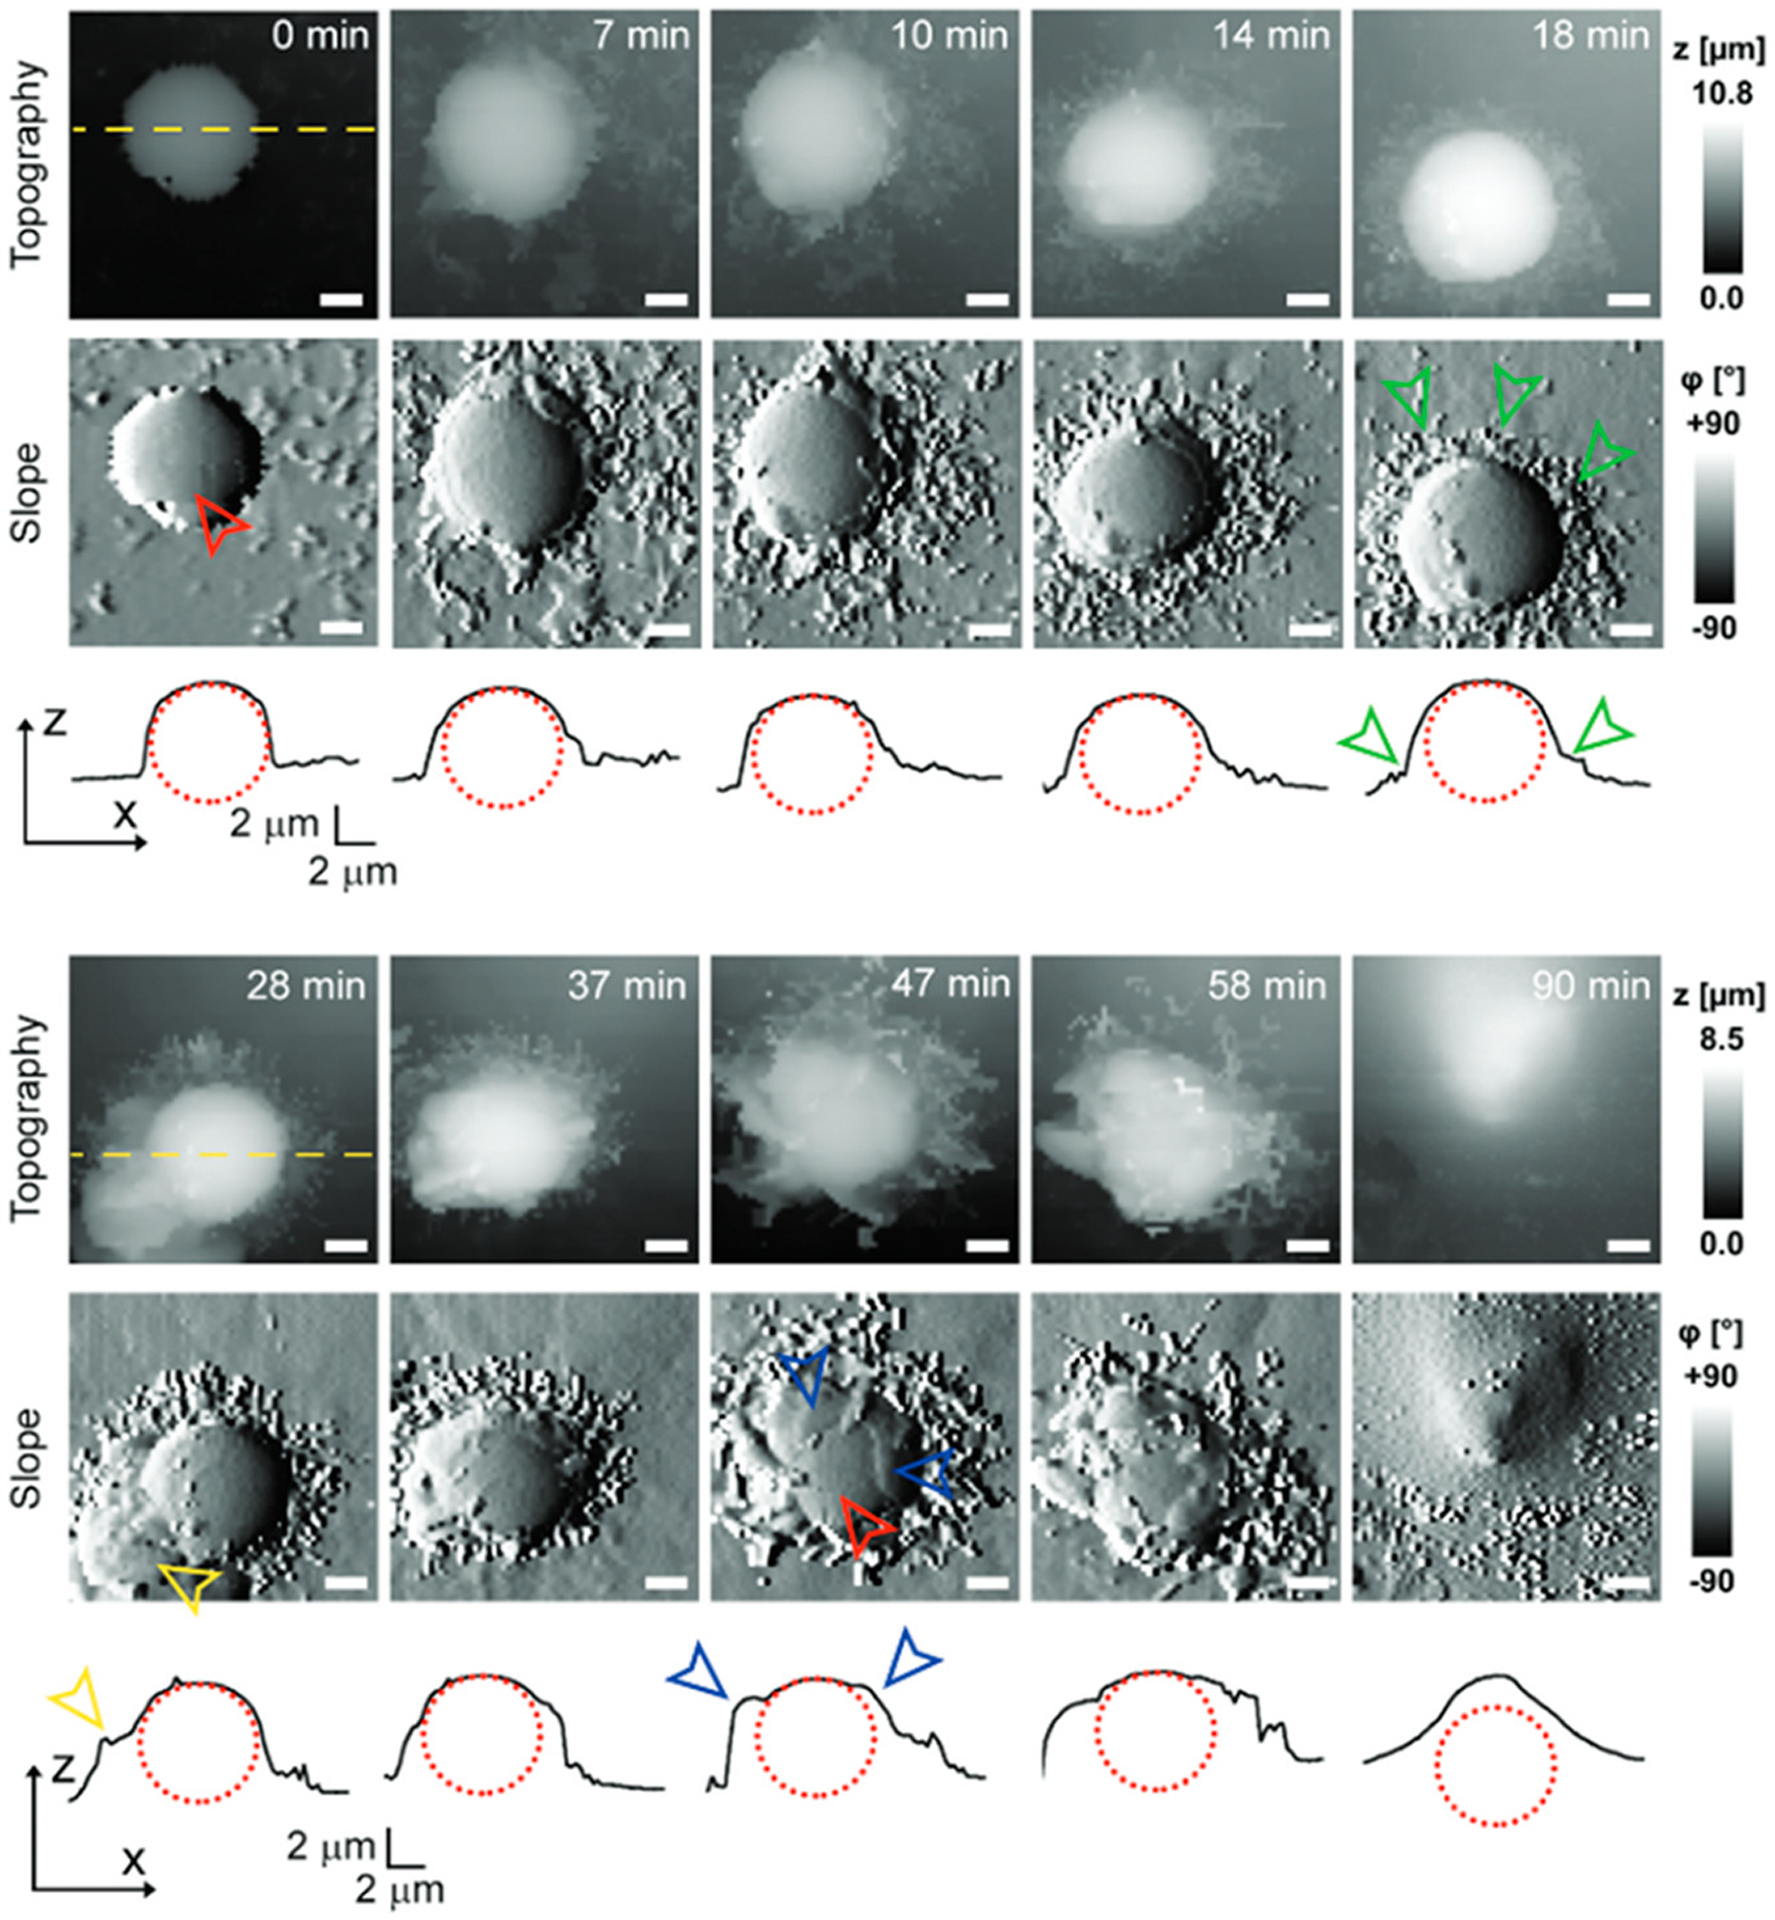
Representative internalization of the polyelectrolyte capsule displaying distinct extracellular engulfment. Time lapse imaging of topography is shown together with the corresponding slope images (first derivative of topography) and line profiles (black curves) across the center of the capsule as indicated by the yellow dashed lines. The time 0 min marks the beginning of the recording; the exact time when the capsule landed on the cell is uncertain. The red dotted circles represent the capsule. Note how the bare capsule (red arrowhead) is gradually surrounded by fine finger-like protrusions (green arrowheads) at the bottom of the capsule, later morphing into larger membrane protrusions (yellow arrowhead), and finally how the top of the capsule gets gradually covered by thin layers of the membrane (blue arrowheads). All scale bars: 2 μm. Reprinted from ref 257. Copyright 2018 Royal Society of Chemistry.
Traditional SICM instruments typically require several minutes, at minimum, to take a cell-sized topography image with decent resolution, which causes SICM to suffer from low temporal resolution. As a result, observation of fast cell dynamics is mostly still carried out with optical microscopy. However, recent development of high-speed SICM (see Section 3.2.1) started to change this situation by cutting down the imaging time to less than tens of seconds per frame. Recording fast nanoscale height and volume changes of small subcellular structures has thus been made possible. For example, Takahashi et al. reported using high-speed SICM to visualize nanoscale dynamic structural changes in hippocampal neurons, which is a great challenge for other scanning probe microscopy techniques due to their steep vertical slope.99 High scanning speed was achieved by developing a scanning algorithm, which allows for the selection of the next imaging region by predicting the location of a cell from a previous image. With this setup, fast neuron activities such as cargo transport in the dendrites (Figure 23a), the formation of dendritic spines and synaptic networks (Figure 23b), and changes in the growth cones of neurons can be observed by time-lapse imaging. Simeonov et al. described a high-speed SICM configuration including ultrafast scanners with maximum scan range of 21 × 21 μm (in XY-direction) and 5 μm (in z-direction).94 By combining this configuration with a “turn step” procedure that significantly reduced the vertical overshoot distance, they were able to record topography images at an approach rate of 11.0 kHz and imaging time as low as 0.6 s per frame. Rapid dynamics of the periphery of living human platelets, including morphological changes, along the platelet edge such as protrusion formation and movement could be clearly interpreted. With increases in scanning speed offered by continuous instrument developments, SICM will evolve to more challenging arenas, such as ultrafast morphodynamics of living cells.
Figure 23.

(a) Fast speed SICM time-lapse images of cargo transport (red arrows) in the dendrites of a hippocampal neuron. (b) SICM topographic images of dendritic spine and synaptic network formation. White arrows indicate protrusions from dendrites that appeared to be dendritic spines. Around the synaptic bouton or varicosity, dynamic reassembly of actin filaments and actin wave-like propagation were observed (red arrows). Reprinted from ref 99. Copyright 2020 American Chemical Society.
4.4. Nanopipette Delivery/Extraction
4.4.1. Local Chemical Delivery.
A unique property inherent to the pipette probe used in SICM is that external substances can be delivered via the pipette filling solution with minimal disturbance on scanning performance. Because a typical SICM pipette tip usually has an inner radius of several tens of nanometers, and its position related to the sample can be accurately controlled both vertically and laterally via SICM feedback and automated piezo positioning, the pipette can be used as a local reservoir to deliver chemicals to a specific nanoscale domain at a sample. Such nanodelivery systems have also been used to pattern nano features on surfaces (see Section 4.4.2).
One common approach for local delivery is by applying a high potential at the pipette electrode, which creates an enhanced electric field for delivering contents from the pipette to area in the vicinity of the tip. Delivery from the tip depends on the combination of electroosmotic flow and electrophoresis, determined by the size, charge, and polarizability of the cargo delivered.40 This approach was first developed to deposit biomolecules, such as DNA and antibodies, onto a surface for submicron lithography.40,263,264 Later, this technique was supplemented with additional functionalities, such as creating attoliter-size water droplets, miniature chemical reactions and bioassays, and controlled manipulation of the local environment at the tip.44,167 Bruckbauer et al. applied voltage-driven delivery to cellular counterparts where wheat germ agglutinin conjugated with fluorescent dyes was delivered into different regions of sperm cells, which allowed tracking the diffusion of individual membrane glycoproteins. Diffusion coefficients at measured regions could be successfully calculated and differentiated.18 Additionally, SICM local delivery can be used to trigger the cell response to specific external ions or biomolecules (e.g., agonists),180,265 and conduct single-cell electroporation.266 For example, Klenerman and coworkers demonstrated the targeted delivery or depletion of reagents to induce chemical changes at a surface by SICM.167 In this report, pulsed voltage-driven delivery of sodium ions were released to induce rotation of the sodium-sensitive flagellar motor in single Escherichia coli chimera.167 Rotation was monitored by attaching a bead to the flagellum and monitoring the rotation of the bead by optical microscopy (Figure 24a).
Figure 24.

(a) SICM schematic diagram for the triggered rotation of the flagellar motor with sodium-driven release from the nanopipette. (b) Control of flagellar motor speed by quantitative pulsing of sodium from a nanopipette by repeated cycles for the release of 5 mM Na+ for 2 s then 36 mM Na+ for 4 s. Reprinted from ref 167. Copyright 2008 American Chemical Society.
The stators became inactive under low sodium conditions and reversibly became active again once higher concentrations of sodium were delivered from the SICM probe (Figure 24b). Besides delivery at cell surfaces, Seger et al. later developed a nanoinjection system where the pipette penetrated into the cell for voltage-controlled delivery, with very little mechanical disruption to the cell.267 This allows unique intracellular staining with fluorescent probes to observe biomolecules and organelles within a living cell (Figure 25).191 Moreover, single nanoparticles can also be delivered by an applied voltage through the SICM probe and the process of nanoparticles exiting the probe can be precisely monitored and controlled by resistive pore sensing.54,268 Another application of delivery by SICM was shown by Unwin and coworkers for the pulsed delivery and simultaneous topographical and activity mapping with reduction of Ru(NH3)63+ and oxidation of dopamine at a carbon fiber UME.146
Figure 25.

(a) Principles of nanoinjection. Prior to nanoinjection, the ion current between the electrode in the pipette and the reference electrode placed in the bath is tracked as the pipette approaches the cellular plasma membrane. Once approached inside the cell, increasing or reversing the voltage leads to diffusion of the cargo molecules out of the nanopipette into the cell by electrophoretic forces. (b and c) Super-resolution imaging of nanoinjection-based labeling of actin filaments. (b) Representative wide-field fluorescence image of the actin cytoskeleton in living U2OS cells, taken immediately after nanoinjection of ATTO 655–phalloidin at a concentration of 10−5 M inside the pipette. (c) dSTORM image of the actin structure of the living U2OS cell shown in (b). The dSTORM image of the actin structure demonstrates a moderately increased spatial resolution. Scale bars: 5 μm. Reprinted from ref 191. Copyright 2015 American Chemical Society.
SICM local delivery can also be conducted by applying a hydrostatic pressure to drive solution out of the probe,269 allowing delivery for molecules unaffected by the electric field (e.g., uncharged molecules). An important application of hydrostatic driven delivery, is determining the location and function of receptors on the cell membrane, where the pipette can be used to deliver agonist solution to stimulate the receptors at specific cellular structures, and the resulting production of second messenger signaling molecules are measured by a FRET probe. Nikolaev et al. first utilized FRET-SICM to investigate β1- and β2-adrenergic receptors (βARs) on the surface of rat cardiomyocytes (Figure 26).168 Previous studies indicated that β2ARs are exclusively located in the T-tubule region of cardiomyocytes while β1ARs are distributed evenly on the entire cell surface. Moreover, in cells derived from models with chronic heart failure, β2ARs are redistributed to the cell crust which leads to alternation of receptor-mediated cyclic adenosine mono-phosphate (cAMP) signaling and furthers the myocardial phenotype. Following FRET-SICM studies have then identified external factors influencing the β2AR distribution and β2AR-cAMP signaling such as caveolin-3,186 T-tubule remodeling,270 and partial mechanical unloading of the heart.188 Other receptors of the cardiomyocytes such as β3ARs189 and natriuretic peptide receptors (NPRs)187 as well as their corresponding molecule signaling have also been investigated.
Figure 26.

Schematic of FRET-SICM studying β2-adrenergic receptors (β2ARs) on the surface of cardiomyocytes. SICM probe released stimulus to trigger β2ARs resulting in release of signaling molecule cAMP, which can be detected by FRET probe. Reprinted from ref 168. Copyright 2010 American Association for the Advancement of Science.
4.4.2. Nanoscale Sample Deposition.
As mentioned in Section 4.4.1, another application of SICM nanodelivery is localized deposition and patterning at surfaces. SICM reports include localized electrodeposition of metals,271–274 and patterning of both biomolecules40,263 and artificial membranes.275 Early work for the electrodeposition of metals from ionic precursors by SICM focused on the deposition of planar Cu structures onto a surface.271,272 A dual barrel SICM probe, where one barrel served as the Cu precursor source and the other barrel was used for ion current feedback, provided a key advantage of positional feedback during deposition to control the patterning of three-dimensional Cu structures (Figure 27a).276 By decoupling the deposition of Cu from ion conductance current feedback, a constant probe-to-surface distance was maintained that resulted in the retraction of the pipette as the Cu pillar grew (Figure 27b). Further, by displacing the probe laterally during Cu pillar growth, zigzag (Figure 27c) and Γ-shaped features could be formed (Figure 27d).
Figure 27.

(a) SICM schematic diagram for the electrodeposition of Cu features. Electron micrographs of (b) Cu pillars, (c) zigzag, and (d) Γ-shaped following electrodeposition by SICM. Reprinted from ref 276. Copyright 2016 American Chemical Society.
There are also several reports of the deposition of metals and polymers on surfaces by scanning droplet probe microscopies using a scanning ion conductance microscope.33,34,190,277 In these reports, the experimental design was modified, compared to conventional SICM, by (1) removing the bath electrolyte and operating the deposition from the probe tip in an air environment and (2) applying a potential bias and measuring current between an electrode back-inserted into the pipette and the conductive sample surface. Another variation of SICM involves dual barrel pipettes in which two species are independently released from the probe tip to enable voltage-driven and deposition time-dependent delivery.264 In one of the first, and still most elegant examples, Klenerman and coworkers demonstrated the deposition of two types of biomolecules264 to a surface as well as the controlled deposition of water droplets and addition of reagents to existing droplets on surfaces with dual barrel pipettes.44
4.4.3. Subcellular Extraction and Nanobiopsy.
In addition to reports that utilize SICM to perform local delivery or nanoinjection to stimulate the cells, several more recent studies used SICM in a reverse manner, i.e. to extract a minute amount of cell contents from a living cell in high spatial resolution and analyze the biomolecules (e.g., glucose and RNAs) inside.278–280 In these experiments, termed “nanobiopsies”, the SICM pipette is first brought close to the cell surface under feedback control and then approached a fixed distance (typically 1 μm) to pierce the cell and reach the intracellular environment. The probe is paused for extracting cell contents and retracted to transfer these contents for subsequent analysis. With small SICM probes and the precise probe control SICM offers, minimal cell damage is caused, allowing the possibility of repeating experiments and dynamic studies.
The efficiency of the nanobiopsy technique is enabled by the ability to extract and hold a sufficient amount of cell contents within the probe. Building on reports from Mirkin and coworkers,281 Actis et al. utilized SICM nanopipettes as an electrochemical syringe via electrowetting.278,281 Briefly, the pipette was filled with organic electrolyte solution, and when the probe was immersed in an aqueous bath solution, a liquid–liquid interface was formed at the tip opening. If a voltage was applied across this interface, a force would be generated that drives the aqueous solution into or out of the nanopipette. As the pipette was inserted into the cell cytoplasm, the pipette bias was switched to −0.5 V for 5 s resulting in a controlled flux of cytoplasm into the pipette, followed by a switch to +0.1 V stopping the influx as well as preventing the efflux of desired contents. In this study, they were able to not only perform total RNA analysis of a single cell via qPCR techniques, but also isolate and extract the contents of different mitochondria from single cells and quantify mutant mitochondrial genomes in those single cells with high-throughput DNA/RNA sequencing technology.278
The same group later continued to apply the SICM nanobiopsy platform to extract samples from localized regions, the cell body and neurites, from a single neuron and analyzed the mRNA pool by multiplex RNA sequencing,279 from which they found 2011 genes present in all nanobiopsy samples. They utilized a self-organizing map (SOM) to analyze these high dimensional data onto which these 2011 genes were mapped (Figure 28), where each hexagon represents a set of genes whose expression patterns are most similar to one another. These units are clustered and located in the same positions across all nanobiopsy components of the SOM. Thus, spatial proximity corresponds to expression pattern similarity in the SOMs. Neuronal cell bodies showed enrichment for transcripts encoding proteins involved in transcriptional regulation and protein transport, whereas neurites were enriched in genes related to protein synthesis, protein targeting to the endoplasmic reticulum (ER), and mRNA metabolism. A new set of mRNAs that specifically localize to neurites, was also reported.
Figure 28.

(a) Schematic of a single cell nanobiopsy. Illustration of the automated approach to the cell surface, penetration in the cell cytosol, followed by controlled aspiration of cytoplasmic materials by electrowetting. (b) Schematic illustration of nanobiopsy sampling from neurons and RNA-seq analysis using the SOM. Briefly, the 1000 genes with the greatest variance among the libraries were used for training a self-organizing map, where each hexagon represents a group of genes whose expression patterns across samples are most similar. These units are clustered and are located in the same positions across all nanobiopsy components of the SOM. Thus, in this 2D heat map, spatial proximity corresponds to expression pattern similarity. Each nanobiopsy transcriptome can be visualized as a component of SOM, by thus mapping the genes expressed onto the SOM. Four representative nanobiopsy transcriptome SOM components are shown for each subcellular compartment. Reprinted from ref 279. Copyright 2018 American Society for Biochemistry and Molecular Biology.
Nashimoto et al. combined nanobiopsy with topography information by using a double-barrel nanopipette, with one barrel filled with aqueous solution for SICM scanning and the second barrel filled with organic solution for sample extraction.280 Topographic control provided by SICM was used to guide the tip to targeted positions, minimizing inaccuracy from manual movement. This study successfully detected local differences in Actb mRNA expression levels in single mouse fibroblast cells.
Another method to extract the cell contents in a more molecule specific manner is by modification of the nanopipette with addition of biosensors on the surface of its inner wall. For example, Nascimento et al. immobilized glucose oxidase (GOx) covalently at the pipette tip to realize a glucose nanosensor.282 In single-cell measurements, they discovered that the glucose levels of cancer cells were significantly higher than nonmalignant cells.
To sum up, nanobiopsy SICM is still a developing technique with many potential future applications. The studies reviewed above provide the basis for less invasive single-cell analysis and more accurate monitoring of disease progression. Such studies can further elucidate the role of heterogeneity in primary tumor tissues and systemically identify critical parameters in disease progression and potential meta-static states.278
4.5. Cell Stimulation and Nanomechanics
Living cells are known to sense and respond to external stimuli and mechanical stress.283 Understanding the underlying biology that leads to and results from such processes are critical. For SICM, in addition to delivery of molecules, the pipette can be used to exert mechanical force on the cells, which can further lead to deformation of the cell membrane. Such approaches have been used to stimulate cells via activating their mechanosensitive regions.284,285 Mechanical stimuli can be applied through either a “contact mode” or a “noncontact mode”. In “noncontact mode,” a positive/negative pressure is applied inside the pipette and the pipette is subsequently approached to the surface. Under the applied pressure, solution flows out from/into the pipette and forms a strong hydrostatic pressure near the tip. This pressure interacts with the cell membrane and induces the deformation of the cell without the direct contact between the pipette and cell membrane. For “contact mode”, the pipette is continuously approached to the cell surface until the tip touches and depresses the membrane. Although the mechanical stimuli can also be applied through magnetic force,286 pressure,287,288 or streams of solution,289,290 SICM offers more precise control of the applied force on the cell membrane. The noninvasive characteristic of SICM further allows repetitive mechanical stimulations of a specific cellular region without introducing any damage. For example, Sánchez et al. first used SICM to stimulate dorsal root ganglion (DRG) sensory neurons and found elevated intracellular [Ca2+] which propagated along the neurite from the point of stimulation.291 Jönsson et al. developed a hydrodynamic trap of molecules in a supported lipid bilayer (SLB) which has promising applications.292 As shown in Figure 29a, the nanopipette was first approached to SLB surface by SICM until the tip–sample distance was approximately one tip radius. Negative pressure was then applied on the probe, leading to the suction which drew the surrounding solution into the probe. This further resulted in a liquid flow dragging the molecules protruding from the SLB surface toward area below the tip, causing them to accumulate and become trapped. The trap had been tested successful for the case of the streptavidin (Figure 29b), and the hydrodynamic force exerted and kinetics were examined. Besides applying mechanical pressure to the membrane, the stimulation of cells by SICM can also be performed by contacting the membrane physically with the pipette probe containing molecules triggering the cellular process of the membrane, which make the stimulation more selective and controllable as demonstrated in the several studies by Butler and coworkers.293,294
Figure 29.

(a) Schematic of the hydrodynamic trap. The pipette is positioned approximately one tip radius above a supported lipid bilayer (left). The application of negative pressure to the upper opening of the pipette causes suction at the pipette tip drawing liquid into it (center). Resulting viscous drag forces move molecules protruding from the bilayer toward the area below the tip, where they accumulate and become trapped (right). (b) Trapping of fluorescently labeled SA. Images show the fluorescence intensity from streptavidin bound to an SLB at different times. The hydrodynamic trap was turned on at t = 56 s and off at t = 153 s. Reprinted from ref 292. Copyright 2012 United States National Academy of Sciences.
SICM in pressurized mode has also opened new possibilities for nanomechanical investigations,295 including a variety of applications in measurement of the mechanical properties of cell surfaces.296–301 Detailed principles of mechanical measurement and instrumental development can be found in Section 3.4.1. For example, Rheinlaender et al. quantified the viscoelastic behavior of the cells by measuring creep compliance (the deformation response to a constant loading force.137 Three simultaneous maps of topography, stiffness, and fluidity were obtained in real time. Figure 30 shows these maps of fibroblast cells under the disruption introduced by addition of cytochalasin D. A strong subcellular correlation between the local stiffness and fluidity could be observed: stiff regions exhibit lower fluidity while soft regions exhibit higher fluidity.
Figure 30.

Subcellular correlation between stiffness and fluidity across an individual living cell during cytoskeleton disruption and recovery. (a) Selected topography images (first column), maps of stiffness E0 (second column), and fluidity β (third column). (b) Time traces of average stiffness E0 (squares) and fluidity β (circles) of the living fibroblast cell during addition and washout of 2 μM cytochalasin D. Scale bars: 20 μm. Reprinted from ref 137. Copyright 2019 Royal Society of Chemistry.
The noncontact nature has been long be touted as an advantage of SICM. However, later studies demonstrated the pipette could exert a weak mechanical force even without external pressure, and the force can become more prominent at increased imaging thresholds (set points). Pellegrino et al. discovered that the force could be utilized to remodel the morphology of neuronal growth cones or direct neurons in designed networks.164,302 Clarke et al. later attributed this force to the internal repulsion between glass pipette and cell membrane.142 Based on this phenomenon, the same group developed an innovative route to mapping sample stiffness without applying pressure on the pipette, which greatly improved the spatial resolution of the measurement.303
4.6. High-Resolution Patch-Clamp
Ion channels and receptors are located heterogeneously on the cell membrane, thus realizing the regional specialization within a cell which further leads to localized function at different areas. SICM has been used to study the distribution of ion channels and receptors at high spatial resolution in combination with patch-clamp techniques.
Korchev et al. first mapped the distribution of single active ATP-regulated K+ channels (KATP channels) in cardiac myocytes.173 They used whole-cell voltage clamp to monitor the K+ current flowing into the cell while the SICM pipette filled with K+ (as stimulus) was scanned over the cell surface. The resultant K+ current map was superimposed with SICM topography image, revealing that KATP channels have low lateral mobility and channel positions are found in the Z-grooves of sarcolemma that strongly interact with the intracellular cytoskeleton (Figure 31). Later, the smart patch-clamp technique was developed by Gorelik et al.174 where the topography map acquired by SICM was used to precisely position the same pipette at a specific nanodomain of the cell membrane at scales inaccessible to conventional patch-clamp methods. For example, the activity of the L-type Ca2+ channel was monitored at different locations on a cardiomyocyte surface such as the T-tubule, crest and Z-groove with the help of SICM. This study showed that L-type Ca2+ channels are predominantly located at T-tubules where they are near other proteins involved in excitation-contraction coupling.285 The distribution and function of other channels such as Cl− channels, maxi-anion channels, Na+ channels and subpopulations of L-type Ca2+ channels in cardiomyocytes were also evaluated in later studies.201,203,304–308
Figure 31.

(a) Schematic of the sensing mechanism of the combined SICM/patch-clamp for functional localization of single ion channels in intact cell membranes. (b) Combined SICM topographic image of a cardiomyocyte and a map of the K+ current, showing that the KATP channels occur in the parallel grooves (z grooves) of the sarcolemma. (c) The same imaging area as (b), showing only the ion channel activity. Note that activity varies between different clusters of ion channels. Reprinted from ref 173. Copyright 2000 Nature Research.
Additionally, the smart patch-clamp technique has been applied to study cell types beyond cardiomyocytes. Gorelik et al. demonstrated morphology changes of epithelial A6 cells, as well as the activity of their ENaC channels under the stimulation of aldosterone.309 They proposed that the addition of aldosterone stimulates the release of ATP which signals P2 purinergic receptors resulting in the regulation of sodium channels. The receptor was then identified as ionotropic P2X4-like receptors located at the basolateral membrane.310 Yang et al. also investigated the morphological and functional changes of PC12 cells during neuronal differentiation by SICM imaging and whole-cell recording of tetrodotoxin sensitive Na+ channels.311
An important advantage of the smart patch-clamp technique is the improvement in success rate of patching small cells (e.g., sperm cells), subcellular structures (e.g., microvilli and cilia312) and opaque samples.174 Thus, applications have recently been extended to more sophisticated cells such as neurons. Direct K+, Na+, Cl−, and Ca2+ channel recording of the presynaptic bouton was made possible in all four patch-clamp configurations.202 Vivekananda et al. placed two patch-clamp pipettes on the soma and presynaptic bouton respectively from a single axon, allowing simultaneous somatic and presynaptic recordings of action potential train (Figure 32).313 This study revealed the role of Kv1.1 channel in the broadening of presynaptic spikes that result from the action potential.
Figure 32.

Dual recordings from the soma and small presynaptic bouton of the same neuron. (a) Transmitted light image of a neuron with somatic patch pipette with a neighboring 6 × 6 μm region selected for smart patch-clamp indicated with the square. (b, Left) Schematics indicating smart patch-clamp in voltage-clamp mode (Top) and whole-cell recording from presynaptic bouton (Bottom). (Right) Height-coded SICM image corresponding to highlighted area in (a), showing bouton (arrow) supplied by an axon adjacent to a dendrite. (c) Simultaneous somatic and presynaptic recordings of action potential train elicited by somatic current injection from the same cell as in (a). Reprinted from ref 313. Copyright 2017 United States National Academy of Sciences.
4.7. Electrochemistry Applications
Hybrid SECM-SICM imaging is the most common SICM platform to investigate topography and electrochemical activity of a sample. Previously, single barrel SECM-SICM probes were applied to monitor permeability of a redox mediator through a Nafion membrane exposed to oxidative degradation with Fenton’s reagent.193 An increased faradaic current response corresponding to surface defects present in the SICM topographical image as a function of longer degradation periods was observed.193 Dual barrel SECM-SICM probes have been used to collect topographical and electrochemical activity maps at nanoparticles105–107 and for measuring localized corrosion sites on aluminum.314 For example, O’Connell and coworkers used SECM-SICM probes, where the carbon SECM electrode was modified by the electrodeposition of platinum, to image the activity of Au nanoparticle (NP) ensembles for the electro-reduction of oxygen to hydrogen peroxide.106 The Au NP sample was biased during imaging to generate hydrogen peroxide while the platinized carbon SECM electrode was biased to reduce the generated hydrogen peroxide in a substrate generation-tip collection format. The electrocatalytic activity images revealed higher current at the Au NPs as the potential applied to the substrate was decreased from 0.9 to 0.4 V vs RHE (Figure 33). When substrate potentials less than 0.5 V vs RHE were applied, higher background currents were recorded because of overlapping diffusion profiles from neighboring NPs and from hydrogen peroxide generation at the NP ensemble as a whole.106 Overall, this report demonstrated a step toward measuring the electrocatalytic activity at single nanoparticles and brought up important considerations for NP sample preparation for electrocatalytic activity measurements by SICM.
Figure 33.

SECM-SICM topographical and electrocatalytic activity images of Au NPs in 0.1 M NaOH at varying substrate potentials. During imaging, the SICM probe was biased at 1 V vs RHE. Reprinted from ref 106. Copyright 2015 Royal Society of Chemistry.
There are also several reports demonstrating SECM/SICM for biological applications. For instance, dual barrel SECM-SICM probes were applied to the voltage-driven delivery of K+ ions by application of a bias to the electrode inside the KCl solution filled SICM barrel.103 The K+ ions stimulated the release of neurotransmitters from a cell, which was then recorded at the SECM electrode by amperometry. Another interesting function of SECM-SICM is spatially mapping the uptake of molecules, such as redox probes, at cell membranes.23,107,170 Analogous to traditional SECM studies,315–321 Takahashi et al. demonstrated the permeability of molecules, such as oxygen, ferrocyanide ([Fe(CN)6]4−), and ferrocene methanol (FcCH2OH), on a cell membrane with SECM-SICM operating in hopping mode.170 Figure 34 shows the topographic image, SECM molecular uptake image, and electrochemical current profiles on a rat cardiac myocyte at each measurement point. In the current profiles, each vertical line represents approach of the pipette from an initial position 10 μm above the surface to a final position 300 nm above the sample surface. The cardiac myocyte had a high permeability to oxygen as evidenced by the decrease in current at the cell membrane (Figure 34a). For the oxidation of [Fe(CN)6]4−, a similar faradaic current was recorded at the cardiac myocyte and underlying substrate because this hydrophilic redox probe did not diffuse through the cell membrane (Figure 34b). A decrease in current observed at the cell edges was attributed to partial blockage to [Fe(CN)6]4− diffusion. For the oxidation of FcCH2OH, the current increased over the cell membrane indicating FcCH2OH permeability (Figure 34c). Though, slight negative feedback was observed around the cell edges.
Figure 34.

Topographical (left) and electrochemical (middle) images of a rat cardiac myocyte and electrochemical current profiles at each measurement point (right). SECM-SICM images for the (a) reduction of oxygen at −500 mV vs Ag/AgCl, (b) oxidation of [Fe(CN)6]4− at 500 mV vs Ag/AgCl, and (c) oxidation of FcCH2OH at 500 mV vs Ag/AgCl. Reprinted from ref 170. Copyright 2010 American Chemical Society.
Building from the utility of dual barrel probes for electrochemical imaging, Korchev and coworkers designed a unique pH sensitive probe by integrating an artificial zwitterionic nanomembrane in one barrel of a dual barrel pipette.195 The artificial membrane was prepared by a drying-mediated self-assembly process of poly-l-lysine (PLL) and glucose oxidase (GOx). Both the amine groups on PLL and carboxylic acid residues on GOx are sensitive to pH, which provides the zwitterionic property of the membrane. When the membrane is immersed in a low pH environment, the protonation of amine groups generates positive charges on the membrane. These positive charges hinder the movement of cations and result in a rectified current–voltage response, in which higher current is observed at positive potentials and lower current is observed at negative potentials. In contrast, reversed rectification is observed at higher pH because of the deprotonation of carboxylic acid groups. Because the zwitterionic membrane shows pH-dependent ion current rectification, a calibration curve depicting the current as a function of pH can be generated for a specific applied potential where current rectification is observed (typically, −600 mV vs Ag/AgCl at the pH barrel). This probe was operated in a self-reference hopping mode for mapping the spatial variation in pH at cancer cells. The measured current signal was converted to pH values and plotted in XY-coordinates to generate a pH map of the scan area.
Recent developments in SICM instrumentation and scanning protocols have expanded the utility of SICM imaging with a simple glass nanopipette to include electrochemical reactivity mapping by exploiting SICM’s high sensitivity to changes in ionic flux. Unwin and coworkers presented an interesting way to simultaneously map the topography and interfacial reactivity with SICM at a Pt ultramicroelectrode (UME).322 In this technique, a single barrel pipette was vertically modulated to provide AC current feedback for topographic mapping. Careful tuning of the DC potential applied to the pipette electrode allowed the current response to be sensitive to topography or to ion flux changes (Figure 35a). An electrochemical reaction can be monitored by the DC current because a conductivity gradient forms near the electrode due to the change in charge state of species at the liquid/electrode interface. When, for instance, the electrochemical reaction at the surface involves the conversion of neutral molecules to ionic species, as in N2H4 − 4e− → N2 + 4H+, the electrolyte conductivity changes can be detected as a change in ion conductance current at the pipette electrode. Mapping at a Pt UME for hydrazine oxidation and hydrogen evolution reactions was carried out with a modified distance-modulated mode, where at each pixel, while the pipette was closest to the surface, a voltammogram was collected by sweeping the potential at the substrate. The topographic and electrochemical current maps of the Pt UME are well correlated (Figure 35b and d). The voltammogram collected by the pipette electrode recorded changes in the ion conductance current when the pipette was centered over the Pt UME and aligned well with the voltammogram recorded at the substrate electrode (Figure 35c). When oxidative potentials (0.1 to 0.75 V) were applied to the substrate electrode, an increase in ion conductance current was recorded at the nanopipette probe because of the conversion of one hydrazine molecule to produce four protons. In the potential range of −0.95 to −1.2 V, a decrease in ion conductance current was recorded at the nanopipette probe because of the transformation of aqueous protons to H2. Voltammograms collected at each pixel were also represented in a sequence of images to demonstrate the contrast in ion current at the Pt UME to glass regions on the sample as a function of potential applied to the substrate (Figure 35d).
Figure 35.

(a) SICM schematic for simultaneous local reactivity and topography imaging at a Pt UME for the hydrazine oxidation and hydrogen evolution reaction. (b) Topography map collected at a nanopipette bias of −0.25 V. (c) Voltammograms collected the substrate (red) and pipette probe (blue) when the pipette was centered over the Pt UME. (d) Electrochemical current maps collected at varying potentials. The nanopipette current was normalized by the value at the point of the closest approach for each pixel while the substrate potential was held at −0.2 V. Reprinted from ref 322. Copyright 2016 American Chemical Society.
A later report demonstrated the simultaneous mapping of topography and electrocatalytic activity of Au nanoparticle (NP) ensembles for the electrooxidation of borohydride using a self-referencing hopping mode.35 In the scanning protocol, when the pipette was close to the surface, the potential applied to substrate was pulsed to a value that induced an electrocatalytic reaction for only 20 ms at each pixel.35 This short duration was important to prevent degradation from prolonged application of bias to the sample.323,324 The electrocatalytic reaction at Au NPs resulted in a change in ionic composition measurable by SICM (Figure 36). Of note, the activity map for the Au NPs exhibited a lower tip current around the sides of the NP compared to the top of the NP because of restricted mass transport stemming from the narrow gap between the sides of the NP and the underlying substrate.35
Figure 36.

SICM (a) topography and (b) activity maps at Au NPs deposited on a carbon fiber UME collected in a solution of 3 mM NaBH4 and 30 mM NaOH at substrate bias of 0.75 V and a 0.15 V tip bias. Reprinted from ref 35. Copyright 2017 American Chemical Society.
4.8. Nanoscale Ion Transport Measurements
SICM has been used to evaluate the ion transport across or around samples at nanoscale level by monitoring the ion current of the pipette when it is scanning over the sample surface. To generate the ion flux, a potential is applied beneath or on the sample with reference to the SICM reference electrode in the bath electrolyte, which results in an electric field above the sample that can change the current of the pipette when it is close to the sample.159 The same effect can also be achieved by introducing a concentration gradient across the sample.42 The current change recorded at the pipette is directly related to the ion conductivity of the probed position and it is a highly localized measurement so that heterogeneity present in the sample can be identified and studied.
Early publications of SICM ion transport measurement mainly focused on studying porous membranes.42,159,160,235,325 For example, Chen et al. utilized SICM to investigate the local current–voltage properties of a single nanopore.159 The single nanopore, isolated by an epoxy painting procedure, was from a track-etched polyimide multipore membrane. A Ag/AgCl working electrode was placed under the membrane to apply transmembrane potential, resulting in ion migration which can be sensed by the ion current of the nanopipette. SICM topography scanning and probe control can guide the pipette to the pore center with different known tip–sample distances, as well as other membrane areas with known lateral distance to the pore. The collected current (pipette current)−voltage (transmembrane potential) curve at different probe positions in the vicinity of the nanopore reflected the local conductivity of spaces around the nanopore which showed spatial distribution. Furthermore, they proposed an equivalent circuit model to explain the experimental data which further clarified the impedance composition of the nanopore. Finally, single nanopore with different geometry had also been studied. It had been shown that a cylindrical nanopore has a linear current–voltage response while the conical nanopore exhibited a rectified curve due to the asymmetric pore geometry and the high surface to volume ratio of the tip.
In addition to measuring current, SICM can also be coupled with potentiometric measurements to sense and quantify ion transport more accurately because potential signals have higher signal-to-noise ratio than current signals.110 For instance, with the development of P-SICM, the ion transport across the probed position can be described by the local conductance shown in eq 11, and the samples had been expanded into biological cells such as an epithelial cell monolayer. Chen et al. first measured the local conductance of Madin-Darby Canine Kidney II (MDCKII) cells with P-SICM at both cell bodies and tight junctions (TJs) where adjacent cells meet, revealing their difference in ion conductivity.109 Later P-SICM studies discovered the effect of TJ protein expression on the ion transport across TJs, such as claudin-2, 16 and 19.109,326 Different types of TJs, such as bicellular TJs (bTJs) where two cells meet and tricellular TJs (tTJs) where multiple cells meet, have also been differentiated.112 Zhou et al. later combined P-SICM with hopping mode to achieve simultaneous topography and local conductance maps of the sample20 (Figure 37) which further enables P-SICM to monitor the dynamics of ion transport across the sample, such as imaging the effect of hyperosmolality on barrier properties of both bTJs and tTJs.327
Figure 37.

(a) Topography and (b) local conductance images of MDCKII cell monolayer collected by P-SICM. The dashed circle indicates one tricellular junction appearing to be more conductive than bicellular junction pathways. Reprinted from ref 20. Copyright 2017 American Chemical Society.
4.9. Liquid–Liquid Interfaces
Limited SICM studies have been applied to probe the interface between two immiscible electrolyte solutions (ITIES).328,329 SICM approach curves collected at a nitrobenzene/water interface changed in shape when the concentration of ions in the organic phase was increased while the composition of the aqueous phase remained unchanged because of compression of diffuse layers at higher electrolyte concentrations.329 Despite ITIES studies being more commonly carried out with SECM, some of the advantages of using SICM include ease of probe fabrication and the SICM feedback mechanism.330 In addition, ITIES combined with SICM has been used to examine ion exchange at the interfacial region between two liquids.329
5. CONCLUSIONS AND FUTURE PERSPECTIVE
This review has provided a summary of scanning ion conductance microscopy, covering the basic principles of SICM, improvements in scan mode and algorithms, and SICM applications in chemistry, biology, and material science. SICM was invented initially for the measurement of soft biological samples immersed in electrolyte, but with continued evolution, applications of SICM have extended to a diverse range of sample types and areas of study. Compared with other SPM techniques, SICM exhibits a number of fundamental advantages, highlighted in the discussions above. Especially key is the noninvasive nature of the measurement. Performance of SICM has improved markedly in recent years, especially in feedback stability and even more recently in scanning speed. Advanced feedback modes have been key to realizing experiments on more challenging samples. Many of the recent advances rely on improvements in electronics associated with controlling imaging parameters, for instance field programmable gate arrays.
One of the most significant areas that SICM has expanded into is in recording chemical and physical measurements beyond simple topographic imaging. The use of multibarrel or modified pipettes has been key in these pursuits, but subtle effects such as the influence of the electric double layer also provide opportunities. Many of the basic approaches to such measurements are now available and can be exploited outside of the initial proof-of-concept experiments.
In the future, we might expect several areas to be of special interest. In terms of additional instrument development, high-speed imaging will likely continue to be an area of focus, as significant strides are showing the possibility of fast imaging applications. With advances in image processing and data collection, including machine learning and feature recognition techniques, opportunities to improve SICM image processing will surely arise. While experimental innovations that take SICM beyond aqueous, symmetric concentrations are becoming more common, this area of inquiry is likely to expand significantly in the future. Finally, while one of the most attractive aspects of SICM remains the simplicity of the pipette probe and the ability to easily fabricate pipettes, many opportunities remain to exploit chemical modification of probes to develop pipettes with selective chemical/biochemical responses.
SICM is clearly an important tool in the modern area of nanoscale electrochemical imaging, and even as the tool has matured, experimental space into which SICM can yet expand appears ample.
ACKNOWLEDGMENTS
The authors were supported by the National Science Foundation (CHE-1808133; CBET-1726642) and the National Institutes of Health (NINDS 5R01NS105888) during preparation of this review. The authors gratefully acknowledge the diverse research community that has carried out the research described herein.
Biographies
Cheng Zhu is a Ph.D. candidate in the Baker research group in Indiana University, Bloomington. He received his B.S. degree in the school of chemistry and chemical engineering, Nanjing University. His research focus on the development of novel SICM techniques for measurement of chemical/physical properties.
Kaixiang Huang received his B.S. degree in Chemistry from Fudan University, Shanghai, China in 2016, where he performed undergraduate research in analyzing the surface properties of catalysts for gas reactions. He is currently a Ph.D. candidate in the Baker research group at Indiana University. His research interest is focused on extending the applications of SICM in biosystems and nanochemical analysis.
Natasha P. Siepser received a B.S. in chemistry from Western Washington University in 2016 and is currently a Ph.D. candidate in the Baker research group at Indiana University. Her research focuses on local chemical measurements at catalytic surfaces with scanning electrochemical cell microscopy.
Lane A. Baker is a Professor of Chemistry at Indiana University and presently holds a James F. Jackson Chair. Lane received a B.S. in chemistry from Missouri State University and a Ph.D. in chemistry at Texas A&M University, followed by postdoctoral appointments at the Naval Research Laboratory and the University of Florida. He has been at Indiana since 2006, where his group has focused on development of instruments and applications related to nanoscale electrochemistry.
Footnotes
Complete contact information is available at: https://pubs.acs.org/10.1021/acs.chemrev.0c00962
The authors declare no competing financial interest.
Contributor Information
Cheng Zhu, Department of Chemistry, Indiana University, Bloomington, Indiana 47405, United States.
Kaixiang Huang, Department of Chemistry, Indiana University, Bloomington, Indiana 47405, United States.
Natasha P. Siepser, Department of Chemistry, Indiana University, Bloomington, Indiana 47405, United States.
Lane A. Baker, Department of Chemistry, Indiana University, Bloomington, Indiana 47405, United States.
REFERENCES
- (1).Hansma P; Drake B; Marti O; Gould S; Prater C The Scanning Ion-Conductance Microscope. Science 1989, 243, 641–643. [DOI] [PubMed] [Google Scholar]
- (2).Miragoli M; Moshkov A; Novak P; Shevchuk A; Nikolaev VO; El-Hamamsy I; Potter CMF; Wright P; Kadir S; Lyon AR; et al. Scanning Ion Conductance Microscopy: A Convergent High-Resolution Technology for Multi-Parametric Analysis of Living Cardiovascular Cells. J. R. Soc., Interface 2011, 8, 913–925. [DOI] [PMC free article] [PubMed] [Google Scholar]
- (3).Anariba F; Anh JH; Jung GE; Cho NJ; Cho SJ Biophysical Applications of Scanning Ion Conductance Microscopy (SICM). Mod. Phys. Lett. B 2012, 26, 1130003. [Google Scholar]
- (4).Chen C-C; Zhou Y; Baker LA Scanning Ion Conductance Microscopy. Annu. Rev. Anal. Chem 2012, 5, 207–228. [DOI] [PubMed] [Google Scholar]
- (5).Happel P; Thatenhorst D; Dietzel ID Scanning Ion Conductance Microscopy for Studying Biological Samples. Sensors 2012, 12, 14983–15008. [DOI] [PMC free article] [PubMed] [Google Scholar]
- (6).Lab MJ; Bhargava A; Wright PT; Gorelik J The Scanning Ion Conductance Microscope for Cellular Physiology. Am. J. Physiol. Heart Circ. Physiol 2013, 304, H1–H11. [DOI] [PubMed] [Google Scholar]
- (7).Liu BC; Lu XY; Song X; Lei KY; Alli AA; Bao HF; Eaton DC; Ma HP Scanning Ion Conductance Microscopy: A Nanotechnology for Biological Studies in Live Cells. Front. Physiol 2013, 3, 483. [DOI] [PMC free article] [PubMed] [Google Scholar]
- (8).Page A; Perry D; Unwin PR Multifunctional Scanning Ion Conductance Microscopy. Proc. R. Soc. London, Ser. A 2017, 473, 20160899. [DOI] [PMC free article] [PubMed] [Google Scholar]
- (9).Nakajima M; Mizutani Y; Iwata F; Ushiki T Scanning Ion Conductance Microscopy for Visualizing the Three-Dimensional Surface Topography of Cells and Tissues. Semin. Cell Dev. Biol 2018, 73, 125–131. [DOI] [PubMed] [Google Scholar]
- (10).Li ZH; Xu K; Wei FA Recent Development of Samples’ Surface Properties Using Scanning Ion Conductance Microscopy. Micro Nano Lett. 2019, 14, 744–748. [Google Scholar]
- (11).Zhang J; Zhu T; Lang J; Fu W; Li F Recent Advances of Scanning Electrochemical Microscopy and Scanning Ion Conductance Microscopy for Single-Cell Analysis. Curr. Opin. Electrochem 2020, 22, 178–185. [Google Scholar]
- (12).Sachs L; Denker C; Greinacher A; Palankar R Quantifying Single-Platelet Biomechanics: An Outsider’s Guide to Biophysical Methods and Recent Advances. Res. Pract. Thromb. Haemost 2020, 4, 386–401. [DOI] [PMC free article] [PubMed] [Google Scholar]
- (13).Stanley J; Pourmand N Nanopipettes-the Past and the Present. APL Mater. 2020, 8, 100902. [Google Scholar]
- (14).Nitz H; Kamp J; Fuchs H A Combined Scanning Ion-Conductance and Shear-Force Microscope. Probe Microsc. 1998, 1, 187–200. [Google Scholar]
- (15).Rheinlaender J; Schäffer TE An Accurate Model for the Ion Current-Distance Behavior in Scanning Ion Conductance Microscopy Allows for Calibration of Pipet Tip Geometry and Tip-Sample Distance. Anal. Chem 2017, 89, 11875–11880. [DOI] [PubMed] [Google Scholar]
- (16).Gorelik J; Shevchuk A; Ramalho M; Elliott M; Lei C; Higgins CF; Lab MJ; Klenerman D; Krauzewicz N; Korchev Y Scanning Surface Confocal Microscopy for Simultaneous Topographical and Fluorescence Imaging: Application to Single Virus-Like Particle Entry into a Cell. Proc. Natl. Acad. Sci. U. S. A 2002, 99, 16018–16023. [DOI] [PMC free article] [PubMed] [Google Scholar]
- (17).Shevchuk AI; Gorelik J; Harding SE; Lab MJ; Klenerman D; Korchev YE Simultaneous Measurement of Ca2+ and Cellular Dynamics: Combined Scanning Ion Conductance and Optical Microscopy to Study Contracting Cardiac Myocytes. Biophys. J 2001, 81, 1759–1764. [DOI] [PMC free article] [PubMed] [Google Scholar]
- (18).Bruckbauer A; James P; Zhou D; Yoon JW; Excell D; Korchev Y; Jones R; Klenerman D Nanopipette Delivery of Individual Molecules to Cellular Compartments for Single-Molecule Fluorescence Tracking. Biophys. J 2007, 93, 3120–3131. [DOI] [PMC free article] [PubMed] [Google Scholar]
- (19).Rheinlaender J; Schäffer TE Lateral Resolution and Image Formation in Scanning Ion Conductance Microscopy. Anal. Chem 2015, 87, 7117–7124. [DOI] [PubMed] [Google Scholar]
- (20).Zhou LS; Gong YF; Hou JH; Baker LA Quantitative Visualization of Nanoscale Ion Transport. Anal. Chem 2017, 89, 13603–13609. [DOI] [PubMed] [Google Scholar]
- (21).Rheinlaender J; Geisse NA; Proksch R; Schäffer TE Comparison of Scanning Ion Conductance Microscopy with Atomic Force Microscopy for Cell Imaging. Langmuir 2011, 27, 697–704. [DOI] [PubMed] [Google Scholar]
- (22).Gesper A; Hagemann P; Happel P A Low-Cost, Large Field-of-View Scanning Ion Conductance Microscope for Studying Nanoparticle-Cell Membrane Interactions. Nanoscale 2017, 9, 14172–14183. [DOI] [PubMed] [Google Scholar]
- (23).Page A; Kang M; Armitstead A; Perry D; Unwin PR Quantitative Visualization of Molecular Delivery and Uptake at Living Cells with Self-Referencing Scanning Ion Conductance Microscopy Scanning Electrochemical Microscopy. Anal. Chem 2017, 89, 3021–3028. [DOI] [PubMed] [Google Scholar]
- (24).Munoz J-L; Coles JA Quartz Micropipettes for Intracellular Voltage Microelectrodes and Ion-Selective Microelectrodes. J. Neurosci. Methods 1987, 22, 57–64. [DOI] [PubMed] [Google Scholar]
- (25).Morris CA; Friedman AK; Baker LA Applications of Nanopipettes in the Analytical Sciences. Analyst 2010, 135, 2190–2202. [DOI] [PubMed] [Google Scholar]
- (26).Shevchuk AI; Frolenkov GI; Sánchez D; James PS; Freedman N; Lab MJ; Jones R; Klenerman D; Korchev YE Imaging Proteins in Membranes of Living Cells by High-Resolution Scanning Ion Conductance Microscopy. Angew. Chem., Int. Ed 2006, 45, 2212–2216. [DOI] [PubMed] [Google Scholar]
- (27).Zhang SD; Li MZ; Su B; Shao YH Fabrication and Use of Nanopipettes in Chemical Analysis. Annu. Rev. Anal. Chem 2018, 11, 265–286. [DOI] [PubMed] [Google Scholar]
- (28).Perry D; Momotenko D; Lazenby RA; Kang M; Unwin PR Characterization of Nanopipettes. Anal. Chem 2016, 88, 5523–5530. [DOI] [PubMed] [Google Scholar]
- (29).Actis P; Mak AC; Pourmand N Functionalized Nanopipettes: Toward Label-Free, Single Cell Biosensors. Bioanal. Rev 2010, 1, 177–185. [DOI] [PMC free article] [PubMed] [Google Scholar]
- (30).Del Linz S; Willman E; Caldwell M; Klenerman D; Fernandez A; Moss G Contact-Free Scanning and Imaging with the Scanning Ion Conductance Microscope. Anal. Chem 2014, 86, 2353–2360. [DOI] [PMC free article] [PubMed] [Google Scholar]
- (31).Bentley CL; Perry D; Unwin PR Stability and Placement of Ag/AgCl Quasi-Reference Counter Electrodes in Confined Electrochemical Cells. Anal. Chem 2018, 90, 7700–7707. [DOI] [PubMed] [Google Scholar]
- (32).Perera RT; Rosenstein JK Quasi-Reference Electrodes in Confined Electrochemical Cells Can Result in in Situ Production of Metallic Nanoparticles. Sci. Rep 2018, 8, 1965. [DOI] [PMC free article] [PubMed] [Google Scholar]
- (33).Zhang PK; Aydemir N; Alkaisi M; Williams DE; Travas-Sejdic J Direct Writing and Characterization of Three-Dimensional Conducting Polymer Pedot Arrays. ACS Appl. Mater. Interfaces 2018, 10, 11888–11895. [DOI] [PubMed] [Google Scholar]
- (34).Aydemir N; Parcell J; Laslau C; Nieuwoudt M; Williams DE; Travas-Sejdic J Direct Writing of Conducting Polymers. Macromol. Rapid Commun 2013, 34, 1296–1300. [DOI] [PubMed] [Google Scholar]
- (35).Kang MK; Perry D; Bentley CL; West G; Page A; Unwin PR Simultaneous Topography and Reaction Flux Mapping at and around Electrocatalytic Nanoparticles. ACS Nano 2017, 11, 9525–9535. [DOI] [PubMed] [Google Scholar]
- (36).Bard AJ; Faulkner LR Electrochemical Methods: Fundamentals and Applications, 2nd ed.; John Wiley & Sons: New York, 2001; pp 65–69. [Google Scholar]
- (37).Wei C; Bard AJ; Feldberg SW Current Rectification at Quartz Nanopipet Electrodes. Anal. Chem 1997, 69, 4627–4633. [Google Scholar]
- (38).Grahame DC The Electrical Double Layer and the Theory of Electrocapillarity. Chem. Rev 1947, 41, 441–501. [DOI] [PubMed] [Google Scholar]
- (39).Korchev YE; Bashford CL; Milovanovic M; Vodyanoy I; Lab MJ Scanning Ion Conductance Microscopy of Living Cells. Biophys. J 1997, 73, 653–658. [DOI] [PMC free article] [PubMed] [Google Scholar]
- (40).Bruckbauer A; Ying L; Rothery AM; Zhou D; Shevchuk AI; Abell C; Korchev YE; Klenerman D Writing with DNA and Protein Using a Nanopipet for Controlled Delivery. J. Am. Chem. Soc 2002, 124, 8810–8811. [DOI] [PubMed] [Google Scholar]
- (41).Perry D; Page A; Chen BP; Frenguelli BG; Unwin PR Differential-Concentration Scanning Ion Conductance Microscopy. Anal. Chem 2017, 89, 12458–12465. [DOI] [PubMed] [Google Scholar]
- (42).Chen C-C; Derylo MA; Baker LA Measurement of Ion Currents through Porous Membranes with Scanning Ion Conductance Microscopy. Anal. Chem 2009, 81, 4742–4751. [DOI] [PubMed] [Google Scholar]
- (43).Choi M; Baker LA Biphasic-Scanning Ion Conductance Microscopy. Anal. Chem 2018, 90, 11797–11801. [DOI] [PubMed] [Google Scholar]
- (44).Rodolfa KT; Bruckbauer A; Zhou D; Schevchuk AI; Korchev YE; Klenerman D Nanoscale Pipetting for Controlled Chemistry in Small Arrayed Water Droplets Using a Double-Barrel Pipet. Nano Lett. 2006, 6, 252–257. [DOI] [PubMed] [Google Scholar]
- (45).Lipson AL; Ginder RS; Hersam MC Nanoscale in Situ Characterization of Li-Ion Battery Electrochemistry Via Scanning Ion Conductance Microscopy. Adv. Mater 2011, 23, 5613–5617. [DOI] [PubMed] [Google Scholar]
- (46).Lipson AL; Puntambekar K; Comstock DJ; Meng XB; Geier ML; Elam JW; Hersam MC Nanoscale Investigation of Solid Electrolyte Interphase Inhibition on Li-Ion Battery MnO Electrodes Via Atomic Layer Deposition of Al2O3. Chem. Mater 2014, 26, 935–940. [Google Scholar]
- (47).Plett T; Shi WQ; Zeng YH; Mann W; Vlassiouk I; Baker LA; Siwy ZS Rectification of Nanopores in Aprotic Solvents-Transport Properties of Nanopores with Surface Dipoles. Nanoscale 2015, 7, 19080–19091. [DOI] [PubMed] [Google Scholar]
- (48).Peaceman DW; Rachford HH The Numerical Solution of Parabolic and Elliptic Differential Equations. J. Soc. Ind. Appl. Math 1955, 3, 28–41. [Google Scholar]
- (49).Unwin PR; Bard AJ Scanning Electrochemical Microscopy.9. Theory and Application of the Feedback Mode to the Measurement of Following Chemical Reaction Rates in Electrode Processes. J. Phys. Chem 1991, 95, 7814–7824. [Google Scholar]
- (50).Gavaghan DJ; Rollett JS Correction of Boundary Singularities in Numerical Simulation of Time-Dependent Diffusion Processes at Unshielded Disc Electrodes. J. Electroanal. Chem. Interfacial Electrochem 1990, 295, 1–14. [Google Scholar]
- (51).Ferrigno R; Brevet PF; Girault HH Finite Element Simulation of the Chronoamperometric Response of Recessed and Protruding Microdisc Electrodes. Electrochim. Acta 1997, 42, 1895–1903. [Google Scholar]
- (52).Heinze J Diffusion Processes at Finite (Micro) Disk Electrodes Solved by Digital Simulation. J. Electroanal. Chem. Interfacial Electrochem 1981, 124, 73–86. [Google Scholar]
- (53).Edwards MA; Williams CG; Whitworth AL; Unwin PR Scanning Ion Conductance Microscopy: A Model for Experimentally Realistic Conditions and Image Interpretation. Anal. Chem 2009, 81, 4482–4492. [DOI] [PubMed] [Google Scholar]
- (54).Wang YX; Cai HJ; Mirkin MV Delivery of Single Nanoparticles from Nanopipettes under Resistive-Pulse Control. ChemElectroChem 2015, 2, 343–347. [Google Scholar]
- (55).Dorwling-Carter L; Aramesh M; Forro C; Tiefenauer RF; Shorubalko I; Voros J; Zambelli T Simultaneous Scanning Ion Conductance and Atomic Force Microscopy with a Nanopore: Effect of the Aperture Edge on the Ion Current Images. J. Appl. Phys 2018, 124, 174902. [Google Scholar]
- (56).Lan W-J; Holden DA; White HS Pressure-Dependent Ion Current Rectification in Conical-Shaped Glass Nanopores. J. Am. Chem. Soc 2011, 133, 13300–13303. [DOI] [PubMed] [Google Scholar]
- (57).Lan W-J; White HS Diffusional Motion of a Particle Translocating through a Nanopore. ACS Nano 2012, 6, 1757–1765. [DOI] [PubMed] [Google Scholar]
- (58).Schäffer TE; Anczykowski B; Fuchs H Scanning Ion Conductance Microscopy. In Applied Scanning Probe Methods II; Springer: 2006; pp 91–119. [Google Scholar]
- (59).Böcker M; Anczykowski B; Wegener J; Schäffer TE Scanning Ion Conductance Microscopy with Distance-Modulated Shear Force Control. Nanotechnology 2007, 18, 145505. [Google Scholar]
- (60).Rheinlaender J; Schäffer TE Image Formation, Resolution, and Height Measurement in Scanning Ion Conductance Microscopy. J. Appl. Phys 2009, 105, No. 094905. [Google Scholar]
- (61).Payne NA; Dawkins JIG; Schougaard SB; Mauzeroll J Effect of Substrate Permeability on Scanning Ion Conductance Microscopy: Uncertainty in Tip-Substrate Separation and Determination of Ionic Conductivity. Anal. Chem 2019, 91, 15718–15725. [DOI] [PubMed] [Google Scholar]
- (62).Jiao Y; Zhuang J; Zheng Q; Liao X A High Accuracy Ion Conductance Imaging Method Based on the Approach Curve Spectrum. Ultramicroscopy 2020, 215, 113025. [DOI] [PubMed] [Google Scholar]
- (63).Sa N; Lan W-J; Shi W; Baker LA Rectification of Ion Current in Nanopipettes by External Substrates. ACS Nano 2013, 7, 11272–11282. [DOI] [PMC free article] [PubMed] [Google Scholar]
- (64).Perry D; Nadappuram BP; Momotenko D; Voyias PD; Page A; Tripathi G; Frenguelli BG; Unwin PR Surface Charge Visualization at Viable Living Cells. J. Am. Chem. Soc 2016, 138, 3152–3160. [DOI] [PubMed] [Google Scholar]
- (65).Perry D; Al Botros R; Momotenko D; Kinnear SL; Unwin PR Simultaneous Nanoscale Surface Charge and Topographical Mapping. ACS Nano 2015, 9, 7266–7276. [DOI] [PubMed] [Google Scholar]
- (66).McKelvey K; Kinnear SL; Perry D; Momotenko D; Unwin PR Surface Charge Mapping with a Nanopipette. J. Am. Chem. Soc 2014, 136, 13735–13744. [DOI] [PubMed] [Google Scholar]
- (67).Proksch R; Lal R; Hansma PK; Morse D; Stucky G Imaging the Internal and External Pore Structure of Membranes in Fluid: Tappingmode Scanning Ion Conductance Microscopy. Biophys. J 1996, 71, 2155–2157. [DOI] [PMC free article] [PubMed] [Google Scholar]
- (68).Korchev Y; Milovanovic M; Bashford C; Bennett D; Sviderskaya E; Vodyanoy I; Lab M Specialized Scanning Ion-Conductance Microscope for Imaging of Living Cells. J. Microsc 1997, 188, 17–23. [DOI] [PubMed] [Google Scholar]
- (69).Li C; Johnson N; Ostanin V; Shevchuk A; Ying L; Korchev Y; Klenerman D High Resolution Imaging Using Scanning Ion Conductance Microscopy with Improved Distance Feedback Control. Prog. Nat. Sci 2008, 18, 671–677. [Google Scholar]
- (70).Pastré D; Iwamoto H; Liu J; Szabo G; Shao Z Characterization of AC Mode Scanning Ion-Conductance Microscopy. Ultramicroscopy 2001, 90, 13–19. [DOI] [PubMed] [Google Scholar]
- (71).Chen CC; Baker LA Effects of Pipette Modulation and Imaging Distances on Ion Currents Measured with Scanning Ion Conductance Microscopy (SICM). Analyst 2011, 136, 90–97. [DOI] [PubMed] [Google Scholar]
- (72).McKelvey K; Perry D; Byers JC; Colburn AW; Unwin PR Bias Modulated Scanning Ion Conductance Microscopy. Anal. Chem 2014, 86, 3639–3646. [DOI] [PubMed] [Google Scholar]
- (73).Li P; Liu LQ; Yang Y; Wang YC; Li GY In-Phase Bias Modulation Mode of Scanning Ion Conductance Microscopy with Capacitance Compensation. IEEE Trans. Ind. Electron 2015, 62, 6508–6518. [Google Scholar]
- (74).Shkirskiy V; Kang M; McPherson IJ; Bentley CL; Wahab OJ; Daviddi E; Colburn AW; Unwin PR Electrochemical Impedance Measurements in Scanning Ion Conductance Microscopy. Anal. Chem 2020, 92, 12509–12517. [DOI] [PubMed] [Google Scholar]
- (75).Li P; Liu LQ; Wang YC; Yang Y; Zhang CL; Li GY Phase Modulation Mode of Scanning Ion Conductance Microscopy. Appl. Phys. Lett 2014, 105, No. 053113. [Google Scholar]
- (76).Li P; Liu LQ; Yang Y; Zhou L; Wang D; Wang YC; Li GY Amplitude Modulation Mode of Scanning Ion Conductance Microscopy. Jala 2015, 20, 457–462. [DOI] [PubMed] [Google Scholar]
- (77).Mann S; Hoffmann G; Hengstenberg A; Schuhmann W; Dietzel I Pulse-Mode Scanning Ion Conductance Microscopy-a Method to Investigate Cultured Hippocampal Cells. J. Neurosci. Methods 2002, 116, 113–117. [DOI] [PubMed] [Google Scholar]
- (78).Happel P; Hoffmann G; Mann S; Dietzel I Monitoring Cell Movements and Volume Changes with Pulse-Mode Scanning Ion Conductance Microscopy. J. Microsc 2003, 212, 144–151. [DOI] [PubMed] [Google Scholar]
- (79).Happel P; Dietzel ID Backstep Scanning Ion Conductance Microscopy as a Tool for Long Term Investigation of Single Living Cells. J. Nanobiotechnol 2009, 7, 7. [DOI] [PMC free article] [PubMed] [Google Scholar]
- (80).Novak P; Li C; Shevchuk AI; Stepanyan R; Caldwell M; Hughes S; Smart TG; Gorelik J; Ostanin VP; Lab MJ Nanoscale Live-Cell Imaging Using Hopping Probe Ion Conductance Microscopy. Nat. Methods 2009, 6, 279–281. [DOI] [PMC free article] [PubMed] [Google Scholar]
- (81).Zhuang J; Wang Z; Liao X; Gao B; Cheng L Hierarchical Spiral-Scan Trajectory for Efficient Scanning Ion Conductance Microscopy. Micron 2019, 123, 102683. [DOI] [PubMed] [Google Scholar]
- (82).Takahashi Y; Murakami Y; Nagamine K; Shiku H; Aoyagi S; Yasukawa T; Kanzaki M; Matsue T Topographic Imaging of Convoluted Surface of Live Cells by Scanning Ion Conductance Microscopy in a Standing Approach Mode. Phys. Chem. Chem. Phys 2010, 12, 10012–10017. [DOI] [PubMed] [Google Scholar]
- (83).Yamada H Imaging a Single Living Cell Via Shear Force-Based Scanning Ion Conductance Microscopy in Standing Approach Mode with Differential Control. Electrochim. Acta 2014, 136, 233–239. [Google Scholar]
- (84).Jung GE; Noh H; Shin YK; Kahng SJ; Baik KY; Kim HB; Cho NJ; Cho SJ Closed-Loop ARS Mode for Scanning Ion Conductance Microscopy with Improved Speed and Stability for Live Cell Imaging Applications. Nanoscale 2015, 7, 10989–10997. [DOI] [PubMed] [Google Scholar]
- (85).Zhuang J; Jiao YBH; Li ZQ; Lang JX; Li F A Continuous Control Mode with Improved Imaging Rate for Scanning Ion Conductance Microscope (SICM). Ultramicroscopy 2018, 190, 66–76. [DOI] [PubMed] [Google Scholar]
- (86).Ushiki T; Nakajima M; Choi M; Cho S-J; Iwata F Scanning Ion Conductance Microscopy for Imaging Biological Samples in Liquid: A Comparative Study with Atomic Force Microscopy and Scanning Electron Microscopy. Micron 2012, 43, 1390–1398. [DOI] [PubMed] [Google Scholar]
- (87).Ida H; Takahashi Y; Kumatani A; Shiku H; Matsue T High Speed Scanning Ion Conductance Microscopy for Quantitative Analysis of Nanoscale Dynamics of Microvilli. Anal. Chem 2017, 89, 6016–6021. [DOI] [PubMed] [Google Scholar]
- (88).Zhuang J; Jiao YBH; Mugabo V A New Scanning Mode to Improve Scanning Ion Conductance Microscopy Imaging Rate with Pipette Predicted Movement. Micron 2017, 101, 177–185. [DOI] [PubMed] [Google Scholar]
- (89).Zhuang J; Wang ZW; Li ZQ; Liang PB; Vincent M Smart Scanning Ion-Conductance Microscopy Imaging Technique Using Horizontal Fast Scanning Method. Microsc. Microanal 2018, 24, 264–276. [DOI] [PubMed] [Google Scholar]
- (90).Shevchuk A; Tokar S; Gopal S; Sanchez-Alonso JL; Tarasov AI; Velez-Ortega AC; Chiappini C; Rorsman P; Stevens MM; Gorelik J; et al. Angular Approach Scanning Ion Conductance Microscopy. Biophys. J 2016, 110, 2252–2265. [DOI] [PMC free article] [PubMed] [Google Scholar]
- (91).Zhukov A; Richards O; Ostanin V; Korchev Y; Klenerman D A Hybrid Scanning Mode for Fast Scanning Ion Conductance Microscopy (SICM) Imaging. Ultramicroscopy 2012, 121, 1–7. [DOI] [PMC free article] [PubMed] [Google Scholar]
- (92).Watanabe S; Ando T High-Speed XYZ-Nanopositioner for Scanning Ion Conductance Microscopy. Appl. Phys. Lett 2017, 111, 113106. [Google Scholar]
- (93).Watanabe S; Kitazawa S; Sun L; Kodera N; Ando T Development of High-Speed Ion Conductance Microscopy. Rev. Sci. Instrum 2019, 90, 123704. [DOI] [PubMed] [Google Scholar]
- (94).Simeonov S; Schäffer TE High-Speed Scanning Ion Conductance Microscopy for Sub-Second Topography Imaging of Live Cells. Nanoscale 2019, 11, 8579–8587. [DOI] [PubMed] [Google Scholar]
- (95).Shevchuk AI; Novak P; Taylor M; Diakonov IA; Ziyadeh-Isleem A; Bitoun M; Guicheney P; Lab MJ; Gorelik J; Merrifield CJ; et al. An Alternative Mechanism of Clathrin-Coated Pit Closure Revealed by Ion Conductance Microscopy. J. Cell Biol 2012, 197, 499–508. [DOI] [PMC free article] [PubMed] [Google Scholar]
- (96).Novak P; Shevchuk A; Ruenraroengsak P; Miragoli M; Thorley AJ; Klenerman D; Lab MJ; Tetley TD; Gorelik J; Korchev YE Imaging Single Nanoparticle Interactions with Human Lung Cells Using Fast Ion Conductance Microscopy. Nano Lett. 2014, 14, 1202–1207. [DOI] [PubMed] [Google Scholar]
- (97).Yong YK; Aphale SS; Moheimani SOR Design, Identification, and Control of a Flexure-Based XY Stage for Fast Nanoscale Positioning. IEEE Trans. Nanotechnol 2009, 8, 46–54. [Google Scholar]
- (98).Zhuang J; Cheng L; Liao X; Zia AA; Wang Z A Fuzzy Control for High-Speed and Low-Overshoot Hopping Probe Ion Conductance Microscopy. Rev. Sci. Instrum 2020, 91, No. 033703. [DOI] [PubMed] [Google Scholar]
- (99).Takahashi Y; Zhou Y; Miyamoto T; Higashi H; Nakamichi N; Takeda Y; Kato Y; Korchev Y; Fukuma T High-Speed SICM for the Visualization of Nanoscale Dynamic Structural Changes in Hippocampal Neurons. Anal. Chem 2020, 92, 2159–2167. [DOI] [PubMed] [Google Scholar]
- (100).Schierbaum N; Hack M; Betz O; Schäffer TE Macro-SICM: A Scanning Ion Conductance Microscope for Large-Range Imaging. Anal. Chem 2018, 90, 5048–5054. [DOI] [PubMed] [Google Scholar]
- (101).Zhuang J; Li ZQ; Jiao YBH Double Micropipettes Configuration Method of Scanning Ion Conductance Microscopy. Rev. Sci. Instrum 2016, 87, No. 073703. [DOI] [PubMed] [Google Scholar]
- (102).Kawashima T; Matsugase T; Tanaka K; Nagai M; Shibata T; Mineta T; Makino E Fabrication of Hollow SiO2 Nanoneedle Array and Characterization of Simultaneous Multi-Site Ion-Conductance Recordings for Cell Morphology Imaging. Microelectron. Eng 2012, 98, 663–667. [Google Scholar]
- (103).Takahashi Y; Shevchuk AI; Novak P; Zhang YJ; Ebejer N; Macpherson JV; Unwin PR; Pollard AJ; Roy D; Clifford CA; et al. Multifunctional Nanoprobes for Nanoscale Chemical Imaging and Localized Chemical Delivery at Surfaces and Interfaces. Angew. Chem., Int. Ed 2011, 50, 9638–9642. [DOI] [PubMed] [Google Scholar]
- (104).Nadappuram BP; McKelvey K; Al Botros R; Colburn AW; Unwin PR Fabrication and Characterization of Dual Function Nanoscale pH-Scanning Ion Conductance Microscopy (SICM) Probes for High Resolution pH Mapping. Anal. Chem 2013, 85, 8070–8074. [DOI] [PubMed] [Google Scholar]
- (105).O’Connell MA; Wain AJ Mapping Electroactivity at Individual Catalytic Nanostructures Using High-Resolution Scanning Electrochemical-Scanning Ion Conductance Microcopy. Anal. Chem 2014, 86, 12100–12107. [DOI] [PubMed] [Google Scholar]
- (106).O’Connell MA; Lewis JR; Wain AJ Electrochemical Imaging of Hydrogen Peroxide Generation at Individual Gold Nanoparticles. Chem. Commun 2015, 51, 10314–10317. [DOI] [PubMed] [Google Scholar]
- (107).Takahashi Y; Ida H; Matsumae Y; Komaki H; Zhou YS; Kumatani A; Kanzaki M; Shiku H; Matsue T 3D Electrochemical and Ion Current Imaging Using Scanning Electrochemical-Scanning Ion Conductance Microscopy. Phys. Chem. Chem. Phys 2017, 19, 26728–26733. [DOI] [PubMed] [Google Scholar]
- (108).Chen F; Manandhar P; Ahmed MS; Chang S; Panday N; Zhang HQ; Moon JH; He J Extracellular Surface Potential Mapping by Scanning Ion Conductance Microscopy Revealed Transient Transmembrane Pore Formation Induced by Conjugated Polymer Nanoparticles. Macromol. Biosci 2019, 19, 1800271. [DOI] [PubMed] [Google Scholar]
- (109).Chen CC; Zhou Y; Morris CA; Hou JH; Baker LA Scanning Ion Conductance Microscopy Measurement of Paracellular Channel Conductance in Tight Junctions. Anal. Chem 2013, 85, 3621–3628. [DOI] [PMC free article] [PubMed] [Google Scholar]
- (110).Zhou Y; Chen CC; Weber AE; Zhou LS; Baker LA Potentiometric-Scanning Ion Conductance Microscopy. Langmuir 2014, 30, 5669–5675. [DOI] [PubMed] [Google Scholar]
- (111).Zhou LS; Zeng YH; Baker LA; Hou JH A Proposed Route to Independent Measurements of Tight Junction Conductance at Discrete Cell Junctions. Tissue Barriers 2015, 3, No. e1105907. [DOI] [PMC free article] [PubMed] [Google Scholar]
- (112).Zhou LS; Gong YF; Sunq A; Hou JH; Baker LA Capturing Rare Conductance in Epithelia with Potentiometric-Scanning Ion Conductance Microscopy. Anal. Chem 2016, 88, 9630–9637. [DOI] [PubMed] [Google Scholar]
- (113).Zhuang J; Guo RF; Li F; Yu DH Large-Scale and Non-Contact Surface Topography Measurement Using Scanning Ion Conductance Microscopy and Sub-Aperture Stitching Technique. Meas. Sci. Technol 2016, 27, No. 085402. [Google Scholar]
- (114).Zhao Z; Zhao H; Gu F; Du H; Li K Non-Null Testing for Aspheric Surfaces Using Elliptical Sub-Aperture Stitching Technique. Opt. Express 2014, 22, 5512–5521. [DOI] [PubMed] [Google Scholar]
- (115).Happel P; Moller K; Kunz R; Dietzel I D A Boundary Delimitation Algorithm to Approximate Cell Soma Volumes of Bipolar Cells from Topographical Data Obtained by Scanning Probe Microscopy. BMC Bioinf. 2010, 11, 323. [DOI] [PMC free article] [PubMed] [Google Scholar]
- (116).Wen YB; Song JM; Fan XJ; Hussain D; Zhang H; Xie H Fast Specimen Boundary Tracking and Local Imaging with Scanning Probe Microscopy. Scanning 2018, 2018, 3979576. [DOI] [PMC free article] [PubMed] [Google Scholar]
- (117).Song B; Xi N; Yang R; Lai KWC; Qu C In Video Rate Atomic Force Microscopy (AFM) Imaging Using Compressive Sensing; 2011 11th IEEE International Conference on Nanotechnology: Portland, OR, United States, 15–18 Aug. 2011; pp 1056–1059. [Google Scholar]
- (118).Andersson SB; Pao LY In Non-Raster Sampling in Atomic Force Microscopy: A Compressed Sensing Approach; 2012 American Control Conference (ACC): Montreal, QC, Canada, 27–29 June 2012; pp 2485–2490. [Google Scholar]
- (119).Li GX; Li P; Wang YC; Wang WX; Xi N; Liu LQ Efficient Imaging and Real-Time Display of Scanning Ion Conductance Microscopy Based on Block Compressive Sensing. Int. J. Optomechatronics 2014, 8, 218–227. [Google Scholar]
- (120).Li GX; Fang X A Fast Imaging Method of Scanning Ion Conductance Microscopy. Micron 2018, 114, 8–13. [DOI] [PubMed] [Google Scholar]
- (121).Wang ZW; Zhuang J; Gao ZJ; Liao XB A Fast Scanning Ion Conductance Microscopy Imaging Method Using Compressive Sensing and Low-Discrepancy Sequences. Rev. Sci. Instrum 2018, 89, 113709. [DOI] [PubMed] [Google Scholar]
- (122).Rosenbluth MJ; Lam WA; Fletcher DA Analyzing Cell Mechanics in Hematologic Diseases with Microfluidic Biophysical Flow Cytometry. Lab Chip 2008, 8, 1062–1070. [DOI] [PMC free article] [PubMed] [Google Scholar]
- (123).Rianna C; Radmacher M Cell Mechanics as a Marker for Diseases: Biomedical Applications of AFM. AIP Conf. Proc 2016, 1760, No. 020057. [Google Scholar]
- (124).Prabhune M; Belge G; Dotzauer A; Bullerdiek J; Radmacher M Comparison of Mechanical Properties of Normal and Malignant Thyroid Cells. Micron 2012, 43, 1267–1272. [DOI] [PubMed] [Google Scholar]
- (125).Hochmuth RM Micropipette Aspiration of Living Cells. J. Biomech 2000, 33, 15–22. [DOI] [PubMed] [Google Scholar]
- (126).Vanapalli SA; Duits MHG; Mugele F Microfluidics as a Functional Tool for Cell Mechanics. Biomicrofluidics 2009, 3, No. 012006. [DOI] [PMC free article] [PubMed] [Google Scholar]
- (127).Dahl JB; Lin J-MG; Muller SJ; Kumar S Microfluidic Strategies for Understanding the Mechanics of Cells and Cell-Mimetic Systems. Annu. Rev. Chem. Biomol. Eng 2015, 6, 293–317. [DOI] [PMC free article] [PubMed] [Google Scholar]
- (128).Dal J; Sheetz MP Axon Membrane Flows from the Growth Cone to the Cell Body. Cell 1995, 83, 693–701. [DOI] [PubMed] [Google Scholar]
- (129).Guck J; Ananthakrishnan R; Mahmood H; Moon TJ; Cunningham CC; Käs J The Optical Stretcher: A Novel Laser Tool to Micromanipulate Cells. Biophys. J 2001, 81, 767–784. [DOI] [PMC free article] [PubMed] [Google Scholar]
- (130).Hoh JH; Schoenenberger CA Surface Morphology and Mechanical Properties of MDCK Monolayers by Atomic Force Microscopy. J. Cell Sci 1994, 107, 1105–1114. [DOI] [PubMed] [Google Scholar]
- (131).Sen S; Subramanian S; Discher DE Indentation and Adhesive Probing of a Cell Membrane with AFM: Theoretical Model and Experiments. Biophys. J 2005, 89, 3203–3213. [DOI] [PMC free article] [PubMed] [Google Scholar]
- (132).Sánchez D; Johnson N; Li C; Novak P; Rheinlaender J; Zhang Y; Anand U; Anand P; Gorelik J; Frolenkov GI; et al. Noncontact Measurement of the Local Mechanical Properties of Living Cells Using Pressure Applied Via a Pipette. Biophys. J 2008, 95, 3017–3027. [DOI] [PMC free article] [PubMed] [Google Scholar]
- (133).Pellegrino M; Pellegrini M; Orsini P; Tognoni E; Ascoli C; Baschieri P; Dinelli F Measuring the Elastic Properties of Living Cells through the Analysis of Current-Displacement Curves in Scanning Ion Conductance Microscopy. Pfluegers Arch. 2012, 464, 307–316. [DOI] [PubMed] [Google Scholar]
- (134).Tognoni E; Orsini P; Pellegrino M Nonlinear Indentation of Single Human Erythrocytes under Application of a Localized Mechanical Force. Micron 2019, 127, 102760. [DOI] [PubMed] [Google Scholar]
- (135).Rheinlaender J; Schäffer TE Mapping the Mechanical Stiffness of Live Cells with the Scanning Ion Conductance Microscope. Soft Matter 2013, 9, 3230–3236. [Google Scholar]
- (136).Rheinlaender J; Schäffer TE The Effect of Finite Sample Thickness in Scanning Ion Conductance Microscopy Stiffness Measurements. Appl. Phys. Lett 2020, 117, 113701. [Google Scholar]
- (137).Rheinlaender J; Schäffer TE Mapping the Creep Compliance of Living Cells with Scanning Ion Conductance Microscopy Reveals a Subcellular Correlation between Stiffness and Fluidity. Nanoscale 2019, 11, 6982–6989. [DOI] [PubMed] [Google Scholar]
- (138).Siwy ZS Ion-Current Rectification in Nanopores and Nanotubes with Broken Symmetry. Adv. Funct. Mater 2006, 16, 735–746. [Google Scholar]
- (139).White HS; Bund A Ion Current Rectification at Nanopores in Glass Membranes. Langmuir 2008, 24, 2212–2218. [DOI] [PubMed] [Google Scholar]
- (140).Kovarik ML; Zhou K; Jacobson SC Effect of Conical Nanopore Diameter on Ion Current Rectification. J. Phys. Chem. B 2009, 113, 15960–15966. [DOI] [PubMed] [Google Scholar]
- (141).Sa N; Baker LA Rectification of Nanopores at Surfaces. J. Am. Chem. Soc 2011, 133, 10398–10401. [DOI] [PMC free article] [PubMed] [Google Scholar]
- (142).Clarke RW; Zhukov A; Richards O; Johnson N; Ostanin V; Klenerman D Pipette-Surface Interaction: Current Enhancement and Intrinsic Force. J. Am. Chem. Soc 2013, 135, 322–329. [DOI] [PubMed] [Google Scholar]
- (143).Guerrette JP; Zhang B Scan-Rate-Dependent Current Rectification of Cone-Shaped Silica Nanopores in Quartz Nanopipettes. J. Am. Chem. Soc 2010, 132, 17088–17091. [DOI] [PubMed] [Google Scholar]
- (144).Momotenko D; Girault HH Scan-Rate-Dependent Ion Current Rectification and Rectification Inversion in Charged Conical Nanopores. J. Am. Chem. Soc 2011, 133, 14496–14499. [DOI] [PubMed] [Google Scholar]
- (145).Page A; Perry D; Young P; Mitchell D; Frenguelli BG; Unwin PR Fast Nanoscale Surface Charge Mapping with Pulsed-Potential Scanning Ion Conductance Microscopy. Anal. Chem 2016, 88, 10854–10859. [DOI] [PubMed] [Google Scholar]
- (146).Chen BP; Perry D; Page A; Kang M; Unwin PR Scanning Ion Conductance Microscopy: Quantitative Nanopipette Delivery-Substrate Electrode Collection Measurements and Mapping. Anal. Chem 2019, 91, 2516–2524. [DOI] [PubMed] [Google Scholar]
- (147).Maddar FM; Perry D; Brooks R; Page A; Unwin PR Nanoscale Surface Charge Visualization of Human Hair. Anal. Chem 2019, 91, 4632–4639. [DOI] [PubMed] [Google Scholar]
- (148).Zhu C; Zhou L; Choi M; Baker LA Mapping Surface Charge of Individual Microdomains with Scanning Ion Conductance Microscopy. ChemElectroChem 2018, 5, 2986–2990. [Google Scholar]
- (149).Cremin K; Jones B; Teahan J; Meloni GN; Perry D; Zerfass C; Asally M; Soyer OS; Unwin PR Scanning Ion Conductance Microscopy Reveals Differences in the Ionic Environments of Gram Positive and Negative Bacteria. Anal. Chem 2020 [DOI] [PubMed] [Google Scholar]
- (150).Klausen LH; Fuhs T; Dong MD Mapping Surface Charge Density of Lipid Bilayers by Quantitative Surface Conductivity Microscopy. Nat. Commun 2016, 7, 12447. [DOI] [PMC free article] [PubMed] [Google Scholar]
- (151).Jin R; Ye XD; Fan J; Jiang DC; Chen HY In Situ Imaging of Photocatalytic Activity at Titanium Dioxide Nanotubes Using Scanning Ion Conductance Microscopy. Anal. Chem 2019, 91, 2605–2609. [DOI] [PubMed] [Google Scholar]
- (152).Fuhs T; Klausen LH; Sonderskov SM; Han XJ; Dong MD Direct Measurement of Surface Charge Distribution in Phase Separating Supported Lipid Bilayers. Nanoscale 2018, 10, 4538–4544. [DOI] [PubMed] [Google Scholar]
- (153).Møller Sønderskov S; Hyldgaard Klausen L; Amland Skaanvik S; Han X; Dong M In Situ Surface Charge Density Visualization of Self-Assembled DNA Nanostructures after Ion Exchange. ChemPhysChem 2020, 21, 1474–1482. [DOI] [PMC free article] [PubMed] [Google Scholar]
- (154).Chen F; Panday N; Li X; Ma T; Guo J; Wang X; Kos L; Hu K; Gu N; He J Simultaneous Mapping of Nanoscale Topography and Surface Potential of Charged Surfaces by Scanning Ion Conductance Microscopy. Nanoscale 2020, 12, 20737–20748. [DOI] [PubMed] [Google Scholar]
- (155).Van Itallie CM; Anderson JM Claudins and Epithelial Paracellular Transport. Annu. Rev. Physiol 2006, 68, 403–429. [DOI] [PubMed] [Google Scholar]
- (156).Tsukita S; Furuse M; Itoh M Multifunctional Strands in Tight Junctions. Nat. Rev. Mol. Cell Biol 2001, 2, 285–293. [DOI] [PubMed] [Google Scholar]
- (157).Van Itallie C; Rahner C; Anderson JM Regulated Expression of Claudin-4 Decreases Paracellular Conductance through a Selective Decrease in Sodium Permeability. J. Clin. Invest 2001, 107, 1319–1327. [DOI] [PMC free article] [PubMed] [Google Scholar]
- (158).Hamill OP; Marty A; Neher E; Sakmann B; Sigworth FJ Improved Patch-Clamp Techniques for High-Resolution Current Recording from Cells and Cell-Free Membrane Patches. Pfluegers Arch. 1981, 391, 85–100. [DOI] [PubMed] [Google Scholar]
- (159).Chen CC; Zhou Y; Baker LA Single-Nanopore Investigations with Ion Conductance Microscopy. ACS Nano 2011, 5, 8404–8411. [DOI] [PMC free article] [PubMed] [Google Scholar]
- (160).Zhou Y; Chen CC; Baker LA Heterogeneity of Multiple-Pore Membranes Investigated with Ion Conductance Microscopy. Anal. Chem 2012, 84, 3003–3009. [DOI] [PMC free article] [PubMed] [Google Scholar]
- (161).Gitter AH; Bertog M; Schulzke JD; Fromm M Measurement of Paracellular Epithelial Conductivity by Conductance Scanning. Pfluegers Arch. 1997, 434, 830–840. [DOI] [PubMed] [Google Scholar]
- (162).Cereijido M; Stefani E; Palomo AM Occluding Junctions in a Cultured Transporting Epithelium: Structural and Functional Heterogeneity. J. Membr. Biol 1980, 53, 19–32. [DOI] [PubMed] [Google Scholar]
- (163).Zhou LS; Zhou Y; Shi WQ; Baker LA Alternating Current Potentiometric Scanning Ion Conductance Microscopy (AC-PSICM). J. Phys. Chem. C 2015, 119, 14392–14399. [Google Scholar]
- (164).Pellegrino M; Orsini P; Pellegrini M; Baschieri P; Dinelli F; Petracchi D; Tognoni E; Ascoli C Weak Hydrostatic Forces in Far-Scanning Ion Conductance Microscopy Used to Guide Neuronal Growth Cones. Neurosci. Res 2011, 69, 234–240. [DOI] [PubMed] [Google Scholar]
- (165).Mannelquist A; Iwamoto H; Szabo G; Shao Z Near Field Optical Microscopy in Aqueous Solution: Implementation and Characterization of a Vibrating Probe. J. Microsc 2002, 205, 53–60. [DOI] [PubMed] [Google Scholar]
- (166).Rothery A; Gorelik J; Bruckbauer A; Yu W; Korchev Y; Klenerman D A Novel Light Source for SICM-SNOM of Living Cells. J. Microsc 2003, 209, 94–101. [DOI] [PubMed] [Google Scholar]
- (167).Piper JD; Li C; Lo C-J; Berry R; Korchev Y; Ying L; Klenerman D Characterization and Application of Controllable Local Chemical Changes Produced by Reagent Delivery from a Nanopipet. J. Am. Chem. Soc 2008, 130, 10386–10393. [DOI] [PubMed] [Google Scholar]
- (168).Nikolaev VO; Moshkov A; Lyon AR; Miragoli M; Novak P; Paur H; Lohse MJ; Korchev YE; Harding SE; Gorelik J β2- Adrenergic Receptor Redistribution in Heart Failure Changes Camp Compartmentation. Science 2010, 327, 1653–1657. [DOI] [PubMed] [Google Scholar]
- (169).Comstock DJ; Elam JW; Pellin MJ; Hersam MC Integrated Ultramicroelectrode-Nanopipet Probe for Concurrent Scanning Electrochemical Microscopy and Scanning Ion Conductance Microscopy. Anal. Chem 2010, 82, 1270–1276. [DOI] [PubMed] [Google Scholar]
- (170).Takahashi Y; Shevchuk AI; Novak P; Murakami Y; Shiku H; Korchev YE; Matsue T Simultaneous Noncontact Topography and Electrochemical Imaging by SECM/SICM Featuring Ion Current Feedback Regulation. J. Am. Chem. Soc 2010, 132, 10118–10126. [DOI] [PubMed] [Google Scholar]
- (171).Morris CA; Chen CC; Baker LA Transport of Redox Probes through Single Pores Measured by Scanning Electrochemical-Scanning Ion Conductance Microscopy (SECM-SICM). Analyst 2012, 137, 2933–2938. [DOI] [PubMed] [Google Scholar]
- (172).Thakar R; Weber AE; Morris CA; Baker LA Multifunctional Carbon Nanoelectrodes Fabricated by Focused Ion Beam Milling. Analyst 2013, 138, 5973–5982. [DOI] [PubMed] [Google Scholar]
- (173).Korchev YE; Negulyaev YA; Edwards CR; Vodyanoy I; Lab MJ Functional Localization of Single Active Ion Channels on the Surface of a Living Cell. Nat. Cell Biol 2000, 2, 616–619. [DOI] [PubMed] [Google Scholar]
- (174).Gorelik J; Gu Y; Spohr HA; Shevchuk AI; Lab MJ; Harding SE; Edwards CR; Whitaker M; Moss GW; Benton DC Ion Channels in Small Cells and Subcellular Structures Can Be Studied with a Smart Patch-Clamp System. Biophys. J 2002, 83, 3296–3303. [DOI] [PMC free article] [PubMed] [Google Scholar]
- (175).Zhou Y; Bright LK; Shi WQ; Aspinwall CA; Baker LA Ion Channel Probes for Scanning Ion Conductance Microscopy. Langmuir 2014, 30, 15351–15355. [DOI] [PMC free article] [PubMed] [Google Scholar]
- (176).Dorwling-Carter L; Aramesh M; Han H; Zambelli T; Momotenko D Combined Ion Conductance and Atomic Force Microscope for Fast Simultaneous Topographical and Surface Charge Imaging. Anal. Chem 2018, 90, 11453–11460. [DOI] [PubMed] [Google Scholar]
- (177).Ossola D; Dorwling-Carter L; Dermutz H; Behr P; Voros J; Zambelli T Simultaneous Scanning Ion Conductance Microscopy and Atomic Force Microscopy with Microchanneled Cantileverssi-multaneous Scanning Ion Conductance Microscopy and Atomic Force Microscopy with Microchanneled Cantilevers. Phys. Rev. Lett 2015, 115, 238103. [DOI] [PubMed] [Google Scholar]
- (178).Aramesh M; Forró C; Dorwling-Carter L; Lüchtefeld I; Schlotter T; Ihle SJ; Shorubalko I; Hosseini V; Momotenko D; Zambelli T; et al. Localized Detection of Ions and Biomolecules with a Force-Controlled Scanning Nanopore Microscope. Nat. Nanotechnol 2019, 14, 791–798. [DOI] [PubMed] [Google Scholar]
- (179).Korchev YE; Raval M; Lab MJ; Gorelik J; Edwards CR; Rayment T; Klenerman D Hybrid Scanning Ion Conductance and Scanning near-Field Optical Microscopy for the Study of Living Cells. Biophys. J 2000, 78, 2675–2679. [DOI] [PMC free article] [PubMed] [Google Scholar]
- (180).Babakinejad B; Jönsson P; López Córdoba A; Actis P; Novak P; Takahashi Y; Shevchuk A; Anand U; Anand P; Drews A Local Delivery of Molecules from a Nanopipette for Quantitative Receptor Mapping on Live Cells. Anal. Chem 2013, 85, 9333–9342. [DOI] [PubMed] [Google Scholar]
- (181).Shevchuk AI; Hobson P; Lab MJ; Klenerman D; Krauzewicz N; Korchev YE Imaging Single Virus Particles on the Surface of Cell Membranes by High-Resolution Scanning Surface Confocal Microscopy. Biophys. J 2008, 94, 4089–4094. [DOI] [PMC free article] [PubMed] [Google Scholar]
- (182).Kemp SJ; Thorley AJ; Gorelik J; Seckl MJ; O’Hare MJ; Arcaro A; Korchev Y; Goldstraw P; Tetley TD Immortalization of Human Alveolar Epithelial Cells to Investigate Nanoparticle Uptake. Am. J. Respir. Cell Mol. Biol 2008, 39, 591–597. [DOI] [PMC free article] [PubMed] [Google Scholar]
- (183).Shevchuk AI; Hobson P; Lab MJ; Klenerman D; Krauzewicz N; Korchev YE Endocytic Pathways: Combined Scanning Ion Conductance and Surface Confocal Microscopy Study. Pfluegers Arch. 2008, 456, 227–235. [DOI] [PMC free article] [PubMed] [Google Scholar]
- (184).Ali T; Bednarska J; Vassilopoulos S; Tran M; Diakonov IA; Ziyadeh-Isleem A; Guicheney P; Gorelik J; Korchev YE; Reilly MM; et al. Correlative SICM-FCM Reveals Changes in Morphology and Kinetics of Endocytic Pits Induced by Disease-Associated Mutations in Dynamin. FASEB J. 2019, 33, 8504–8518. [DOI] [PMC free article] [PubMed] [Google Scholar]
- (185).Lyon AR; Nikolaev VO; Miragoli M; Sikkel MB; Paur H; Benard L; Hulot JS; Kohlbrenner E; Hajjar RJ; Peters NS; et al. Plasticity of Surface Structures and β2-Adrenergic Receptor Localization in Failing Ventricular Cardiomyocytes During Recovery from Heart Failure. Circ.: Heart Failure 2012, 5, 357–365. [DOI] [PMC free article] [PubMed] [Google Scholar]
- (186).Wright PT; Nikolaev VO; O’Hara T; Diakonov I; Bhargava A; Tokar S; Schobesberger S; Shevchuk AI; Sikkel MB; Wilkinson R; et al. Caveolin-3 Regulates Compartmentation of Cardiomyocyte β2-Adrenergic Receptor-Mediated Camp Signaling. J. Mol. Cell. Cardiol 2014, 67, 38–48. [DOI] [PMC free article] [PubMed] [Google Scholar]
- (187).Subramanian H; Froese A; Jonsson P; Schmidt H; Gorelik J; Nikolaev VO Distinct Submembrane Localisation Compartmentalises Cardiac NPR1 and NPR2 Signalling to cGMP. Nat. Commun 2018, 9, 2446. [DOI] [PMC free article] [PubMed] [Google Scholar]
- (188).Wright PT; Sanchez-Alonso JL; Lucarelli C; Alvarez-Laviada A; Poulet CE; Bello SO; Faggian G; Terracciano CM; Gorelik J Partial Mechanical Unloading of the Heart Disrupts L-Type Calcium Channel and β-Adrenoceptor Signaling Microdomains. Front. Physiol 2018, 9, 1302. [DOI] [PMC free article] [PubMed] [Google Scholar]
- (189).Schobesberger S; Wright PT; Poulet C; Sanchez Alonso Mardones JL; Mansfield C; Friebe A; Harding SE; Balligand J-L; Nikolaev VO; Gorelik J B3-Adrenoceptor Redistribution Impairs NO/ cGMP/PDE2 Signalling in Failing Cardiomyocytes. eLife 2020, 9, No. e52221. [DOI] [PMC free article] [PubMed] [Google Scholar]
- (190).Hennig S; van de Linde S; Bergmann S; Huser T; Sauer M Quantitative Super-Resolution Microscopy of Nanopipette-Deposited Fluorescent Patterns. ACS Nano 2015, 9, 8122–8130. [DOI] [PubMed] [Google Scholar]
- (191).Hennig S; van de Linde S; Lummer M; Simonis M; Huser T; Sauer M Instant Live-Cell Super-Resolution Imaging of Cellular Structures by Nanoinjection of Fluorescent Probes. Nano Lett. 2015, 15, 1374–1381. [DOI] [PubMed] [Google Scholar]
- (192).Hagemann P; Gesper A; Happel P Correlative Stimulated Emission Depletion and Scanning Ion Conductance Microscopy. ACS Nano 2018, 12, 5807–5815. [DOI] [PubMed] [Google Scholar]
- (193).Shi WQ; Baker LA Imaging Heterogeneity and Transport of Degraded Nafion Membranes. RSC Adv. 2015, 5, 99284–99290. [Google Scholar]
- (194).Morris CA; Chen CC; Ito T; Baker LA Local pH Measurement with Scanning Ion Conductance Microscopy. J. Electrochem. Soc 2013, 160, H430–H435. [Google Scholar]
- (195).Zhang Y; Takahashi Y; Hong SP; Liu F; Bednarska J; Goff PS; Novak P; Shevchuk A; Gopal S; Barozzi I; et al. High-Resolution Label-Free 3D Mapping of Extracellular pH of Single Living Cells. Nat. Commun 2019, 10, 5610. [DOI] [PMC free article] [PubMed] [Google Scholar]
- (196).Denk W Two-Photon Scanning Photochemical Microscopy: Mapping Ligand-Gated Ion Channel Distributions. Proc. Natl. Acad. Sci. U. S. A 1994, 91, 6629. [DOI] [PMC free article] [PubMed] [Google Scholar]
- (197).Ianoul A; Street M; Grant D; Pezacki J; Taylor RS; Johnston LJ Near-Field Scanning Fluorescence Microscopy Study of Ion Channel Clusters in Cardiac Myocyte Membranes. Biophys. J 2004, 87, 3525–3535. [DOI] [PMC free article] [PubMed] [Google Scholar]
- (198).Liao M; Cao E; Julius D; Cheng Y Structure of the TRPV1 Ion Channel Determined by Electron Cryo-Microscopy. Nature 2013, 504, 107–112. [DOI] [PMC free article] [PubMed] [Google Scholar]
- (199).Sakmann B; Neher E Patch Clamp Techniques for Studying Ionic Channels in Excitable Membranes. Annu. Rev. Physiol 1984, 46, 455–472. [DOI] [PubMed] [Google Scholar]
- (200).Trouet D; Nilius B; Voets T; Droogmans G; Eggermont J Use of a Bicistronic GFP-Expression Vector to Characterise Ion Channels after Transfection in Mammalian Cells. Pfluegers Arch. 1997, 434, 632–638. [DOI] [PubMed] [Google Scholar]
- (201).Bhargava A; Lin XM; Novak P; Mehta K; Korchev Y; Delmar M; Gorelik J Super-Resolution Scanning Patch Clamp Reveals Clustering of Functional Ion Channels in Adult Ventricular Myocyte. Circ. Res 2013, 112, 1112–1120. [DOI] [PMC free article] [PubMed] [Google Scholar]
- (202).Novak P; Gorelik J; Vivekananda U; Shevchuk AI; Ermolyuk YS; Bailey RJ; Bushby AJ; Moss GWJ; Rusakov DA; Klenerman D; et al. Nanoscale-Targeted Patch-Clamp Recordings of Functional Presynaptic Ion Channels. Neuron 2013, 79, 1067–1077. [DOI] [PMC free article] [PubMed] [Google Scholar]
- (203).Glukhov AV; Balycheva M; Sanchez-Alonso JL; Ilkan Z; Alvarez-Laviada A; Bhogal N; Diakonov I; Schobesberger S; Sikkel MB; Bhargava A; et al. Direct Evidence for Microdomain-Specific Localization and Remodeling of Functional L-Type Calcium Channels in Rat and Human Atrial Myocytes. Circulation 2015, 132, 2372–2384. [DOI] [PMC free article] [PubMed] [Google Scholar]
- (204).Suarez-Isla BA; Wan K; Lindstrom J; Montal M Single-Channel Recordings from Purified Acetylcholine Receptors Reconstituted in Bilayers Formed at the Tip of Patch Pipets. Biochemistry 1983, 22, 2319–2323. [DOI] [PubMed] [Google Scholar]
- (205).Hanke W; Methfessel C; Wilmsen U; Boheim G Ion Channel Reconstitution into Lipid Bilayer Membranes on Glass Patch Pipettes. Bioelectrochem. Bioenerg 1984, 12, 329–339. [Google Scholar]
- (206).Macazo FC; White RJ Bioinspired Protein Channel-Based Scanning Ion Conductance Microscopy (Bio-SICM) for Simultaneous Conductance and Specific Molecular Imaging. J. Am. Chem. Soc 2016, 138, 2793–2801. [DOI] [PMC free article] [PubMed] [Google Scholar]
- (207).Shoji K; Kawano R; White RJ Spatially Resolved Chemical Detection with a Nanoneedle-Probe-Supported Biological Nanopore. ACS Nano 2019, 13, 2606–2614. [DOI] [PubMed] [Google Scholar]
- (208).Shi WQ; Zeng YH; Zhou LS; Xiao YC; Cummins TR; Baker LA Membrane Patches as Ion Channel Probes for Scanning Ion Conductance Microscopy. Faraday Discuss. 2016, 193, 81–97. [DOI] [PubMed] [Google Scholar]
- (209).Shi WQ; Zeng YH; Zhu C; Xiao YC; Cummins TR; Hou JH; Baker LA Characterization of Membrane Patch-Ion Channel Probes for Scanning Ion Conductance Microscopy. Small 2018, 14, 1702945. [DOI] [PMC free article] [PubMed] [Google Scholar]
- (210).Medvedeva M; Barinova K; Melnikova A; Semenyuk P; Kolmogorov V; Gorelkin P; Erofeev A; Muronetz V Naturally Occurring Cinnamic Acid Derivatives Prevent Amyloid Transformation of Alpha-Synuclein. Biochimie 2020, 170, 128–139. [DOI] [PubMed] [Google Scholar]
- (211).Gesper A; Wennmalm S; Hagemann P; Eriksson S-G; Happel P; Parmryd I Variations in Plasma Membrane Topography Can Explain Heterogenous Diffusion Coefficients Obtained by Fluorescence Correlation Spectroscopy. Front. Cell Dev. Biol 2020, 8 DOI: 10.3389/fcell.2020.00767. [DOI] [PMC free article] [PubMed] [Google Scholar]
- (212).Gorelik J; Zhang Y; Shevchuk AI; Frolenkov GI; Sánchez D; Lab MJ; Vodyanoy I; Edwards CR; Klenerman D; Korchev YE The Use of Scanning Ion Conductance Microscopy to Image A6 Cells. Mol. Cell. Endocrinol 2004, 217, 101–108. [DOI] [PubMed] [Google Scholar]
- (213).Lee SR; Hwang HJ; Yoon JG; Bae EY; Goo KS; Cho SJ; Cho JA Anti-Inflammatory Effect of Lycium Barbarum on Polarized Human Intestinal Epithelial Cells. Nutr. Res. Pract 2019, 13, 95–104. [DOI] [PMC free article] [PubMed] [Google Scholar]
- (214).Alesutan I; Seifert J; Pakladok T; Rheinlaender J; Lebedeva A; Towhid ST; Stournaras C; Voelkl J; Schäffer TE; Lang F Chorein Sensitivity of Actin Polymerization, Cell Shape and Mechanical Stiffness of Vascular Endothelial Cells. Cell. Physiol. Biochem 2013, 32, 728–742. [DOI] [PubMed] [Google Scholar]
- (215).Liu BC; Song X; Lu XY; Fang CZ; Wei SP; Alli AA; Eaton DC; Shen BZ; Li XQ; Ma HP Lovastatin Attenuates Effects of Cyclosporine a on Tight Junctions and Apoptosis in Cultured Cortical Collecting Duct Principal Cells. Am. J. Physiol. Renal Physiol 2013, 305, F304–F313. [DOI] [PMC free article] [PubMed] [Google Scholar]
- (216).Potter CMF; Schobesberger S; Lundberg MH; Weinberg PD; Mitchell JA; Gorelik J Shape and Compliance of Endothelial Cells after Shear Stress in Vitro or from Different Aortic Regions: Scanning Ion Conductance Microscopy Study. PLoS One 2012, 7, No. e31228. [DOI] [PMC free article] [PubMed] [Google Scholar]
- (217).Lyon AR; MacLeod KT; Zhang Y; Garcia E; Kanda GK; Lab MJ; Korchev YE; Harding SE; Gorelik J Loss of T-Tubules and Other Changes to Surface Topography in Ventricular Myocytes from Failing Human and Rat Heart. Proc. Natl. Acad. Sci. U. S. A 2009, 106, 6854–6859. [DOI] [PMC free article] [PubMed] [Google Scholar]
- (218).Ibrahim M; Kukadia P; Siedlecka U; Cartledge JE; Navaratnarajah M; Tokar S; Van Doorn C; Tsang VT; Gorelik J; Yacoub MH; et al. Cardiomyocyte Ca2+ Handling and Structure Is Regulated by Degree and Duration of Mechanical Load Variation. J. Cell Mol. Med 2012, 16, 2910–2918. [DOI] [PMC free article] [PubMed] [Google Scholar]
- (219).Mann S; Meyer J; Dietzel I Integration of a Scanning Ion Conductance Microscope into Phase Contrast Optics and Its Application to the Quantification of Morphological Parameters of Selected Cells. J. Microsc 2006, 224, 152–157. [DOI] [PubMed] [Google Scholar]
- (220).Liu X; Yang X; Zhang B; Zhang XF; Lu HJ; Zhang JN; Zhang YJ High-Resolution Morphological Identification and Characterization of Living Neuroblastoma SK-N-SH Cells by Hopping Probe Ion Conductance Microscopy. Brain Res. 2011, 1386, 35–40. [DOI] [PubMed] [Google Scholar]
- (221).Rabinowitz JH; Jayant K; Edwards MA; Sahin O; Yuste R; Shepard KL Hopping-Mode Scanning Ion-Conductance Microscopy Resolution During Synaptic Imaging. Biophys. J 2018, 114, 670A–670A. [Google Scholar]
- (222).Kraus MJ; Seifert J; Strasser EF; Gawaz M; Schäffer TE; Rheinlaender J Comparative Morphology Analysis of Live Blood Platelets Using Scanning Ion Conductance and Robotic Dark-Field Microscopy. Platelets 2016, 27, 541–546. [DOI] [PubMed] [Google Scholar]
- (223).Sun T; Donoghue PS; Higginson JR; Gadegaard N; Barnett SC; Riehle MO The Interactions of Astrocytes and Fibroblasts with Defined Pore Structures in Static and Perfusion Cultures. Biomaterials 2011, 32, 2021–2031. [DOI] [PMC free article] [PubMed] [Google Scholar]
- (224).Gorelik J; Ali NN; Sheikh Abdul Kadir SH; Lab M; Stojkovic P; Armstrong L; Sviderskaya EV; Negulyaev YA; Klenerman D; Bennett DC Non-Invasive Imaging of Stem Cells by Scanning Ion Conductance Microscopy: Future Perspective. Tissue Eng., Part C 2008, 14, 311–318. [DOI] [PMC free article] [PubMed] [Google Scholar]
- (225).Park SH; Kim A; An J; Cho HS; Kang TM Nanoscale Imaging of Rat Atrial Myocytes by Scanning Ion Conductance Microscopy Reveals Heterogeneity of T-Tubule Openings and Ultrastructure of the Cell Membrane. Korean J. Physiol. Pharmacol 2020, 24, 529–543. [DOI] [PMC free article] [PubMed] [Google Scholar]
- (226).Gorelik J; Yang LQ; Zhang Y; Lab M; Korchev Y; Harding SE A Novel Z-Groove Index Characterizing Myocardial Surface Structure. Cardiovasc. Res 2006, 72, 422–429. [DOI] [PubMed] [Google Scholar]
- (227).Korchev YE; Gorelik J; Lab MJ; Sviderskaya EV; Johnston CL; Coombes CR; Vodyanoy I; Edwards CR Cell Volume Measurement Using Scanning Ion Conductance Microscopy. Biophys. J 2000, 78, 451–457. [DOI] [PMC free article] [PubMed] [Google Scholar]
- (228).Kim J; Choi M; Jung GE; Ferhan AR; Cho NJ; Cho SJ Dimensional Comparison between Amplitude-Modulation Atomic Force Microscopy and Scanning Ion Conductance Microscopy of Biological Samples. Jpn. J. Appl. Phys 2016, 55, No. 08NB18. [Google Scholar]
- (229).Zhang S; Cho SJ; Busuttil K; Wang C; Besenbacher F; Dong MD Scanning Ion Conductance Microscopy Studies of Amyloid Fibrils at Nanoscale. Nanoscale 2012, 4, 3105–3110. [DOI] [PubMed] [Google Scholar]
- (230).Seifert J; Rheinlaender J; Novak P; Korchev YE; Schäffer TE Comparison of Atomic Force Microscopy and Scanning Ion Conductance Microscopy for Live Cell Imaging. Langmuir 2015, 31, 6807–6813. [DOI] [PubMed] [Google Scholar]
- (231).Zhou YS; Saito M; Miyamoto T; Novak P; Shevchuk AI; Korchev YE; Fukuma T; Takahashi Y Nanoscale Imaging of Primary Cilia with Scanning Ion Conductance Microscopy. Anal. Chem 2018, 90, 2891–2895. [DOI] [PubMed] [Google Scholar]
- (232).Adobes-Vidal M; Maddar FM; Momotenko D; Hughes LP; Wren SAC; Poloni LN; Ward MD; Unwin PR Face-Discriminating Dissolution Kinetics of Furosemide Single Crystals: In Situ Three-Dimensional Multi-Microscopy and Modeling. Cryst. Growth Des 2016, 16, 4421–4429. [Google Scholar]
- (233).Adobes-Vidal M; Shtukenberg AG; Ward MD; Unwin PR Multiscale Visualization and Quantitative Analysis of (L)-Cystine Crystal Dissolution. Cryst. Growth Des 2017, 17, 1766–1774. [Google Scholar]
- (234).Qin XL; Zhang XH; Wang MH; Dong YF; Liu JJ; Zhu ZW; Li MX; Yang D; Shao YH Fabrication of Tris(Bipyridine)Ruthenium(II)-Functionalized Metal-Organic Framework Thin Films by Electrochemically Assisted Self-Assembly Technique for Electrochemiluminescent Immunoassay. Anal. Chem 2018, 90, 11622–11628. [DOI] [PubMed] [Google Scholar]
- (235).Laslau C; Williams DE; Wright BE; Travas-Sejdic J Measuring the Ionic Flux of an Electrochemically Actuated Conducting Polymer Using Modified Scanning Ion Conductance Microscopy. J. Am. Chem. Soc 2011, 133, 5748–5751. [DOI] [PubMed] [Google Scholar]
- (236).Beaulieu LY; Beattie SD; Hatchard TD; Dahn JR The Electrochemical Reaction of Lithium with Tin Studied by in Situ AFM. J. Electrochem. Soc 2003, 150, A419. [Google Scholar]
- (237).Tao L; Qiao M; Jin R; Li Y; Xiao ZH; Wang YQ; Zhang NN; Xie C; He QG; Jiang DC; et al. Bridging the Surface Charge and Catalytic Activity of a Defective Carbon Electrocatalyst. Angew. Chem., Int. Ed 2019, 58, 1019–1024. [DOI] [PubMed] [Google Scholar]
- (238).Su SW; Chieng A; Parres-Gold J; Chang MG; Wang YX Real-Time Determination of Aggregated Alpha-Synuclein Induced Membrane Disruption at Neuroblastoma Cells Using Scanning Ion Conductance Microscopy. Faraday Discuss. 2018, 210, 131–143. [DOI] [PMC free article] [PubMed] [Google Scholar]
- (239).Schultz F; Swiatlowska P; Alvarez-Laviada A; Sanchez-Alonso JL; Song Q; Vries AAF; Pijnappels DA; Ongstad E; Braga VMM; Entcheva E; Gourdie RG; Miragoli M; Gorelik J; et al. Cardiomyocyte-Myofibroblast Contact Dynamism Is Modulated by Connexin-43. FASEB J. 2019, 33, 10453–10468. [DOI] [PMC free article] [PubMed] [Google Scholar]
- (240).Simeonov S; Schäffer TE Ultrafast Imaging of Cardiomyocyte Contractions by Combining Scanning Ion Conductance Microscopy with a Microelectrode Array. Anal. Chem 2019, 91, 9648–9655. [DOI] [PubMed] [Google Scholar]
- (241).Wang K; Zhou L; Li J; Liu W; Wei Y; Guo Z; Fan C; Hu J; Li B; Wang L Label-Free and Three-Dimensional Visualization Reveals the Dynamics of Plasma Membrane-Derived Extracellular Vesicles. Nano Lett. 2020, 20, 6313–6319. [DOI] [PubMed] [Google Scholar]
- (242).Parres-Gold J; Chieng A; Wong Su S; Wang Y Real-Time Characterization of Cell Membrane Disruption by α-Synuclein Oligomers in Live SH-SY5Y Neuroblastoma Cells. ACS Chem. Neurosci 2020, 11, 2528–2534. [DOI] [PMC free article] [PubMed] [Google Scholar]
- (243).Liu X; Li Y; Zhu H; Zhao ZL; Zhou Y; Zaske AM; Liu L; Li M; Lu HJ; Liu W; et al. Use of Non-Contact Hopping Probe Ion Conductance Microscopy to Investigate Dynamic Morphology of Live Platelets. Platelets 2015, 26, 480–485. [DOI] [PubMed] [Google Scholar]
- (244).Chatterjee M; Rath D; Schlotterbeck J; Rheinlaender J; Walker-Allgaier B; Alnaggar N; Zdanyte M; Muller I; Borst O; Geisler T; et al. Regulation of Oxidized Platelet Lipidome: Implications for Coronary Artery Disease. Eur. Heart J 2017, 38, 1993–2005. [DOI] [PubMed] [Google Scholar]
- (245).Seifert J; Rheinlaender J; Lang F; Gawaz M; Schäffer TE Thrombin-Induced Cytoskeleton Dynamics in Spread Human Platelets Observed with Fast Scanning Ion Conductance Microscopy. Sci. Rep 2017, 7, 4810. [DOI] [PMC free article] [PubMed] [Google Scholar]
- (246).Zhu C; Shi WQ; Daleke DL; Baker LA Monitoring Dynamic Spiculation in Red Blood Cells with Scanning Ion Conductance Microscopy. Analyst 2018, 143, 1087–1093. [DOI] [PubMed] [Google Scholar]
- (247).Bednarska J; Pelchen-Matthews A; Novak P; Burden JJ; Summers PA; Kuimova MK; Korchev Y; Marsh M; Shevchuk A Rapid Formation of Human Immunodeficiency Virus-Like Particles. Proc. Natl. Acad. Sci. U. S. A 2020, 117, 21637. [DOI] [PMC free article] [PubMed] [Google Scholar]
- (248).Happel P; Moller K; Schwering NK; Dietzel ID Migrating Oligodendrocyte Progenitor Cells Swell Prior to Soma Dislocation. Sci. Rep 2013, 3, 1806. [DOI] [PMC free article] [PubMed] [Google Scholar]
- (249).Gorelik J; Shevchuk AI; Frolenkov GI; Diakonov IA; Lab MJ; Kros CJ; Richardson GP; Vodyanoy I; Edwards CRW; Klenerman D; Korchev YE Dynamic Assembly of Surface Structures in Living Cells. Proc. Natl. Acad. Sci. U. S. A 2003, 100, 5819–5822. [DOI] [PMC free article] [PubMed] [Google Scholar]
- (250).Navikas V; Leitão SM; Marion S; Davis SJ; Drake B; Fantner GE; Radenovic A High-Throughput Nanocapillary Filling Enabled by Microwave Radiation for Scanning Ion Conductance Microscopy Imaging. ACS Appl. Nano Mater 2020, 3, 7829–7834. [DOI] [PMC free article] [PubMed] [Google Scholar]
- (251).Wu L; Liu T; Gu Y Microvillar Dynamic in Renal Tubular Epithelial Cells Mediated by Insulin/Plcγ Signal Pathway. Biochem. Biophys. Res. Commun 2020. DOI: 10.1016/j.bbrc.2020.10.046 [DOI] [PubMed] [Google Scholar]
- (252).Ruenraroengsak P; Novak P; Berhanu D; Thorley AJ; Valsami-Jones E; Gorelik J; Korchev YE; Tetley TD Respiratory Epithelial Cytotoxicity and Membrane Damage (Holes) Caused by Amine-Modified Nanoparticles. Nanotoxicology 2012, 6, 94–108. [DOI] [PubMed] [Google Scholar]
- (253).Yang X; Liu X; Lu HJ; Zhang XF; Ma LY; Gao RL; Zhang YJ Real-Time Investigation of Acute Toxicity of Zno Nanoparticles on Human Lung Epithelia with Hopping Probe Ion Conductance Microscopy. Chem. Res. Toxicol 2012, 25, 297–304. [DOI] [PubMed] [Google Scholar]
- (254).Lee Y; Jung GE; Cho SJ; Geckeler KE; Fuchs H Cellular Interactions of Doxorubicin-Loaded DNA-Modified Halloy-site Nanotubes. Nanoscale 2013, 5, 8577–8585. [DOI] [PubMed] [Google Scholar]
- (255).Miragoli M; Novak P; Ruenraroengsak P; Shevchuk AI; Korchev YE; Lab MJ; Tetley TD; Gorelik J Functional Interaction between Charged Nanoparticles and Cardiac Tissue: A New Paradigm for Cardiac Arrhythmia? Nanomedicine 2013, 8, 725–737. [DOI] [PMC free article] [PubMed] [Google Scholar]
- (256).Shan YP; Panday N; Myoung Y; Twomey M; Wang XW; Li WZ; Celik E; Moy V; Wang HD; Moon JH; et al. Scanning Ion Conductance Microscopic Study for Cellular Uptake of Cationic Conjugated Polymer Nanoparticles. Macromol. Biosci 2016, 16, 599–607. [DOI] [PubMed] [Google Scholar]
- (257).Chen YX; Sukhorukov GB; Novak P Visualising Nanoscale Restructuring of a Cellular Membrane Triggered by Polyelectrolyte Microcapsules. Nanoscale 2018, 10, 16902–16910. [DOI] [PMC free article] [PubMed] [Google Scholar]
- (258).Shin W; Gillis KD Measurement of Changes in Membrane Surface Morphology Associated with Exocytosis Using Scanning Ion Conductance Microscopy. Biophys. J 2006, 91, L63–L65. [DOI] [PMC free article] [PubMed] [Google Scholar]
- (259).Tanaka A; Tanaka R; Kasai N; Tsukada S; Okajima T; Sumitomo K Time-Lapse Imaging of Morphological Changes in a Single Neuron During the Early Stages of Apoptosis Using Scanning Ion Conductance Microscopy. J. Struct. Biol 2015, 191, 32–38. [DOI] [PubMed] [Google Scholar]
- (260).Wang D; Wang QJ; Yan GL; Qiao Y; Sun L; Zhu BQ; Tang CC; Gu YC High Glucose and Interleukin 1β-Induced Apoptosis in Human Umbilical Vein Endothelial Cells Involves in Down-Regulation of Monocarboxylate Transporter 4. Biochem. Biophys. Res. Commun 2015, 466, 607–614. [DOI] [PubMed] [Google Scholar]
- (261).Volodkin DV; Petrov AI; Prevot M; Sukhorukov GB Matrix Polyelectrolyte Microcapsules: New System for Macromolecule Encapsulation. Langmuir 2004, 20, 3398–3406. [DOI] [PubMed] [Google Scholar]
- (262).Sukhorukov GB; Donath E; Lichtenfeld H; Knippel E; Knippel M; Budde A; Möhwald H Layer-by-Layer Self Assembly of Polyelectrolytes on Colloidal Particles. Colloids Surf., A 1998, 137, 253–266. [Google Scholar]
- (263).Bruckbauer A; Zhou D; Ying L; Korchev YE; Abell C; Klenerman D Multicomponent Submicron Features of Biomolecules Created by Voltage Controlled Deposition from a Nanopipet. J. Am. Chem. Soc 2003, 125, 9834–9839. [DOI] [PubMed] [Google Scholar]
- (264).Rodolfa KT; Bruckbauer A; Zhou D; Korchev YE; Klenerman D Two-Component Graded Deposition of Biomolecules with a Double-Barreled Nanopipette. Angew. Chem., Int. Ed 2005, 44, 6854–6859. [DOI] [PubMed] [Google Scholar]
- (265).Drews A; Flint J; Shivji N; Jonsson P; Wirthensohn D; De Genst E; Vincke C; Muyldermans S; Dobson C; Klenerman D Individual Aggregates of Amyloid beta Induce Temporary Calcium Influx through the Cell Membrane of Neuronal Cells. Sci. Rep 2016, 6, 31910. [DOI] [PMC free article] [PubMed] [Google Scholar]
- (266).Iwata F; Yamazaki K; Ishizaki K; Ushiki T Local Electroporation of a Single Cell Using a Scanning Ion Conductance Microscope. Jpn. J. Appl. Phys 2014, 53, No. 036701. [Google Scholar]
- (267).Adam Seger R; Actis P; Penfold C; Maalouf M; Vilozny B; Pourmand N Voltage Controlled Nano-Injection System for Single-Cell Surgery. Nanoscale 2012, 4, 5843–5846. [DOI] [PMC free article] [PubMed] [Google Scholar]
- (268).McKelvey K; Edwards MA; White HS Resistive Pulse Delivery of Single Nanoparticles to Electrochemical Interfaces. J. Phys. Chem. Lett 2016, 7, 3920–3924. [DOI] [PubMed] [Google Scholar]
- (269).Lorin C; Gueffier M; Bois P; Faivre JF; Cognard C; Sebille S Ultrastructural and Functional Alterations of EC Coupling Elements in mdx Cardiomyocytes: An Analysis from Membrane Surface to Depth. Cell Biochem. Biophys 2013, 66, 723–736. [DOI] [PubMed] [Google Scholar]
- (270).Schobesberger S; Wright P; Tokar S; Bhargava A; Mansfield C; Glukhov AV; Poulet C; Buzuk A; Monszpart A; Sikkel M; et al. T-Tubule Remodelling Disturbs Localized β2- Adrenergic Signalling in Rat Ventricular Myocytes During the Progression of Heart Failure. Cardiovasc. Res 2017, 113, 770–782. [DOI] [PMC free article] [PubMed] [Google Scholar]
- (271).Zhang H; Wu L; Huang F Electrochemical Microprocess by Scanning Ion-Conductance Microscopy. J. Vac. Sci. Technol., B: Microelectron. Process. Phenom 1999, 17, 269–272. [Google Scholar]
- (272).Müller AD; Müller F; Hietschold M Localized Electrochemical Deposition of Metals Using Micropipettes. Thin Solid Films 2000, 366, 32–36. [Google Scholar]
- (273).Sarkar S; Mandler D Scanning Electrochemical Microscopy Versus Scanning Ion Conductance Microscopy for Surface Patterning. ChemElectroChem 2017, 4, 2981–2988. [Google Scholar]
- (274).Ito S; Iwata F Nanometer-Scale Deposition of Metal Plating Using a Nanopipette Probe in Liquid Condition. Jpn. J. Appl. Phys 2011, 50, No. 08LB15. [Google Scholar]
- (275).Böcker M; Muschter S; Schmitt EK; Steinem C; Schäffer TE Imaging and Patterning of Pore-Suspending Membranes with Scanning Ion Conductance Microscopy. Langmuir 2009, 25, 3022–3028. [DOI] [PubMed] [Google Scholar]
- (276).Momotenko D; Page A; Adobes-Vidal M; Unwin PR Write-Read 3D Patterning with a Dual-Channel Nanopipette. ACS Nano 2016, 10, 8871–8878. [DOI] [PubMed] [Google Scholar]
- (277).Nakazawa K; Yoshioka M; Mizutani Y; Ushiki T; Iwata F Local Electroplating Deposition for Free-Standing Micropillars Using a Bias-Modulated Scanning Ion Conductance Microscope. Microsyst. Technol 2020, 26, 1333–1342. [Google Scholar]
- (278).Actis P; Maalouf MM; Kim HJ; Lohith A; Vilozny B; Seger RA; Pourmand N Compartmental Genomics in Living Cells Revealed by Single-Cell Nanobiopsy. ACS Nano 2014, 8, 546–553. [DOI] [PMC free article] [PubMed] [Google Scholar]
- (279).Toth EN; Lohith A; Mondal M; Guo J; Fukamizu A; Pourmand N Single-Cell Nanobiopsy Reveals Compartmentalization of mRNAs within Neuronal Cells. J. Biol. Chem 2018, 293, 4940–4951. [DOI] [PMC free article] [PubMed] [Google Scholar]
- (280).Nashimoto Y; Takahashi Y; Zhou YS; Ito H; Ida H; Ino K; Matsue T; Shiku H Evaluation of mRNA Localization Using Double Barrel Scanning Ion Conductance Microscopy. ACS Nano 2016, 10, 6915–6922. [DOI] [PubMed] [Google Scholar]
- (281).Laforge FO; Carpino J; Rotenberg SA; Mirkin MV Electrochemical Attosyringe. Proc. Natl. Acad. Sci. U. S. A 2007, 104, 11895–11900. [DOI] [PMC free article] [PubMed] [Google Scholar]
- (282).Nascimento RAS; Özel RE; Mak WH; Mulato M; Singaram B; Pourmand N Single Cell “Glucose Nanosensor” Verifies Elevated Glucose Levels in Individual Cancer Cells. Nano Lett. 2016, 16, 1194–1200. [DOI] [PMC free article] [PubMed] [Google Scholar]
- (283).Janmey PA; McCulloch CA Cell Mechanics: Integrating Cell Responses to Mechanical Stimuli. Annu. Rev. Biomed. Eng 2007, 9, 1–34. [DOI] [PubMed] [Google Scholar]
- (284).Reyes-Pardo H; Sanchez-Herrera DP Mechanosensitive Ion Channel Inhibitors Promote the Stiffening of the Plasma Membrane of Mouse Sensory Neurons. Soft Matter 2019, 15, 8320–8328. [DOI] [PubMed] [Google Scholar]
- (285).Lab MJ Scanning Ion Conductance Microscopy for Imaging and Mechanosensitive Activation of Selected Areas of Live Cells. In Mechanosensitivity of the Heart; Kamkin A; Kiseleva I, Eds.; Springer: Dordrecht, Netherlands, 2010; Vol. 3, pp 267–272. [Google Scholar]
- (286).Wang N; Butler JP; Ingber DE Mechanotransduction across the Cell Surface and through the Cytoskeleton. Science 1993, 260, 1124–1127. [DOI] [PubMed] [Google Scholar]
- (287).Su X; Wachtel RE; Gebhart GF Mechanosensitive Potassium Channels in Rat Colon Sensory Neurons. J. Neurophysiol 2000, 84, 836–843. [DOI] [PubMed] [Google Scholar]
- (288).Cho H; Shin J; Shin CY; Lee S-Y; Oh U Mechanosensitive Ion Channels in Cultured Sensory Neurons of Neonatal Rats. J. Neurosci 2002, 22, 1238–1247. [DOI] [PMC free article] [PubMed] [Google Scholar]
- (289).Kung C A Possible Unifying Principle for Mechanosensation. Nature 2005, 436, 647–654. [DOI] [PubMed] [Google Scholar]
- (290).McCarter GC; Reichling DB; Levine JD Mechanical Transduction by Rat Dorsal Root Ganglion Neurons in Vitro. Neurosci. Lett 1999, 273, 179–182. [DOI] [PubMed] [Google Scholar]
- (291).Sánchez D; Anand U; Gorelik J; Benham CD; Bountra C; Lab M; Klenerman D; Birch R; Anand P; Korchev Y Localized and Non-Contact Mechanical Stimulation of Dorsal Root Ganglion Sensory Neurons Using Scanning Ion Conductance Microscopy. J. Neurosci. Methods 2007, 159, 26–34. [DOI] [PubMed] [Google Scholar]
- (292).Jönsson P; McColl J; Clarke RW; Ostanin VP; Jönsson B; Klenerman D Hydrodynamic Trapping of Molecules in Lipid Bilayers. Proc. Natl. Acad. Sci. U. S. A 2012, 109, 10328–10333. [DOI] [PMC free article] [PubMed] [Google Scholar]
- (293).Fuentes DE; Bae C; Butler PJ Focal Adhesion Induction at the Tip of a Functionalized Nanoelectrode. Cell. Mol. Bioeng 2011, 4, 616–626. [DOI] [PMC free article] [PubMed] [Google Scholar]
- (294).Fuentes DE; Butler PJ Coordinated Mechanosensitivity of Membrane Rafts and Focal Adhesions. Cell. Mol. Bioeng 2012, 5, 143–154. [DOI] [PMC free article] [PubMed] [Google Scholar]
- (295).Schäffer TE Nanomechanics of Molecules and Living Cells with Scanning Ion Conductance Microscopy. Anal. Chem 2013, 85, 6988–6994. [DOI] [PubMed] [Google Scholar]
- (296).Miragoli M; Yacoub MH; El-Hamamsy I; Sanchez-Alonso JL; Moshkov A; Mongkoldhumrongkul N; Padala M; Paramagurunathan S; Sarathchandra P; Korchev YE; et al. Side-Specific Mechanical Properties of Valve Endothelial Cells. Am. J. Physiol. Heart Circ. Physiol 2014, 307, H15–H24. [DOI] [PubMed] [Google Scholar]
- (297).Kim SO; Kim J; Okajima T; Cho NJ Mechanical Properties of Paraformaldehyde-Treated Individual Cells Investigated by Atomic Force Microscopy and Scanning Ion Conductance Microscopy. Nano Converg. 2017, 4, 5. [DOI] [PMC free article] [PubMed] [Google Scholar]
- (298).Gangotra A; Willmott GR Mechanical Properties of Bovine Erythrocytes Derived from Ion Current Measurements Using Micropipettes. Bioelectrochemistry 2019, 128, 204–210. [DOI] [PubMed] [Google Scholar]
- (299).Swiatlowska P; Sanchez-Alonso JL; Wright PT; Novak P; Gorelik J Microtubules Regulate Cardiomyocyte Transversal Young’s Modulus. Proc. Natl. Acad. Sci. U. S. A 2020, 117, 2764–2766. [DOI] [PMC free article] [PubMed] [Google Scholar]
- (300).Rheinlaender J; Vogel S; Seifert J; Schachtele M; Borst O; Lang F; Gawaz M; Schäffer TE Imaging the Elastic Modulus of Human Platelets During Thrombin-Induced Activation Using Scanning Ion Conductance Microscopy. Thromb. Haemostasis 2015, 113, 305–311. [DOI] [PubMed] [Google Scholar]
- (301).Pleskova SN; Kriukov RN; Bobyk SZ; Boryakov AV; Gorelkin PV; Erofeev AS Conditioning Adhesive Contacts between the Neutrophils and the Endotheliocytes by Staphylococcus Aureus. J. Mol. Recognit 2020, 33, No. e2846. [DOI] [PubMed] [Google Scholar]
- (302).Pellegrino M; Orsini P; De Gregorio F Use of Scanning Ion Conductance Microscopy to Guide and Redirect Neuronal Growth Cones. Neurosci. Res 2009, 64, 290–296. [DOI] [PubMed] [Google Scholar]
- (303).Clarke RW; Novak P; Zhukov A; Tyler EJ; Cano-Jaimez M; Drews A; Richards O; Volynski K; Bishop C; Klenerman D Low Stress Ion Conductance Microscopy of Sub-Cellular Stiffness. Soft Matter 2016, 12, 7953–7958. [DOI] [PMC free article] [PubMed] [Google Scholar]
- (304).James AF; Sabirov RZ; Okada Y Clustering of Protein Kinase A-Dependent CFTR Chloride Channels in the Sarcolemma of Guinea-Pig Ventricular Myocytes. Biochem. Biophys. Res. Commun 2010, 391, 841–845. [DOI] [PubMed] [Google Scholar]
- (305).Dutta AK; Korchev YE; Shevchuk AI; Hayashi S; Okada Y; Sabirov RZ Spatial Distribution of Maxi-Anion Channel on Cardiomyocytes Detected by Smart-Patch Technique. Biophys. J 2008, 94, 1646–1655. [DOI] [PMC free article] [PubMed] [Google Scholar]
- (306).Gu Y; Gorelik J; Spohr HA; Shevchuk A; Lab MJ; Harding SE; Vodyanoy I; Klenerman D; Korchev YE High-Resolution Scanning Patch-Clamp: New Insights into Cell Function. FASEB J. 2002, 16, 748–750. [DOI] [PubMed] [Google Scholar]
- (307).Rivaud MR; Agullo-Pascual E; Lin XM; Leo-Macias A; Zhang ML; Rothenberg E; Bezzina CR; Delmar M; Remme CA Sodium Channel Remodeling in Subcellular Microdomains of Murine Failing Cardiomyocytes. J. Am. Heart Assoc 2017, 6, No. e007622. [DOI] [PMC free article] [PubMed] [Google Scholar]
- (308).Lin XM; O’Malley H; Chen CL; Auerbach D; Foster M; Shekhar A; Zhang ML; Coetzee W; Jalife J; Fishman GI; et al. Scn1b Deletion Leads to Increased Tetrodotoxin-Sensitive Sodium Current, Altered Intracellular Calcium Homeostasis and Arrhythmias in Murine Hearts. J. Physiol. (Oxford, U. K.) 2015, 593, 1389–1407. [DOI] [PMC free article] [PubMed] [Google Scholar]
- (309).Gorelik J; Zhang Y; Sanchez D; Shevchuk A; Frolenkov G; Lab M; Klenerman D; Edwards C; Korchev Y Aldosterone Acts Via an ATP Autocrine/Paracrine System: The Edelman ATP Hypothesis Revisited. Proc. Natl. Acad. Sci. U. S. A 2005, 102, 15000–15005. [DOI] [PMC free article] [PubMed] [Google Scholar]
- (310).Zhang Y; Sanchez D; Gorelik J; Klenerman D; Lab M; Edwards C; Korchev Y Basolateral P2X4-Like Receptors Regulate the Extracellular ATP-Stimulated Epithelial Na+ Channel Activity in Renal Epithelia. Am. J. Physiol. Renal Physiol 2007, 292, F1734–F1740. [DOI] [PubMed] [Google Scholar]
- (311).Yang X; Liu X; Zhang XF; Lu HJ; Zhang JN; Zhang YJ Investigation of Morphological and Functional Changes During Neuronal Differentiation of PC12 Cells by Combined Hopping Probe Ion Conductance Microscopy and Patch-Clamp Technique. Ultramicroscopy 2011, 111, 1417–1422. [DOI] [PubMed] [Google Scholar]
- (312).Torres-Pérez JV; Naeem H; Thompson CL; Knight MM; Novak P Nanoscale Mapping Reveals Functional Differences in Ion Channels Populating the Membrane of Primary Cilia. Cell. Physiol. Biochem 2020, 54, 15–26. [DOI] [PubMed] [Google Scholar]
- (313).Vivekananda U; Novak P; Bello OD; Korchev YE; Krishnakumar SS; Volynski KE; Kullmann DM Kv1.1 Channelopathy Abolishes Presynaptic Spike Width Modulation by Subthreshold Somatic Depolarization. Proc. Natl. Acad. Sci. U. S. A 2017, 114, 2395–2400. [DOI] [PMC free article] [PubMed] [Google Scholar]
- (314).Matsuoka R; Aoyagi S; Matsumoto N; Matsudaira M; Takahashih Y; Kumatanid A; Ida H; Munakata H; Iida K; Shiku H; et al. Advanced Scanning Electrochemical Microscope System for High-Resolution Imaging and Electrochemical Applications. Electrochemistry 2017, 85, 319–326. [Google Scholar]
- (315).Yasukawa T; Uchida I; Matsue T Permeation of Redox Species through a Cell Membrane of a Single, Living Algal Protoplast Studied by Microamperometry. Biochim. Biophys. Acta, Biomembr 1998, 1369, 152–158. [DOI] [PubMed] [Google Scholar]
- (316).Gonsalves M; Barker AL; Macpherson JV; Unwin PR; O’Hare D; Winlove CP Scanning Electrochemical Microscopy as a Local Probe of Oxygen Permeability in Cartilage. Biophys. J 2000, 78, 1578–1588. [DOI] [PMC free article] [PubMed] [Google Scholar]
- (317).Cannan S; Zhang J; Grunfeld F; Unwin PR Scanning Electrochemical Microscopy (SECM) Studies of Oxygen Transfer across Phospholipid Monolayers under Surface Pressure Control: Comparison of Monolayers at Air/Water and Oil/Water Interfaces. Langmuir 2004, 20, 701–707. [DOI] [PubMed] [Google Scholar]
- (318).Liu B; Rotenberg SA; Mirkin MV Scanning Electrochemical Microscopy of Living Cells: Different Redox Activities of Nonmetastatic and Metastatic Human Breast Cells. Proc. Natl. Acad. Sci. U. S. A 2000, 97, 9855–9860. [DOI] [PMC free article] [PubMed] [Google Scholar]
- (319).Cai C; Liu B; Mirkin MV; Frank HA; Rusling JF Scanning Electrochemical Microscopy of Living Cells. 3. Rhodobacter Sphaeroides. Anal. Chem 2002, 74, 114–119. [DOI] [PubMed] [Google Scholar]
- (320).Sun P; Laforge FO; Abeyweera TP; Rotenberg SA; Carpino J; Mirkin MV Nanoelectrochemistry of Mammalian Cells. Proc. Natl. Acad. Sci. U. S. A 2008, 105, 443–448. [DOI] [PMC free article] [PubMed] [Google Scholar]
- (321).Kuss S; Polcari D; Geissler M; Brassard D; Mauzeroll J Assessment of Multidrug Resistance on Cell Coculture Patterns Using Scanning Electrochemical Microscopy. Proc. Natl. Acad. Sci. U. S. A 2013, 110, 9249–9254. [DOI] [PMC free article] [PubMed] [Google Scholar]
- (322).Momotenko D; McKelvey K; Kang M; Meloni GN; Unwin PR Simultaneous Interfacial Reactivity and Topography Mapping with Scanning Ion Conductance Microscopy. Anal. Chem 2016, 88, 2838–2846. [DOI] [PubMed] [Google Scholar]
- (323).Atwan MH; Macdonald CLB; Northwood DO; Gyenge EL Colloidal Au and Au-Alloy Catalysts for Direct Borohydride Fuel Cells: Electrocatalysis and Fuel Cell Performance. J. Power Sources 2006, 158, 36–44. [Google Scholar]
- (324).Gyenge E Electrooxidation of Borohydride on Platinum and Gold Electrodes: Implications for Direct Borohydride Fuel Cells. Electrochim. Acta 2004, 49, 965–978. [Google Scholar]
- (325).Venkatesh V; Heinemann C; Sundaresan VB Surface-Tracked Scanning Ion Conductance Microscopy: A Novel Imaging Technique for Measuring Topography-Correlated Transmembrane Ion Transport through Porous Substrates. Micron 2019, 120, 57–65. [DOI] [PubMed] [Google Scholar]
- (326).Gong YF; Renigunta V; Zhou Y; Sunq A; Wang JZ; Yang J; Renigunta A; Baker LA; Hou JH Biochemical and Biophysical Analyses of Tight Junction Permeability Made of Claudin-16 and Claudin-19 Dimerization. Mol. Biol. Cell 2015, 26, 4333–4346. [DOI] [PMC free article] [PubMed] [Google Scholar]
- (327).Huang K; Zhou L; Alanis K; Hou J; Baker LA Imaging Effects of Hyperosmolality on Individual Tricellular Junctions. Chem. Sci 2020, 11, 1307–1315. [DOI] [PMC free article] [PubMed] [Google Scholar]
- (328).Gu Y; Chen Y; Dong Y; Liu J; Zhang X; Li M; Shao Y Probing Non-Polarizable Liquid/Liquid Interfaces Using Scanning Ion Conductance Microscopy. Sci. China: Chem 2020, 63, 411–418. [Google Scholar]
- (329).Ji TR; Liang ZW; Zhu XY; Wang LY; Liu SJ; Shao YH Probing the Structure of a Water/Nitrobenzene Interface by Scanning Ion Conductance Microscopy. Chem. Sci 2011, 2, 1523–1529. [Google Scholar]
- (330).Weber A; Shi WQ; Baker LA Electrochemical Applications of Scanning Ion Conductance Microscopy. In Electroanalytical Chemistry: A Series of Advances; Bard AJ, Zoski CG, Eds.; CRC Press: Boca Raton, FL, 2016; Vol. 26, pp 73–114. [Google Scholar]