

Key Points
Question
Is seasonal influenza vaccination in pregnancy associated with adverse childhood health outcomes?
Findings
In this population-based retrospective cohort study that used inverse probability of treatment weighting and included 28 255 children with a mean duration of follow-up of 3.6 years, maternal influenza vaccination during pregnancy was not significantly associated with the risk of immune-related health outcomes (eg, asthma, infections) non–immune-related outcomes (eg, neoplasms, sensory impairment), or nonspecific health outcomes (eg, emergency visits, hospitalizations).
Meaning
Seasonal influenza vaccination in pregnancy was not significantly associated with adverse early childhood health outcomes among offspring.
Abstract
Importance
Seasonal influenza vaccination in pregnancy can reduce influenza illness among pregnant women and newborns. Evidence is limited on whether seasonal influenza vaccination in pregnancy is associated with adverse childhood health outcomes.
Objective
To assess the association between maternal influenza vaccination during pregnancy and early childhood health outcomes.
Design, Setting, and Participants
Retrospective cohort study, using a birth registry linked with health administrative data. All live births in Nova Scotia, Canada, between October 1, 2010, and March 31, 2014, were included, with follow-up until March 31, 2016. Adjusted hazard ratios (HRs) and incidence rate ratios (IRRs) with 95% confidence intervals were estimated while controlling for maternal medical history and other potential confounders using inverse probability of treatment weighting.
Exposures
Seasonal influenza vaccination during pregnancy.
Main Outcomes and Measures
Childhood outcomes studied were immune-related (eg, asthma, infections), non–immune-related (eg, neoplasms, sensory impairment), and nonspecific (eg, urgent or inpatient health care utilization), measured from emergency department and hospitalization databases.
Results
Among 28 255 children (49% female, 92% born at ≥37 weeks’ gestation), 10 227 (36.2%) were born to women who received seasonal influenza vaccination during pregnancy. During a mean follow-up of 3.6 years, there was no significant association between maternal influenza vaccination and childhood asthma (incidence rate, 3.0 vs 2.5 per 1000 person-years; difference, 0.53 per 1000 person-years [95% CI, −0.15 to 1.21]; adjusted HR, 1.22 [95% CI, 0.94 to 1.59]), neoplasms (0.32 vs 0.26 per 1000 person-years; difference, 0.06 per 1000 person-years [95% CI, −0.16 to 0.28]; adjusted HR, 1.26 [95% CI, 0.57 to 2.78]), or sensory impairment (0.80 vs 0.97 per 1000 person-years; difference, −0.17 per 1000 person-years [95% CI, −0.54 to 0.21]; adjusted HR, 0.82 [95% CI, 0.49 to 1.37]). Maternal influenza vaccination in pregnancy was not significantly associated with infections in early childhood (incidence rate, 184.6 vs 179.1 per 1000 person-years; difference, 5.44 per 1000 person-years [95% CI, 0.01 to 10.9]; adjusted IRR, 1.07 [95% CI, 0.99 to 1.15]) or with urgent and inpatient health services utilization (511.7 vs 477.8 per 1000 person-years; difference, 33.9 per 1000 person-years [95% CI, 24.9 to 42.9]; adjusted IRR, 1.05 [95% CI, 0.99 to 1.16]).
Conclusions and Relevance
In this population-based cohort study with mean follow-up duration of 3.6 years, maternal influenza vaccination during pregnancy was not significantly associated with an increased risk of adverse early childhood health outcomes.
This population-based cohort study uses a birth registry linked with health administrative data to assess the association between maternal influenza vaccination during pregnancy and early childhood health outcomes in Nova Scotia, Canada.
Introduction
Seasonal influenza affects approximately 5% to 10% of adults and 20% to 30% of children around the world annually.1 Pregnant women are not more susceptible to acquiring influenza infection but, once infected, are at an increased risk of severe influenza illness and related complications.2,3,4 Maternal influenza infection, particularly during the 2009 influenza A(H1N1) virus ([H1N1]pdm09) pandemic, has also been associated with an increased risk of fetal death and preterm birth.5,6
Seasonal influenza vaccination during pregnancy is an important public health intervention aimed at preventing maternal and neonatal influenza illness.7 Despite benefits of seasonal influenza vaccination in pregnancy, including newborn protection in the first months after birth,8 uptake remains low in many settings.9 Safety concerns are reported as a leading reason women do not receive influenza vaccination in pregnancy.10 Observational studies have not found an association between influenza vaccination during pregnancy and adverse fetal or perinatal outcomes11,12; however, few studies have investigated later childhood health outcomes,13 and this remains an evidence gap.14 The fetus may be sensitive to maternal immune responses during critical periods of development; vaccine exposure in utero may, therefore, be associated with later immune-related or other health outcomes in offspring.15 The purpose of this study was to assess the association between seasonal influenza vaccination in pregnancy and long-term immune-related or other childhood health outcomes.
Methods
Ethics approval was obtained from the IWK Health Centre research ethics board, which granted an exemption for informed consent. The study was further approved by the Joint Data Access and Health Data Nova Scotia access committees.
Study Design and Data Sources
We conducted a population-based retrospective cohort study using the Nova Scotia Atlee Perinatal Database linked with hospitalization and physician billing records. The Atlee Database contains demographic information, prenatal risk factors, diagnoses, and procedures for every birth 500 g or greater and 20 weeks’ gestation or longer in Nova Scotia, Canada. Trained personnel abstract information from antenatal and medical charts, and a data quality program ensures data quality.16,17 The hospitalization database includes all emergency department and inpatient health care contacts for the province, recorded using the International Classification of Diseases, Tenth Revision, Canadian modification (ICD-10-CA) coding system. There are approximately 10 000 live births per year in Nova Scotia within a publicly funded universal health care system, ensuring data capture for all residents.
Study Population and Follow-up
The study population consisted of all live births from October 1, 2010, to March 31, 2014, whose records linked with health administrative databases. Follow-up began on each child’s date of birth and continued until either death, migration out of the province, or March 31, 2016 (end of the study period), whichever occurred first. For analysis of time-to-event outcomes (ie, asthma, neoplasms, sensory impairment), the end of follow-up was the event date for those experiencing the outcome. A graphical depiction of the study design is presented in eFigure 1 in the Supplement.
Exposure
Seasonal influenza vaccination in pregnancy was ascertained from the Atlee and physician billing databases (eTable 1 in the Supplement). The Atlee Database began capturing influenza vaccination during pregnancy in the 2010-2011 influenza season. This information is collected by clinicians during routine prenatal care, based on either patient self-report (eg, if the vaccine was received elsewhere between prenatal care visits) or on vaccination at the prenatal clinic. The physician billing database records fee codes for influenza vaccination administered during an office visit. We ascertained vaccination status predominantly through the physician billing data (81% of the vaccinated group). The influenza vaccines used during the study period were unadjuvanted trivalent inactivated influenza vaccines, consisting of 2 type A strains and 1 type B strain; no product-specific information was available in the study databases.
Outcomes
Although outcomes proximal to birth are assessed according to internationally accepted standards following immunization during pregnancy,18,19 no guidance exists for monitoring later pediatric health outcomes. We prespecified immune-related outcomes (asthma, infections), as the fetal immune system may be sensitive to maternal immunization, with potential for beneficial or deleterious associations later in life through immunologic memory.15,20 We additionally included non–immune-related (neoplasms, sensory impairment) and nonspecific outcomes (all-cause emergency department visits and hospitalizations) that have been the focus of other maternal immunization studies.21,22
Exposure and covariate assessment were based on maternal records, while childhood outcomes were ascertained from children’s records (eFigure 1 in the Supplement). We measured outcomes using ICD-10-CA diagnostic codes from emergency department visits and hospitalizations (eTable 2 in the Supplement). Measurement of pediatric asthma was based on a modification of a previously validated algorithm (sensitivity, 89%; specificity, 72%) and consisted of at least 2 emergency department visits or 1 hospitalization for asthma, at age 6 months or older.23 Other outcomes were based on 1 or more diagnoses received during an emergency department visit or a hospitalization. Infectious outcomes included upper and lower respiratory tract infections, gastrointestinal infections, and otitis media, as well as a composite comprised of the total of these infections. Neoplasm was defined as any abnormal growth of body cells or tissues, and sensory impairment included hearing or vision loss. We prespecified a negative control outcome (all-cause injuries) to help detect any biases or spurious associations; this outcome shares similar potential sources of bias as other study outcomes but is not plausibly related to influenza vaccination during pregnancy.24
Covariates
A broad range of potential confounders and their proxies were included in propensity scores to account for confounding. Included were maternal age at childbirth, parity, maternal smoking, multifetal gestation, preexisting maternal conditions (heart disease, pulmonary disease, asthma, renal disease, psychiatric illness), rural residence, neighborhood-level mean family income, gestational age at birth in weeks, infant sex, season and year of conception, type of clinician at delivery (proxy for the clinician that provided antenatal care), and district health authority.
Statistical Analyses
Distributions of baseline variables, stratified by influenza vaccination during pregnancy, were summarized using frequency distributions and compared using standardized differences, for which an absolute standardized difference less than 0.1 was considered to indicate a well-balanced covariate.25 A propensity score for each child was developed using logistic regression to estimate the predicted probability of maternal influenza vaccination during pregnancy, conditional on all covariates listed in Table 1. The propensity scores were generated from 10 imputed data sets to account for less than 1% missing data; all covariates shown in Table 1 were included in imputation models using chained equations.26 We calculated inverse probability of treatment weights as the inverse of the propensity score for children exposed to maternal influenza vaccination during pregnancy (exposed group) and the inverse of 1 minus the propensity score for the unexposed children. We stabilized the weights to account for extreme values and reassessed the balance of covariates after weighting using standardized differences.25,27
Table 1. Baseline Characteristics of the Study Population by Influenza Vaccination During Pregnancy.
| Characteristic | Influenza vaccination during pregnancy | |||||
|---|---|---|---|---|---|---|
| Unweighted | IPTW weighted | |||||
| No. (%) | Standardized difference | % | Standardized difference | |||
| Yes (n = 10 227) | No (n = 18 028) | Yes | No | |||
| Maternal age, y | ||||||
| <20 | 533 (5.2) | 1033 (5.7) | 0.02 | 5.2 | 5.5 | 0.02 |
| 20-24 | 1655 (16.2) | 3550 (19.7) | 0.09 | 18.2 | 18.4 | 0.004 |
| 25-29 | 2863 (28.0) | 5200 (28.8) | 0.02 | 29.2 | 28.6 | 0.01 |
| 30-34 | 3359 (32.8) | 5255 (29.1) | 0.08 | 30.6 | 30.5 | 0.002 |
| ≥35 | 1817 (17.8) | 2990 (16.6) | 0.03 | 16.8 | 17.0 | 0.005 |
| Parity | ||||||
| 0 (nulliparous) | 4935 (48.3) | 8011 (44.4) | 0.08 | 45.6 | 45.8 | 0.003 |
| ≥1 (multiparous) | 5292 (51.7) | 10 017 (55.6) | 0.08 | 54.4 | 54.2 | 0.003 |
| Former or current smoker | ||||||
| No | 8569 (83.8) | 14 136 (78.4) | 0.14 | 80.3 | 80.4 | 0.001 |
| Yes | 1658 (16.2) | 3892 (21.6) | 0.14 | 19.7 | 19.6 | 0.001 |
| Multifetal gestation | ||||||
| No | 10 005 (97.8) | 17 304 (96.0) | 0.11 | 96.5 | 96.6 | 0.007 |
| Yes | 222 (2.2) | 724 (4.0) | 0.11 | 3.5 | 3.4 | 0.007 |
| Preexisting maternal medical conditions | ||||||
| Psychiatric illness | 1210 (11.8) | 2039 (11.3) | 0.02 | 11.6 | 11.5 | 0.001 |
| Pulmonary disease | 844 (8.3) | 1167 (6.5) | 0.07 | 7.2 | 7.1 | 0.002 |
| Asthma | 821 (8.0) | 1126 (6.2) | 0.07 | 7.0 | 6.9 | 0.002 |
| Kidney disease | 719 (7.0) | 1171 (6.5) | 0.02 | 7.0 | 6.7 | 0.010 |
| Heart disease | 68 (0.66) | 118 (0.65) | 0.001 | 0.69 | 0.66 | 0.003 |
| Rural residence | ||||||
| No | 7761 (75.9) | 12 650 (70.2) | 0.13 | 71.6 | 72.1 | 0.01 |
| Yes | 2466 (24.1) | 5378 (29.8) | 0.13 | 28.4 | 27.9 | 0.01 |
| Mean family income by neighborhood | ||||||
| 1 (lowest) | 1798 (17.6) | 3835 (21.3) | 0.09 | 20.0 | 20.0 | 0.002 |
| 2 | 1792 (17.5) | 3795 (21.1) | 0.09 | 19.7 | 19.8 | 0.002 |
| 3 | 2012 (19.7) | 3614 (20.0) | 0.01 | 20.3 | 20.0 | 0.008 |
| 4 | 2199 (21.5) | 3395 (18.8) | 0.07 | 19.7 | 19.7 | <0.001 |
| 5 (highest) | 2367 (23.1) | 3267 (18.1) | 0.12 | 19.7 | 19.9 | 0.005 |
| Missing | 59 (0.58) | 122 (0.68) | 0.01 | 0.5 | 0.6 | 0.01 |
| Gestational age at birth, wk | ||||||
| <28 | 23 (0.22) | 78 (0.43) | 0.04 | 0.35 | 0.36 | <0.001 |
| 28-31 | 50 (0.49) | 142 (0.79) | 0.04 | 0.83 | 0.69 | 0.02 |
| 32-33 | 64 (0.63) | 187 (1.0) | 0.05 | 0.93 | 0.89 | 0.004 |
| 34-36 | 534 (5.2) | 1144 (6.3) | 0.05 | 5.8 | 5.9 | 0.005 |
| ≥37 | 9556 (93.4) | 16 477 (91.4) | 0.08 | 92.1 | 92.1 | 0.002 |
| Infant sex | ||||||
| Female | 5016 (49.0) | 8834 (49.0) | 0.001 | 49.0 | 49.1 | 0.001 |
| Male | 5211 (51.0) | 9194 (51.0) | 0.001 | 51.0 | 50.9 | 0.001 |
| Conception season | ||||||
| Spring | 3537 (34.6) | 4298 (23.8) | 0.24 | 27.9 | 27.7 | 0.005 |
| Summer | 2892 (28.3) | 3469 (19.2) | 0.21 | 22.6 | 22.6 | <0.001 |
| Fall | 1699 (16.6) | 4786 (26.5) | 0.24 | 23.6 | 23.1 | 0.01 |
| Winter | 2099 (20.5) | 5475 (30.4) | 0.23 | 25.9 | 26.7 | 0.02 |
| Year of conception | ||||||
| 2009 | 10 (0.10) | 106 (0.59) | 0.08 | 0.46 | 0.41 | 0.01 |
| 2010 | 3058 (29.9) | 5205 (28.9) | 0.02 | 29.3 | 29.2 | 0.002 |
| 2011 | 3058 (29.9) | 5085 (28.2) | 0.04 | 29.0 | 28.9 | 0.003 |
| 2012 | 2811 (27.5) | 5199 (28.8) | 0.03 | 28.1 | 28.3 | 0.005 |
| 2013 | 1290 (12.6) | 2433 (13.5) | 0.03 | 13.1 | 13.1 | 0.002 |
| Clinician at delivery | ||||||
| Family practitioner | 5413 (52.9) | 7259 (40.3) | 0.26 | 44.6 | 44.7 | 0.002 |
| Obstetrician | 4727 (46.2) | 10 285 (57.1) | 0.22 | 53.4 | 53.2 | 0.004 |
| Midwife | 72 (0.70) | 362 (2.0) | 0.11 | 1.7 | 1.5 | 0.01 |
| Missing | 15 (0.15) | 122 (0.68) | 0.08 | 0.35 | 0.52 | 0.03 |
| District health authority | ||||||
| Bridgewater | 355 (3.5) | 1057 (5.9) | 0.11 | 5.3 | 5.0 | 0.01 |
| Yarmouth | 629 (6.2) | 834 (4.6) | 0.07 | 5.1 | 5.2 | 0.003 |
| Kentville | 910 (8.9) | 1464 (8.1) | 0.03 | 8.7 | 8.5 | 0.01 |
| Truro | 836 (8.2) | 1682 (9.3) | 0.04 | 8.8 | 8.9 | 0.003 |
| Amherst | 105 (1.0) | 676 (3.7) | 0.18 | 2.7 | 2.8 | 0.01 |
| New Glasgow | 266 (2.6) | 1044 (5.8) | 0.16 | 4.5 | 4.6 | 0.01 |
| Antigonish | 415 (4.1) | 764 (4.2) | 0.01 | 4.5 | 4.2 | 0.01 |
| Cape Breton | 1029 (10.1) | 2412 (13.4) | 0.10 | 12.3 | 12.2 | 0.004 |
| Halifax | 5668 (55.4) | 8073 (44.8) | 0.21 | 47.9 | 48.4 | 0.01 |
| Missing | 14 (0.14) | 22 (0.12) | 0.004 | 0.13 | 0.12 | 0.003 |
Abbreviation: IPTW, inverse probability of treatment weights.
Unadjusted incidence rates per 1000 person-years and crude rate differences with 95% confidence intervals, comparing vaccinated and unvaccinated groups, were computed for all outcomes. Cox proportional hazards models incorporating the inverse probability of treatment weights from each of the 10 imputed data sets were used to model time-to-event outcomes (asthma, neoplasms, sensory impairment), with the underlying time axis as the time in days since birth. Proportional hazards assumptions were met based on examining Schoenfeld residual plots and Wald tests for interactions between exposure status and time. To account for potential data overdispersion, negative binomial regression models, incorporating the inverse probability of treatment weights from each imputation data set, were used for outcomes analyzed as rates (infections, urgent and inpatient health services utilization, all-cause injuries). Each model included the total number of occurrences of each outcome as the dependent variable, with an offset of the log of person-years. Adjusted point estimates were combined across imputed data sets to produce a single estimate. We included a robust variance estimator in all models to account for correlation among siblings, and precision around point estimates was provided using 2-sided 95% CIs. Because of the potential for type I error due to multiple comparisons, study findings should be interpreted as exploratory.
We performed post hoc subgroup analyses by trimester of vaccination; information on timing of vaccination was obtained from the physician billing data for 81% of the exposed group (8272/10 227 vaccinated) and trimester of vaccination was imputed for the remaining 19% (summary of the imputation approach is provided in the eMethods in the Supplement). Several sensitivity analyses were conducted to assess the robustness of the findings. We added maternal asthma as an additional covariate in weighted outcome models and, separately, gestational age in days to assess whether results were sensitive to using a continuous measure; we applied 3 types of trimming to the inverse probability of treatment weights (excluding those lying outside of the 0.01 to 99.9th percentiles, 0.05 to 99.5th percentiles, and 1st to 99th percentiles); and, in separate models, we adjusted for maternal obstetric conditions affecting pregnancy (described in eTable 3 in the Supplement) and maternal influenza illness during pregnancy. Analyses were conducted using SAS version 9.4 (SAS Institute Inc).
Results
Among 28 356 eligible live births, 95 (0.32%) were excluded because of an infant death occurring on the date of birth and 6 (0.02%) because of missing parity or rural residence information, leaving 28 255 children (eFigure 2 in the Supplement). Almost all children (93.4%) were followed up to the end of the study period, ranging from a minimum of 2 years to a maximum of 5.5 years (mean, 3.6 years [SD, 1.1 years]); 69 children (0.2%) were censored because of death. A total of 10 227 children (36.2%) were exposed to influenza vaccination in utero; these children were more likely than unexposed children to be born to mothers who were 35 years or older (17.8% vs 16.6%), nulliparous (48.3% vs 44.4%), had a preexisting medical condition (eg, pulmonary disease, 8.3% vs 6.5%; asthma, 8.0% vs 6.2%), and who had a family physician attending their delivery (52.9% vs 40.3%). Children born to vaccinated mothers were less likely to be born to current or former smokers (16.2% vs 21.6%) and less likely to be born within the lowest neighborhood mean family income quintile (17.6% vs 21.3%) compared with the unexposed group (Table 1). After propensity score weighting, baseline characteristics of the study population were well-balanced across exposure groups and all standardized differences were less than 0.1.
There was no significant association between influenza vaccination during pregnancy and pediatric asthma (incidence rate, 3.0 vs 2.5 per 1000 person-years; difference, 0.53 per 1000 person-years [95% CI, −0.15 to 1.21]; adjusted hazard ratio [HR], 1.22 [95% CI, 0.94 to 1.59]), neoplasms (0.32 vs 0.26 per 1000 person-years; difference, 0.06 per 1000 person-years [95% CI, −0.16 to 0.28]; adjusted HR, 1.26 [95% CI, 0.57 to 2.78]), or sensory impairment (0.80 vs 0.97 per 1000 person-years; difference, −0.17 per 1000 person-years [95% CI, −0.54 to 0.21]; adjusted HR, 0.82 [95% CI, 0.49 to 1.37]) (Table 2).
Table 2. Association Between Seasonal Influenza Vaccination in Pregnancy and Pediatric Health Outcomes Among 28 255 Children in Nova Scotia, Canada.
| Outcome | Influenza vaccination during pregnancy | Crude rate difference per 1000 person-years (95% CI) | Estimate (95% CI) | ||||
|---|---|---|---|---|---|---|---|
| Yes (n = 10 227) | No (n = 18 028) | Crude | Adjusteda | ||||
| No. of events | Incidence rate per 1000 person-years (95% CI) | No. of events | Incidence rate per 1000 person-years (95% CI) | ||||
| Immune-related outcomes | |||||||
| Atopic disease (asthma)b | 113 | 3.0 (2.5-3.6) | 162 | 2.5 (2.1-2.9) | 0.53 (−0.15 to 1.21) | 1.20 (0.95-1.53) | 1.22 (0.94-1.59) |
| Infectious disease | |||||||
| Respiratory tract infectionsc | |||||||
| Upper | 3170 | 84.7 (81.8-87.7) | 5422 | 83.5 (81.3-85.7) | 1.25 (−2.25 to 4.94) | 1.01 (0.95-1.08) | 1.03 (0.94-1.12) |
| Lower | 1348 | 36.0 (34.2-38.0) | 2355 | 36.3 (34.8-37.8) | −0.23 (−2.65 to 2.19) | 0.99 (0.91-1.08) | 1.11 (0.99-1.24) |
| Gastrointestinal infectionsc | 1129 | 30.2 (28.5-32.0) | 1816 | 28.0 (26.7-29.3) | 2.22 (0.04 to 4.40) | 1.08 (0.99-1.18) | 1.04 (0.94-1.15) |
| Otitis mediac | 1684 | 45.0 (42.9-45.4) | 2841 | 43.7 (42.2-45.4) | 1.27 (−1.42 to 3.95) | 1.03 (0.95-1.11) | 1.10 (1.00-1.22) |
| All infectionsc,d | 6906 | 184.6 (180.3-189.0) | 11 635 | 179.1 (175.9-182.4) | 5.44 (0.01 to 10.9) | 1.03 (0.98-1.08) | 1.07 (0.99-1.15) |
| Non–immune-related outcomes | |||||||
| Neoplasmsb | 12 | 0.32 (0.18-0.57) | 17 | 0.26 (0.16-0.42) | 0.06 (−0.16 to 0.28) | 1.22 (0.58-2.56) | 1.26 (0.57-2.78) |
| Sensory impairment (hearing or vision loss)b | 30 | 0.80 (0.56-1.15) | 63 | 0.97 (0.76-1.24) | −0.17 (−0.54 to 0.21) | 0.84 (0.54-1.30) | 0.82 (0.49-1.37) |
| Nonspecific outcomes | |||||||
| Urgent and inpatient health services utilizationc | 19 146 | 511.7 (504.5-519.0) | 31 035 | 477.8 (472.6-483.2) | 33.9 (24.9 to 42.9) | 1.07 (1.03-1.11) | 1.05 (0.99-1.16) |
| Negative control outcome | |||||||
| All-cause injuriesc | 2640 | 70.6 (67.9-73.3) | 4118 | 63.4 (61.5-65.4) | 7.16 (3.84 to 10.5) | 1.11 (1.05-1.18) | 1.05 (0.97-1.13) |
Adjusted using stabilized inverse probability of treatment weights.
Number of events represents the total number of children diagnosed with the outcome. Incidence rates are based on the full study population. Point estimates are hazard ratios generated from a Cox proportional hazards model.
Number of events represents the total number of occurrences for each outcome. Incidence rates are based on the full study population. Point estimates are incidence rate ratios generated from a negative binomial regression model.
Composite of upper respiratory tract infections, lower respiratory tract infections, gastrointestinal infections, and otitis media.
After adjustment for confounding, exposure to influenza vaccination in utero was not significantly associated with overall infections (incidence rate, 184.6 vs 179.1 per 1000 person-years; difference, 5.44 per 1000 person-years [95% CI, 0.01 to 10.9]; adjusted incidence rate ratio [IRR], 1.07 [95% CI, 0.99 to 1.15]), urgent and inpatient health services utilization (511.7 vs 477.8 per 1000 person-years; difference, 33.9 per 1000 person-years [95% CI, 24.9 to 42.9]; adjusted IRR, 1.05 [95% CI, 0.99 to 1.16]), or with the negative control outcome (70.6 vs 63.4 per 1000 person-years; difference, 7.16 per 1000 person-years [95% CI, 3.84 to 10.5]; adjusted IRR, 1.05 [95% CI, 0.97 to 1.13]).
There was no statistically significant difference in crude incidence rates of upper and lower respiratory tract infections and otitis media between vaccine-exposed and unexposed children (Table 2). Crude rates of gastrointestinal infections were 30.2 vs 28.0 per 1000 person-years among children born to vaccinated vs unvaccinated mothers (crude rate difference, 2.22 per 1000 person-years [95% CI, 0.04 to 4.40]; however, there was no statistically significant association (adjusted IRR, 1.04 [95% CI, 0.94 to 1.15]).
Overall, results in the post hoc analyses by trimester of vaccination were not qualitatively different from the primary analyses (Figure). Although the magnitude and direction of the point estimate were similar to the primary analysis, third-trimester influenza vaccination was significantly associated with lower respiratory tract infection in this post hoc subgroup analysis (adjusted IRR, 1.19 [95% CI, 1.01 to 1.40]). The results were robust in sensitivity analyses (eFigure 3 in the Supplement).
Figure. Association Between Seasonal Influenza Vaccination in Pregnancy and Pediatric Health Outcomes, by Trimester of Vaccination.
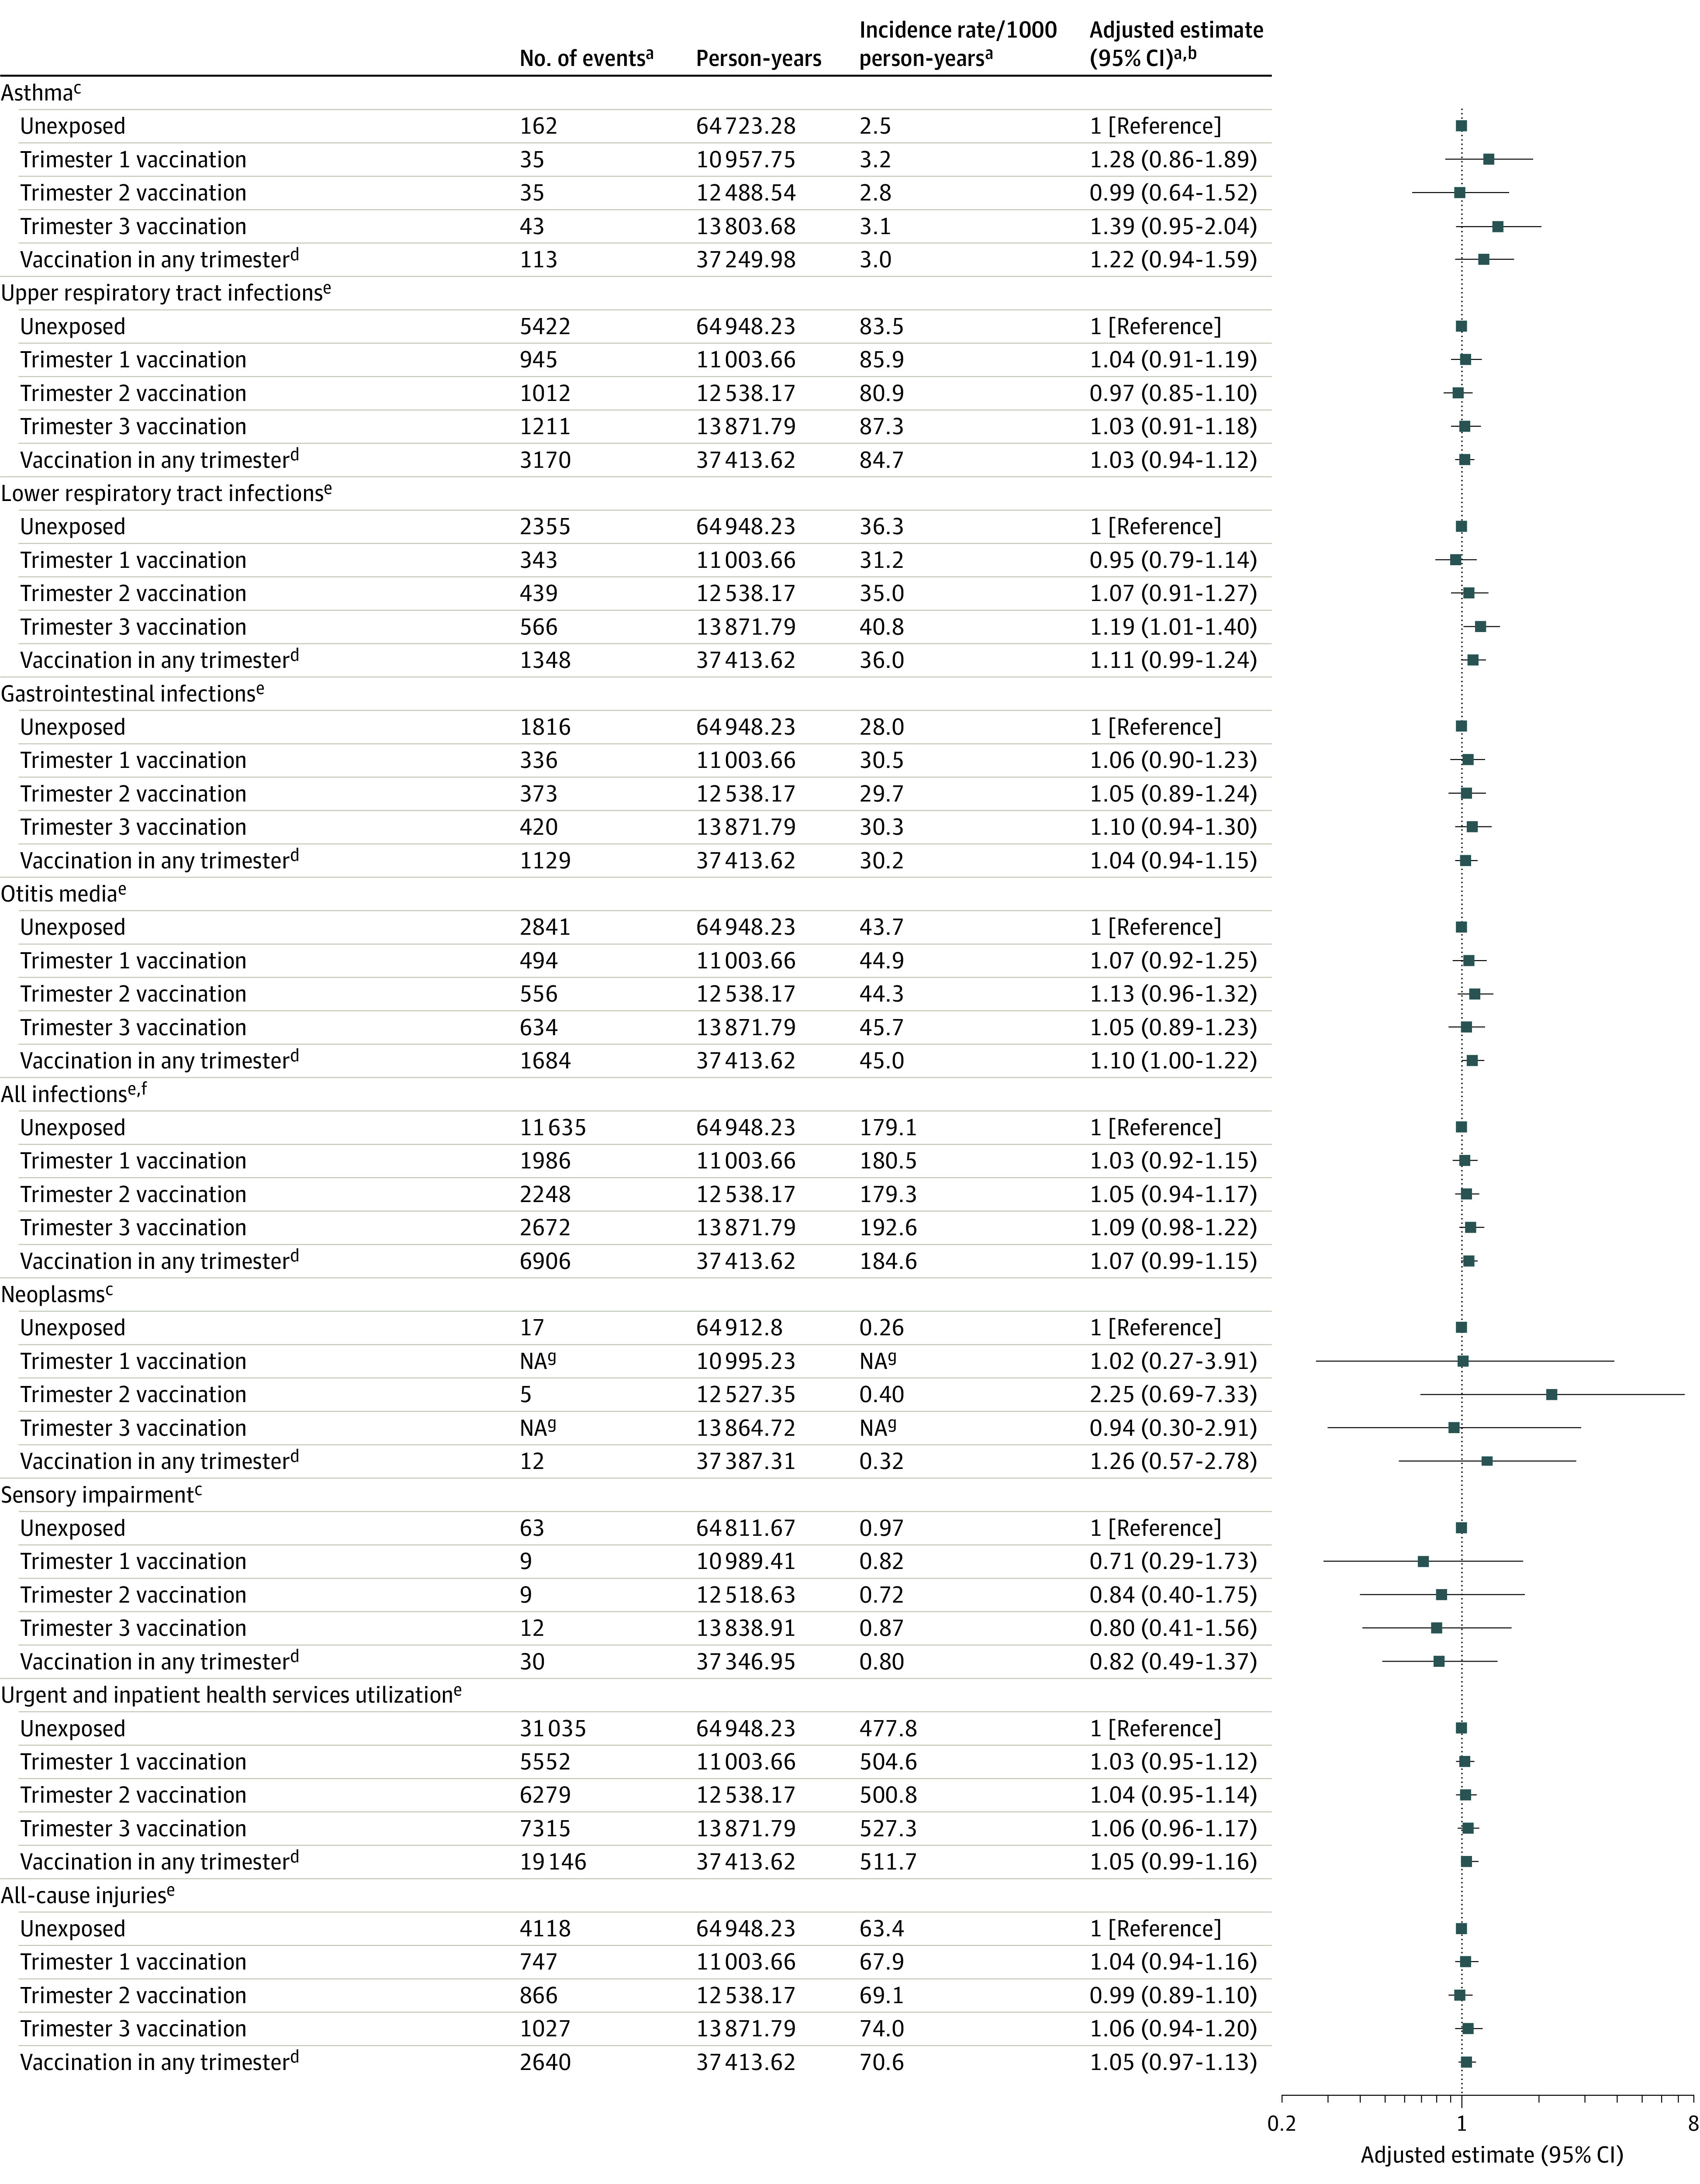
aTiming imputed for 19% of vaccinated group; No. of events and incidence rates in that group based on first imputed data set; adjusted estimates based on 10 imputed data sets. bAdjusted using stabilized inverse probability of treatment weights. cNo. of events = total children diagnosed with outcome. Point estimates are HRs from a Cox proportional hazards model. dSee Table 2. eNo. of events = total occurrences for each outcome. Point estimates are incidence rate ratios from a negative binomial model. fAll respiratory tract infections, gastrointestinal infections, and otitis media. gData suppressed (n < 5).
Discussion
The results of this population-based study suggest that maternal influenza vaccination during pregnancy was not associated with immune-related adverse health outcomes (eg, asthma, infections), non–immune-related health outcomes (eg, neoplasms, sensory impairment), or nonspecific health services utilization (eg, emergency department visits and hospitalizations) in young children. These results remained largely consistent in trimester-specific analyses and in sensitivity analyses that considered possible residual confounding (eg, from maternal asthma or influenza diagnoses), changes in the gestational age definition, and implementation of trimming methods to account for possible influential inverse probability of treatment weights. A small positive association with the negative control outcome in unadjusted analyses was attenuated after propensity score weighting, implying that the models accounted for confounding. Previous studies on this topic have largely focused on exposure to influenza A(H1N1)pdm09 vaccination in pregnancy13; this study, therefore, makes an important contribution to long-term evaluation of seasonal influenza vaccination during pregnancy.
Efficacy of trivalent inactivated influenza vaccination in pregnancy for preventing influenza infection in mothers and their infants younger than 6 months has been demonstrated in several randomized clinical trials.28,29,30,31 Among studies that have evaluated childhood health outcomes after age 6 months, 3 investigated seasonal influenza vaccine and a limited number of childhood outcomes, while 7 investigated influenza A(H1N1)pdm09 vaccine and a wider range of outcomes.13,32 Overall, these studies did not identify any concerning associations between influenza vaccination in pregnancy and adverse childhood health outcomes.13 For seasonal influenza vaccines, no significant association was reported with autism spectrum disorder (median follow-up of 8.3 years; adjusted HR, 1.10 [95% CI, 1.00 to 1.21]).33 No significant association was reported between seasonal influenza vaccination in pregnancy and lab-confirmed influenza hospitalization among children aged 6 to 12 months.34 Acute otitis media and medically attended acute respiratory infections in the first year of life were inversely associated with seasonal influenza vaccination during pregnancy.35
For influenza A(H1N1)pdm09 vaccine, no significant associations were reported between vaccination in pregnancy and many infection-related outcomes in the first year of life, such as influenza and pneumonia,36 infection-related primary care visits,37 or any infections.38 Previously reported inverse associations between influenza A(H1N1)pdm09 vaccination and rates of gastrointestinal infections up to 5 years of age (adjusted rate ratio, 0.84 [95% CI, 0.74 to 0.94]21; adjusted HR, 0.94 [95% CI, 0.91 to 0.98]22) were not observed in this study of seasonal influenza vaccine. Although the reason for the inverse association with gastrointestinal infections in previous studies is unclear, both studies speculated there may have been residual confounding by rotavirus vaccination that could not be adjusted for. This was likely not a problem in the current study because of lack of provincial health care coverage for the rotavirus vaccine during the study period.
A Danish cohort study, with a mean of 4.6 years of follow-up, found no significant association between influenza A(H1N1)pdm09 vaccine exposure during the first trimester (adjusted rate ratio, 1.50 [95% CI, 0.99 to 2.29]) or second or third trimesters (adjusted rate ratio, 1.02 [95% CI, 0.89 to 1.16]) and childhood asthma.21 A Canadian cohort study with a median length of follow-up of 5 years reported a weak association between any influenza A(H1N1)pdm09 influenza vaccine exposure and childhood asthma (adjusted HR, 1.05 [95% CI, 1.02 to 1.09]); however, the magnitude was small and may have been a result of residual confounding, as there was also a weak association with the negative control outcome in that study.22 The Canadian and Danish studies reported no significant association between influenza vaccination in pregnancy and a range of other immune-related child health outcomes (eg, upper or lower respiratory tract infections, otitis media, meningitis, sepsis, viral infections, any infections), and non–immune-related child health outcomes (eg, neoplasms, sensory disorders, epilepsy, intellectual disability, Bell palsy).21,22 In addition, a Swedish cohort study found no significant association between influenza A(H1N1)pdm09 vaccination and autism spectrum disorder (mean follow-up, 6.7 years; adjusted HR, 0.95 [95% CI, 0.81 to 1.12]).32
This study has several strengths. First, the study used a population-based design that included nearly all births in the province, which minimized selection bias and could therefore potentially generalize to other settings. Second, assessment of influenza vaccine exposure was based primarily on physician claims data (81%) but influenza vaccination reported in the perinatal database was also included, which likely improved exposure assessment as compared with previous research.9 Third, numerous sensitivity analyses yielded results similar to those from the primary analyses, supporting the robustness of the findings.
Limitations
This study has several limitations. First, both physician billing information and the Atlee Database were used for exposure assessment, and the latter relied partly on patient self-report, which may be less reliable. However, of the 10 227 children exposed to influenza vaccination in utero, vaccination was recorded in the physician billing database 81% of the time and use of the Atlee Database to supplement exposure ascertainment had the advantage of capturing data on influenza vaccination in settings other than a physician’s office, such as workplaces or pharmacies. Second, outcome misclassification cannot be ruled out; the majority of study outcomes have not been validated, although an adapted validated algorithm was used for childhood asthma. Third, outcome measurement was limited to diagnoses made in emergency departments and during hospitalizations, although this approach reflected more serious illnesses and could potentially improve specificity compared with use of diagnoses from nonurgent settings.22,23 Fourth, residual confounding from unmeasured or unknown variables cannot be ruled out, although the lack of significant association with the negative control outcome provides additional reassurance for the validity of conclusions from the main analyses. Fifth, the point estimates were slightly increased for some outcomes (eg, adjusted HR of 1.22 for asthma and 1.26 for neoplasms), and the 95% CIs around these estimates indicate that some increase in risk cannot be ruled out. Given the observational nature of the study, the small events numbers for neoplasms, and the imprecise 95% CIs around some point estimates (especially for neoplasms and trimester-specific analyses), these results should be interpreted cautiously.
Conclusions
In this population-based cohort study with mean follow-up duration of 3.6 years, maternal influenza vaccination during pregnancy was not significantly associated with an increased risk of adverse early childhood health outcomes.
eFigure 1. Study Design
eFigure 2. Study Flow Diagram
eFigure 3. Sensitivity Analyses
eTable 1. Influenza Vaccination Exposure Assessment
eTable 2. Individual ICD-10-CA Diagnostic Codes to Identify Outcomes
eMethods.
eTable 3. Description of “Obstetric Conditions Affecting Pregnancy” Covariate
References
- 1.Department of Reproductive Health and Research . Seasonal influenza. World Health Organization. Accessed March 18, 2021. https://www.who.int/ith/diseases/influenza_seasonal/en/
- 2.Siston AM, Rasmussen SA, Honein MA, et al. ; Pandemic H1N1 Influenza in Pregnancy Working Group . Pandemic 2009 influenza A(H1N1) virus illness among pregnant women in the United States. JAMA. 2010;303(15):1517-1525. doi: 10.1001/jama.2010.479 [DOI] [PMC free article] [PubMed] [Google Scholar]
- 3.Jamieson DJ, Honein MA, Rasmussen SA, et al. ; Novel Influenza A (H1N1) Pregnancy Working Group . H1N1 2009 influenza virus infection during pregnancy in the USA. Lancet. 2009;374(9688):451-458. doi: 10.1016/S0140-6736(09)61304-0 [DOI] [PubMed] [Google Scholar]
- 4.Mertz D, Lo CK, Lytvyn L, Ortiz JR, Loeb M; FLURISK Investigators . Pregnancy as a risk factor for severe influenza infection: an individual participant data meta-analysis. BMC Infect Dis. 2019;19(1):683. doi: 10.1186/s12879-019-4318-3 [DOI] [PMC free article] [PubMed] [Google Scholar]
- 5.Fell DB, Savitz DA, Kramer MS, et al. Maternal influenza and birth outcomes: systematic review of comparative studies. BJOG. 2017;124(1):48-59. doi: 10.1111/1471-0528.14143 [DOI] [PMC free article] [PubMed] [Google Scholar]
- 6.Gunnes N, Gjessing HK, Bakken IJ, et al. Seasonal and pandemic influenza during pregnancy and risk of fetal death: a Norwegian registry-based cohort study. Eur J Epidemiol. 2020;35(4):371-379. doi: 10.1007/s10654-020-00600-z [DOI] [PMC free article] [PubMed] [Google Scholar]
- 7.World Health Organization . Vaccines against influenza WHO position paper—November 2012. Wkly Epidemiol Rec. 2012;87(47):461-476. [PubMed] [Google Scholar]
- 8.Omer SB. Maternal immunization. N Engl J Med. 2017;376(25):2497. [DOI] [PubMed] [Google Scholar]
- 9.Legge A, Dodds L, MacDonald NE, Scott J, McNeil S. Rates and determinants of seasonal influenza vaccination in pregnancy and association with neonatal outcomes. CMAJ. 2014;186(4):E157-E164. doi: 10.1503/cmaj.130499 [DOI] [PMC free article] [PubMed] [Google Scholar]
- 10.Chamberlain AT, Seib K, Ault KA, et al. Factors associated with intention to receive influenza and tetanus, diphtheria, and acellular pertussis (Tdap) vaccines during pregnancy: a focus on vaccine hesitancy and perceptions of disease severity and vaccine safety. PLoS Curr. 2015;7:7. doi: 10.1371/currents.outbreaks.d37b61bceebae5a7a06d40a301cfa819 [DOI] [PMC free article] [PubMed] [Google Scholar]
- 11.Fell DB, Platt RW, Lanes A, et al. Fetal death and preterm birth associated with maternal influenza vaccination: systematic review. BJOG. 2015;122(1):17-26. doi: 10.1111/1471-0528.12977 [DOI] [PubMed] [Google Scholar]
- 12.Giles ML, Krishnaswamy S, Macartney K, Cheng A. The safety of inactivated influenza vaccines in pregnancy for birth outcomes: a systematic review. Hum Vaccin Immunother. 2019;15(3):687-699. doi: 10.1080/21645515.2018.1540807 [DOI] [PMC free article] [PubMed] [Google Scholar]
- 13.Foo DYP, Sarna M, Pereira G, Moore HC, Fell DB, Regan AK. Early childhood health outcomes following in utero exposure to influenza vaccines: a systematic review. Pediatrics. 2020;146(2):e20200375. doi: 10.1542/peds.2020-0375 [DOI] [PubMed] [Google Scholar]
- 14.Keller-Stanislawski B, Englund JA, Kang G, et al. Safety of immunization during pregnancy: a review of the evidence of selected inactivated and live attenuated vaccines. Vaccine. 2014;32(52):7057-7064. doi: 10.1016/j.vaccine.2014.09.052 [DOI] [PubMed] [Google Scholar]
- 15.Chen T, Liu H-X, Yan H-Y, Wu D-M, Ping J. Developmental origins of inflammatory and immune diseases. Mol Hum Reprod. 2016;22(8):858-865. doi: 10.1093/molehr/gaw036 [DOI] [PMC free article] [PubMed] [Google Scholar]
- 16.Joseph KS, Fahey J; Canadian Perinatal Surveillance System . Validation of perinatal data in the Discharge Abstract Database of the Canadian Institute for Health Information. Chronic Dis Can. 2009;29(3):96-100. doi: 10.24095/hpcdp.29.3.01 [DOI] [PubMed] [Google Scholar]
- 17.Fair M, Cyr M, Allen A, Wen SW, Guyon G, MacDonald R. Validation Study for a Record Linkage of Births and Infant Deaths in Canada. Statistics Canada; 1999. Catalogue 84F001XIE. [Google Scholar]
- 18.Bonhoeffer J, Kochhar S, Hirschfeld S, et al. ; GAIA Project Participants . Global alignment of immunization safety assessment in pregnancy—the GAIA Project. Vaccine. 2016;34(49):5993-5997. doi: 10.1016/j.vaccine.2016.07.006 [DOI] [PubMed] [Google Scholar]
- 19.Kochhar S, Bauwens J, Bonhoeffer J; GAIA Project Participants . Safety assessment of immunization in pregnancy. Vaccine. 2017;35(48, pt A):6469-6471. doi: 10.1016/j.vaccine.2017.09.033 [DOI] [PMC free article] [PubMed] [Google Scholar]
- 20.MacGillivray DM, Kollmann TR. The role of environmental factors in modulating immune responses in early life. Front Immunol. 2014;5:434. doi: 10.3389/fimmu.2014.00434 [DOI] [PMC free article] [PubMed] [Google Scholar]
- 21.Hviid A, Svanström H, Mølgaard-Nielsen D, Lambach P. Association between pandemic influenza A(H1N1) vaccination in pregnancy and early childhood morbidity in offspring. JAMA Pediatr. 2017;171(3):239-248. doi: 10.1001/jamapediatrics.2016.4023 [DOI] [PubMed] [Google Scholar]
- 22.Walsh LK, Donelle J, Dodds L, et al. Health outcomes of young children born to mothers who received 2009 pandemic H1N1 influenza vaccination during pregnancy: retrospective cohort study. BMJ. 2019;366:l4151. doi: 10.1136/bmj.l4151 [DOI] [PMC free article] [PubMed] [Google Scholar]
- 23.Radhakrishnan DK, Dell SD, Guttmann A, Shariff SZ, Liu K, To T. Trends in the age of diagnosis of childhood asthma. J Allergy Clin Immunol. 2014;134(5):1057-1062. doi: 10.1016/j.jaci.2014.05.012 [DOI] [PubMed] [Google Scholar]
- 24.Arnold BF, Ercumen A. Negative control outcomes: a tool to detect bias in randomized trials. JAMA. 2016;316(24):2597-2598. doi: 10.1001/jama.2016.17700 [DOI] [PMC free article] [PubMed] [Google Scholar]
- 25.Austin PC. Balance diagnostics for comparing the distribution of baseline covariates between treatment groups in propensity-score matched samples. Stat Med. 2009;28(25):3083-3107. doi: 10.1002/sim.3697 [DOI] [PMC free article] [PubMed] [Google Scholar]
- 26.White IR, Royston P, Wood AM. Multiple imputation using chained equations: issues and guidance for practice. Stat Med. 2011;30(4):377-399. doi: 10.1002/sim.4067 [DOI] [PubMed] [Google Scholar]
- 27.Austin PC, Stuart EA. Moving towards best practice when using inverse probability of treatment weighting (IPTW) using the propensity score to estimate causal treatment effects in observational studies. Stat Med. 2015;34(28):3661-3679. doi: 10.1002/sim.6607 [DOI] [PMC free article] [PubMed] [Google Scholar]
- 28.Madhi SA, Cutland CL, Kuwanda L, et al. ; Maternal Flu Trial (Matflu) Team . Influenza vaccination of pregnant women and protection of their infants. N Engl J Med. 2014;371(10):918-931. doi: 10.1056/NEJMoa1401480 [DOI] [PubMed] [Google Scholar]
- 29.Tapia MD, Sow SO, Tamboura B, et al. Maternal immunisation with trivalent inactivated influenza vaccine for prevention of influenza in infants in Mali: a prospective, active-controlled, observer-blind, randomised phase 4 trial. Lancet Infect Dis. 2016;16(9):1026-1035. doi: 10.1016/S1473-3099(16)30054-8 [DOI] [PMC free article] [PubMed] [Google Scholar]
- 30.Steinhoff MC, Katz J, Englund JA, et al. Year-round influenza immunisation during pregnancy in Nepal: a phase 4, randomised, placebo-controlled trial. Lancet Infect Dis. 2017;17(9):981-989. doi: 10.1016/S1473-3099(17)30252-9 [DOI] [PMC free article] [PubMed] [Google Scholar]
- 31.Zaman K, Roy E, Arifeen SE, et al. Effectiveness of maternal influenza immunization in mothers and infants. N Engl J Med. 2008;359(15):1555-1564. doi: 10.1056/NEJMoa0708630 [DOI] [PubMed] [Google Scholar]
- 32.Ludvigsson JF, Winell H, Sandin S, Cnattingius S, Stephansson O, Pasternak B. Maternal influenza A(H1N1) immunization during pregnancy and risk for autism spectrum disorder in offspring: a cohort study. Ann Intern Med. 2020;173(8):597-604. doi: 10.7326/M20-0167 [DOI] [PubMed] [Google Scholar]
- 33.Zerbo O, Qian Y, Yoshida C, Fireman BH, Klein NP, Croen LA. Association between influenza infection and vaccination during pregnancy and risk of autism spectrum disorder. JAMA Pediatr. 2017;171(1):e163609. [DOI] [PubMed] [Google Scholar]
- 34.Benowitz I, Esposito DB, Gracey KD, Shapiro ED, Vázquez M. Influenza vaccine given to pregnant women reduces hospitalization due to influenza in their infants. Clin Infect Dis. 2010;51(12):1355-1361. doi: 10.1086/657309 [DOI] [PMC free article] [PubMed] [Google Scholar]
- 35.van Santen KL, Bednarczyk RA, Adjaye-Gbewonyo D, Orenstein WA, Davis R, Omer SB. Effectiveness of pneumococcal conjugate vaccine in infants by maternal influenza vaccination status. Pediatr Infect Dis J. 2013;32(11):1180-1184. doi: 10.1097/INF.0b013e3182a26752 [DOI] [PubMed] [Google Scholar]
- 36.Fell DB, Wilson K, Ducharme R, et al. Infant respiratory outcomes associated with prenatal exposure to maternal 2009 A/H1N1 influenza vaccination. PLoS One. 2016;11(8):e0160342. doi: 10.1371/journal.pone.0160342 [DOI] [PMC free article] [PubMed] [Google Scholar]
- 37.van der Maas N, Dijs-Elsinga J, Kemmeren J, van Lier A, Knol M, de Melker H. Safety of vaccination against influenza A (H1N1) during pregnancy in The Netherlands: results on pregnancy outcomes and infant’s health: cross-sectional linkage study. BJOG. 2016;123(5):709-717. doi: 10.1111/1471-0528.13329 [DOI] [PubMed] [Google Scholar]
- 38.Bischoff AL, Følsgaard NV, Vissing NH, Birch S, Brix S, Bisgaard H. Airway mucosal immune-suppression in neonates of mothers receiving A(H1N1)pnd09 vaccination during pregnancy. Pediatr Infect Dis J. 2015;34(1):84-90. doi: 10.1097/INF.0000000000000529 [DOI] [PubMed] [Google Scholar]
Associated Data
This section collects any data citations, data availability statements, or supplementary materials included in this article.
Supplementary Materials
eFigure 1. Study Design
eFigure 2. Study Flow Diagram
eFigure 3. Sensitivity Analyses
eTable 1. Influenza Vaccination Exposure Assessment
eTable 2. Individual ICD-10-CA Diagnostic Codes to Identify Outcomes
eMethods.
eTable 3. Description of “Obstetric Conditions Affecting Pregnancy” Covariate