

Abstract
Pancreatic ductal adenocarcinoma (PDAC) is a lethal malignancy and is refractory to available treatments. Delineating the regulatory mechanisms of metabolic reprogramming, a key event in pancreatic cancer progression, may identify candidate targets with potential therapeutic significance. We hypothesized that inflammatory signaling pathways regulate metabolic adaptations in pancreatic cancer. Metabolic profiling of tumors from PDAC patients with a high- (>median, n = 31) and low-NOS2 (inducible nitric oxide synthase; <median, n = 32) mRNA expression was performed. Differentially abundant metabolites were analyzed and linked with patient survival. The functional role of the prognostically significant metabolite and the mechanism of its regulation by NOS2/NO• (nitric oxide)-mediated signaling pathway was elucidated. The level of kynurenine, a tryptophan metabolite, was associated with high NOS2 expression, and a higher level of kynurenine predicted poor survival in patients (n = 63, p = 0.01). Gene expression analysis in PDAC tumors (n = 63) showed a positive correlation between the expression of NOS2 and the tryptophan/kynurenine pathway genes, including indoleamine-2,3-dioxygenase 1 (IDO1) and several aryl hydrocarbon receptor (AHR)-target genes including NFE2L2 (NRF2), SERPINB2, IL1b, IL6 and IL8, which are implicated in pancreatic cancer. Consistently, treatment of pancreatic cancer cell lines with NO• donor induced IDO1, kynurenine production and the expression of AHR-target genes. Furthermore, kynurenine treatment enhanced spheroid growth and invasive potential of pancreatic cancer cell lines. Mechanistically, NO•-induced IDO1/Kynurenine/AHR signaling was mediated by RUNX3 transcription factor. Our findings identified a novel NO•/RUNX3/Kynurenine metabolic axis, which enhances disease aggressiveness in pancreatic cancer and may have potential translational significance in improving disease outcome.
Keywords: pancreatic cancer, kynurenine, nitric oxide, RUNX3, therapeutic targets, prognosis
Introduction
Pancreatic cancer is a lethal malignancy and remains the third leading cause of death due to cancer with an estimated 56,770 new cases and 45,750 deaths in 2019 alone in the United States.1 Late diagnosis with locally advanced or metastatic disease and largely ineffective response to available treatments contribute to the dismal patient outcome. Therefore, delineating the key biological pathways involved in pancreatic cancer progression and disease aggressiveness is essential to identify novel targets, achieve effective treatment and improve patient survival in this lethal malignancy. Recent advances in pancreatic cancer research have improved our understanding of pancreatic tumor biology and continue to provide rationale for developing potential treatment strategies. However, an effective therapeutic approach remains lacking and therefore novel clinically relevant targets and strategies are needed to improve patient outcome.
Metabolic reprogramming is one of the key events in pancreatic tumor biology which helps cancer cells to survive and grow under harsh microenvironment with depleted nutrient and oxygen level.2–4 Several of the metabolic adaptations including increase in glucose uptake, enhanced glycolysis, increased flux of glycolysis intermediates into anabolic pathways, canonical and noncanonical glutamine metabolism and activation of recycling and scavenging processes support an increased demand for energy and biosynthesis by tumor cells and also maintain an optimal redox balance to support growth and progression.3 Although critically important, metabolic adaptations are highly complex and context-dependent dynamic events, and the mechanisms of their regulation are not yet completely understood. Therefore, understanding the regulation of metabolic adaptations in tumor may identify critical metabolic switch, which may be used as a candidate target to impede cancer growth and progression.
Inflammatory and immune mediators are implicated in the development and progression of pancreatic cancer. Many of these inflammatory mediators are produced by both inflammatory as well as tumor cells and are involved in mediating key inflammatory signaling pathways responsible for conferring survival and growth advantage.5 Interestingly, chronic inflammation may result in metabolic dysfunction, and the inflammatory/immune signaling and metabolic regulations are described as highly integrated events.6 Furthermore, inflammatory and metabolic processes, associated with obesity, cooperatively enhance tumorigenesis and chemoresistance.7,8 In a recent study, inhibitor of kappa kinase subunit-epsilon (IKKe), which plays a central role in innate immunity, is reported to reprogram glucose metabolism and enhance pancreatic tumor growth in the mouse model.9 Additionally, an increased expression of IKKe associated with poorer survival in patients with pancreatic ductal adenocarcinoma (PDAC).10 However, the role of inflammatory signaling pathways in the regulation of metabolic adaptations is not clear in pancreatic cancer.
Nitric oxide (NO•) is an inflammatory and immune mediator and is generated during the conversion of arginine to citrulline, a reaction that is catalyzed by nitric oxide synthases (NOS), which is categorized as constitutive NOS [NOS1(neuronal NOS) and NOS3 (endothelial NOS)] and inducible NOS (NOS2).11–13 NO• plays an important role in several critical physiological processes including vasodilation, neurotransmission, immune regulation and host defense.12 However, a high level of NO• production for a prolonged period may contribute to tumorigenesis. NOS2 is primarily responsible for a high and sustained level of NO• production during chronic inflammation and cancer. We have recently described that a higher NOS2 expression in tumors is associated with poor survival in resected PDAC patients and NOS2/NO• signaling enhances tumor progression and disease aggressiveness.14,15 Moreover, NOS2 is described as a potential mediator of immune suppression in PDAC.16 NO• is a modulator of bioenergetics pathways and may play a role in metabolic reprogramming in tumor cells for sustained growth and progression under low nutrient and hypoxic microenvironment.17 Consistently, a higher expression of NO• is reported to enhance glycolysis and lactate production in breast cancer.18 Furthermore, NO• is shown as a positive regulator of the Warburg effect in ovarian cancer.19 However, the role of NO•-mediated signaling in tumor metabolic reprogramming in pancreatic cancer is previously not described. In our study, we tested the hypothesis that NOS2/NO•-signaling pathway regulates metabolic adaptations in PDAC. Our findings identified a NO•/RUNX3/kynurenine metabolic signaling that enhances pancreatic cancer progression and disease aggressiveness.
Materials and Methods
Human samples
Fresh-frozen human primary tumor tissues from resected PDAC patients were collected at the University of Maryland Medical System (UMMS) at Baltimore, MD, through NCI-UMD resource contract and University Medical Center Göttingen, Germany. Tumor histopathology was classified by Board-certified pathologists and the patient’s characteristics are described in the Supporting Information Table S1. NCI-Office of the Human Subject Research Protection (OHSRP), NIH, Bethesda, MD, approved the use of these clinical samples in our study (OHSRP Exempt # 4678).
Metabolic profiling and data analysis of PDAC
Metabolic profiling of 33 tumor samples from PDAC patients was performed at Metabolon Inc. by using the standard protocol as described earlier.39–41 To describe briefly, Metabolon untargeted metabolic platform uses two separate ultra-high performance liquid chromatography/tandem mass spectrometry (UHPLC/MS/MS) injections and one gas chromatography/mass spectrometry injection for each sample. The data from this sample set was combined with our earlier metabolic profiling data sets (n = 33 and n = 31)41 Metabolic profiling of these sample sets was also conducted at Metabolon Inc. Only patients with stage I and II disease with follow up data were included in further analysis (n = 63). We used a total of 235 common compounds of known identity to query all three datasets and normalized the merged data by assigning the median of each compound level to equal to 1 for each dataset termed “block normalization.” Missing data were imputed with the minimum observed value for each compound in each dataset. The combined dataset was log2 transformed and served for further data analysis (Supporting Information Table S2).
Cell lines and culture condition
Human pancreatic cancer cell lines Panc-1 (RRID: CVCL_0480), CFPAC-1 (RRID: CVCL_1119), MIA PaCa-2 (RRID: CVCL_0428), AsPC-1 (RRID: CVCL_0152) and Capan-1 (RRID: CVCL_0237) were purchased from the ATCC and were authenticated by short tandem repeat (STR) analysis. All cell lines were mycoplasma-free. Cells were grown in RPMI 1640 medium, supplemented with 10% FBS and 1% penicillin–streptomycin in a humidified incubator containing 5% CO2 at 37°C. All reagents for cell culture were purchased from Gibco/Thermo Fisher Scientific, Grand Island, NY.
NO• treatment, RNA isolation and quantitative real-time PCR
Cells were plated in 24-well plates at 30–50% confluence the day before treatment. On the following day, the medium was replenished with fresh medium supplemented with 0.5 mM nitric oxide donor drug Spermine/NONOate (SPER/NO; Cayman Chemical, Ann Arbor, MI). After 48 hr of treatment, cells were collected for total RNA isolation. Total RNA was extracted from frozen tumor samples and cultured cells with standard TRIzol protocol (Invitrogen/Thermo Fisher Scientific, Grand Island, NY). First-strand cDNA was synthesized with High Capacity cDNA Reverse Transcription Kit (Applied Biosystems, Thermo Fisher Scientific, Grand Island, NY) from total RNA and used for quantitative real-time PCR (qRT-PCR) using Taqman probes (Applied Biosystems/Thermo Fisher Scientific, Grand Island, NY) for corresponding target genes: IDO1 (Hs00984148_m1), RUNX3 (Hs01091094_m1), IDO2 (Hs01589373_m1), TDO2 (Hs00194611_m1), AHR (Hs00907314_m1), NRF2/NFE2L2 (Hs00975961_g1), interleukin 1, beta (IL1b; Hs01555410_m1), interleukin 6 (IL6; Hs00174131_m1), interleukin 8 (IL8; Hs00174103_m1), serpin family B member 2 (SERPINB2; Hs01010736_m1), RUNX3 (Hs01091094_m1).
Measurement of kynurenine and tryptophan in cell culture medium
Cells were cultured in RPMI medium supplemented with 0.5 mM nitric oxide donor SPER/NO for 48 hr, then culture medium was collected and centrifuged at 12,000 rpm for 10 min. Supernatant was used for metabolite measurement. In a 500 μl microcentrifuge tube, 20 μl of samples or standards were mixed with 20 μl of Isotopic Standard (IS), and 40 μl of trichloroacetic acid (TCA, 0.6 N). The supernatant was transferred to a HPLC vial for analysis. LC/MS/MS was performed with a Shimadzu 20AC-XR system followed by a TSQ Quantiva triple quadrupole mass spectrometer (Thermo Fisher Scientific, Grand Island, NY) operating in selected reaction monitoring mode with positive electrospray ionization at NCI-Frederic Mass Spectrometry core facility. The target peaks were detected using the following m/z precursor/product ions: kynurenine (209/192); d6-kynurenine (215/198); tryptophan (205/188), d5-tryptophan (210/192). Kynurenine and tryptophan in the samples were determined using the Thermo Xcalibur software. Calibration curves constructed by plotting the peak area ratios vs. standard concentration were fitted by linear regressions (R2 > 0.99). The peak area ratios were calculated by dividing the peak areas of kynurenine or tryptophan by the peak area of their respective isotopic standards. Analytical standards of tryptophan and kynurenine were obtained from Sigma-Aldrich, St. Louis, MO. The isotopic standards (IS) d5-Trp and d6-Kyn were obtained from Cambridge Isotope Laboratories, Tewksbury, MA. Stock solutions of the tryptophan metabolite standards and the IS were prepared in 50% acetonitrile. The calibration standards Kyn (0.08–5 μM) and Trp (0.8–50 μM) were prepared by diluting the stocks with water. The IS solution containing d6-Kyn (2 μM) and d5-Trp (10 μM) was prepared in water. Kynurenine and tryptophan concentration in the cell culture medium was measured before and after SPER/NO treatment. The level of kynurenine is presented as a ratio of kynurenine production to tryptophan consumption.
Immunohistochemistry
5 μm thick paraffin-embedded tumor sections were incubated with mouse monoclonal anti-NOS2 (BD Transduction Laboratories, Franklin Lakes, NJ) and rabbit monoclonal anti-IDO-1 antibody (Cell Signaling, Danvers, MA). Signals were amplified using biotinylated IgG, followed by horseradish peroxidase-conjugated avidin–biotin complex (Vectastain ABC Kit, Vector Lab, Burlingame, CA) and diaminobenzene (DAB) as the chromogen (Dako Envision System, Dako, Carpinter, CA). Immunostained slides were blindly evaluated by a board-certified pathologist to assign the intensity as well as prevalence score as described elsewhere.42 A score of 0–3, representing negative, weak, moderate or strong expression was assigned for intensity and prevalence was given a score of 0–4, representing <10%, 10–30%, >30–50%, >50–80% and >80% cells showing either NOS2 or IDO1 expression. Then the overall IHC score was obtained by adding the intensity and prevalence score.
Cell migration and invasion assay
Migration and invasion assays were performed with 24-well BD Falcon Cell Culture Insert and Corning Bio Coat Matrigel Invasion Chamber (BD Biosciences, Bedford, MA) using manufacturer’s protocol. Briefly, 105 cells in 500 μl serum-free DMEM were loaded into each upper insert, and 750 μl of appropriate medium with 10% FBS were added to the lower chamber. Kynurenine at 0, 10, 50 and 100 μM dose was supplemented in both upper and lower chambers.
Spheroid formation assay
Spheroid formation assay was performed using AlgiMatrix 3D Culture System (Gibco/Thermo Fisher Scientific, Grand Island, NY). Then, 105 cells were resuspended in culture medium supplemented with 0, 10, 50 and 100 uM kynurenine or DMSO and plated into a 24-well plate containing the 3D culture matrix. Cells were then cultured for 10 days in the presence of kynurenine, and medium was replenished every other day. Cells were then collected by dissolving the matrix and then fixed with 3.7% formaldehyde, stained with crystal violate, counted and measured with Image J software, NIH (https://imagej.nih.gov/ij/). More than 100 spheroids were measured for each treatment and control groups.
Chromatin immunoprecipitation
Chromatin immunoprecipitation (ChIP) was performed with ChIP-IT High Sensitivity® kit from Active Motif (Carlsbad, CA) following the manufacture’s protocol. Briefly, for each immunoprecipitation reaction, 107 cells were treated with or without 0.5 mM Sper/NO for 24 hr and then fixed with formaldehyde for 15 min. Nuclear fraction was then prepared according to the manufacturer’s protocol and chromatin was sheared to 500–800 bp fragments with a Bioruptor sonication device (Diagenode, Denville, NJ). Five percent of total extract was saved as input and the rest was used for immunoprecipitation with RUNX3 antibody (Santa Cruz, Dallas, TX). Recovered DNA samples were used as template for qRT-PCR with the following IDO1 primers purchased from IDT DNA Technology (Coralville, IA): positive primers: 5′-GCACAGAGATGCTTTTGTGGTTT-3′ and 5′-CCCCTCAGTGTCTGAAGAGTT-3′; negative primers: 5′-GC ATTCAATCAAATAGCAACAACT-3′ and 5′-CAGCCATGAA GCAATGGACC-3′.
Statistical analysis
Student’s t-test was used to evaluate the difference in mRNA expression, metabolite abundance level, cell spheroids size, invasion and immunohistochemistry score among different experimental groups. Kaplan–Meier analysis and Log Rank test was utilized to assess the difference in survival between two groups of PDAC patients. Pearson’s correlation was used to determine any correlation between the expression of genes or metabolite levels. These statistical analyses were performed using GraphPad Prizm 7.0. Univariable and multivariable Cox-regression analysis were performed using STATA 15 (StataCorp LP, College Station, TX). For all the statistical analyses p-value <0.05 was deemed statistically significant.
Data availability
All the data and other items supporting the results in this article are included as the Supporting Information. Additionally, any data that are minimally required to replicate the outcomes of the study will be made available upon reasonable request.
Results
Kynurenine positively associated with NOS2 and predicted prognosis in PDAC patients
We compared metabolic profile of tumors with a high (>median)- and low (<median)-NOS2 gene expression in a cohort of 63 PDAC patients (Fig. 1a; patients characteristics are described in Supporting Information Table S1). Seventeen metabolites with ≥1.5-fold difference in their relative level and a statistical significance of p < 0.05 were identified in NOS2-high vs. NOS2-low tumors. Among these metabolites the level of kynurenine showed the most significant association with survival by univariable Cox-regression analysis (HR = 2.24, 95% CI, 1.18–4.24; p = 0.01; Supporting Information Table S3), therefore, we investigated the role of kynurenine and its potential regulation by NOS2/NO• signaling in PDAC. A higher level of kynurenine was found in high-NOS2 tumors as compared to low-NOS2 tumors (p = 0.026), and patients with a higher level of kynurenine in tumors (upper quartile) showed poorer survival by Kaplan–Meier (Log Rank test, p = 0.01; Figs. 1a–1c) and multivariable (HR = 2.61, 95% CI, 1.24–5.51; p = 0.01) Cox regression analysis (Supporting Information Table S4). As kynurenine is a product of tryptophan metabolism, which is mediated by indoleamine 2,3-dioxygenase enzymes (IDO1 and IDO2) and tryptophan dioxygenase (TDO), we examined their association in PDAC tumors. Tumors with a higher (>median) IDO1 expression showed a higher kynurenine level as compared to tumors with low IDO1 expression (<median), and a positive correlation was observed between kynurenine level and IDO1 gene-expression (Supporting Information Figs. S1A and S1B). Although NOS2 positively correlated with TDO expression, no significant correlation was observed between NOS2 and IDO2 or Kynurenine and IDO2 or TDO (Supporting Information Fig. S1C). Taken together, these findings showed that the level of kynurenine in tumors is positively correlated with NOS2 expression and a higher kynurenine level is associated with poorer survival in PDAC patients. Furthermore, based on these findings, we hypothesized that NOS2/NO• signaling may enhance kynurenine level in tumors through the upregulation of IDO1.
Figure 1.

A higher level of kynurenine associated with increased NOS2 expression in tumors and predicted poorer survival in PDAC patients. (a), NOS2 mRNA expression, as determined by qRT-PCR, in tumors from NOS2-high (>median) and -low (<median) groups of patients. (b), Violin plot showing an increased level of kynurenine in NOS2-high as compared to NOS2- low tumors. (c), Kaplan–Meier curve showing that a higher level of kynurenine (>75th percentile) is associated with poorer patient survival as compared to patients with low kynurenine (<75th percentile).
NO• enhanced kynurenine production, IDO-1 expression and IDO-1/aryl hydrocarbon receptor-target genes
To test the hypothesis that NO• signaling enhances the production of kynurenine in pancreatic cancer, Panc-1, CFPac-1 and AsPC-1 pancreatic cancer cell lines were treated with 0.5 mM NO• donor drug Spermine/NONOate (Sper/NO), which resulted in an increased production of kynurenine as compared to control cells (p < 0.001; Fig. 2a). We then checked, if NO• affects the expression of IDO1 gene, which catalyzes the production of kynurenine and positively associated with Kynurenine in our analysis of tumors from PDAC patients, as described above (Supporting Information Figs. S1A and S1B). Sper/NO-treatment significantly enhanced the expression of IDO1 in pancreatic cancer cell lines (p < 0.01; Fig. 2b), suggesting that NO•-mediated increase in IDO1 may be responsible for the increased production of kynurenine. It is earlier described that endogenously produced kynurenine binds to aryl hydrocarbon receptor (AHR) in tumor cells leading to its translocation into the nucleus and activation of AHR-target genes, which promoted tumor cell survival and migration in human gliomas.20 Therefore, we examined the expression of known Kynurenine/AHR target genes after NO• treatment in pancreatic cancer cells. NO• treatment significantly increased the expression of NFE2L2 (Nrf2), SERPINB2, IL1b, IL6 and IL8, which are implicated in the development and progression of pancreatic cancer (Fig. 2c). Furthermore, an AHR antagonist, CH223191, suppressed the NO•-induced increase in expression of these target genes. Taken together these findings revealed that NO• signaling enhances IDO1 expression and kynurenine production, which subsequently augmented the expression of AHR-target genes.
Figure 2.
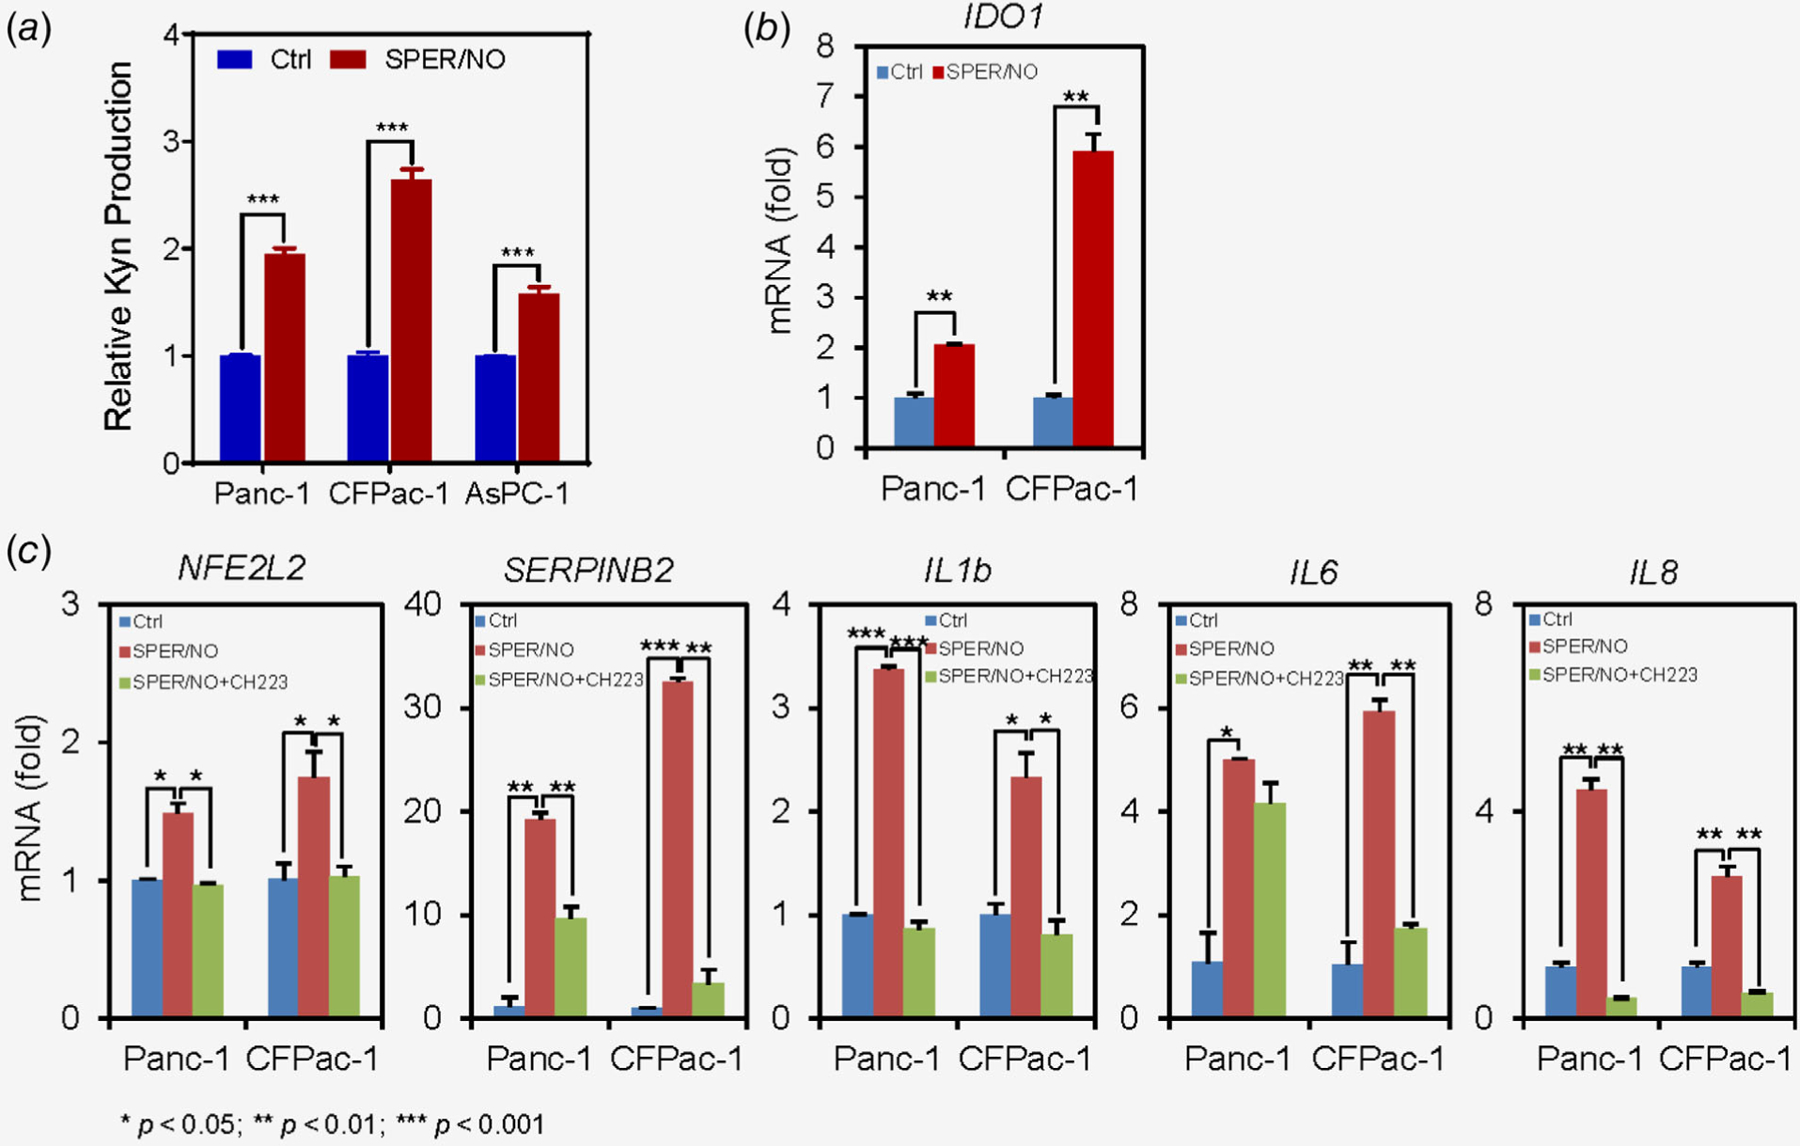
NO• regulates kynurenine production and expression of AHR-target genes. (a, b), Treatment of pancreatic cancer cell lines with 0.5 mM SPER/NO (NO• donor drug) enhanced kynurenine production and mRNA expression of IDO1 after 48 h. C, SPER/NO-treatment also resulted in the increased expression of AHR-target genes as compared to control. The increase in AHR-target genes expression was attenuated by CH223191, an AHR antagonist, when used in combination with SPER/NO. Each experiment was repeated at least three times.
NOS2, IDO-1 and AHR target genes expression are correlated in human PDAC
To understand the relevance of NO•-induced signaling in the regulation of AHR-target genes in human disease, we analyzed tumors from patients with PDAC (n = 63). Tumors with a higher NOS2 expression (>median) also expressed a high level of IDO1 as compared to tumors with a lower NOS2 expression (<median; p = 0.006) and a positive correlation existed between NOS2 and IDO1 (r = 0.43, p = 0.0005; Figs. 3a and 3b). Consistent with these findings immunohistochemical staining showed a positive correlation between NOS2 and IDO1 protein expression (r = 0.70, p = 0.0025; Fig. 3c). Additionally, high-NOS2 tumors showed an enhanced expression of AHR-target genes NFE2L2 (Nrf2), SERPINB2, IL1b, IL6 and IL8 as compared to low-NOS2 tumors and a positive correlation existed between NOS2 and the above-mentioned AHR-target genes (Figs. 3d and 3e). Furthermore, IDO1-high (>median) tumors also showed an upregulation in the expression of AHR-target genes and a positive correlation was found between IDO1 and AHR target genes NFE2L2 (Nrf2), SERPINB2, IL1b, IL6 and IL8 (Figs. 3f and 3g). These findings provide evidence of an association between NOS2, IDO1 and the regulation of AHR-target genes in human PDAC.
Figure 3.

NOS2, IDO-1 and AHR-target genes are positively correlated in human PDAC. (a) Tumors from PDAC patients with high NOS2 expression (>median) showed a higher IDO1 expression as compared to tumors with low NOS2 expression (<median). (b) A positive correlation between NOS2 and IDO1 gene expression. (c) Immunohistochemical staining showing an increased IDO1 protein expression in NOS2-high as compared to NOS2-low tumors. A positive correlation was found between NOS2 and IDO1 protein expression as determined by using IHC score. (d) NOS2-high tumors showed a positive correlation with AHR-target genes: NFE2L2 (Nrf2), SERPINB2, IL1b, IL6 and IL8 as compared to NOS2-low tumors. (e)A positive correlation was found between NOS2 and NFE2L2 (Nrf2), SERPINB2, IL1b, IL6 and IL8. (f ) Tumors from PDAC patients with high IDO1 expression (>median) showed a higher NFE2L2 (Nrf2), SERPINB2, IL1b, IL6 and IL8 expression as compared to tumors with low IDO-1 expression. (g), A positive correlation existed between IDO1 and NFE2L2, SERPINB2, IL1b, IL6 and IL8 expression in tumors from PDAC patients.
Kynurenine promoted growth of spheroids and invasiveness in pancreatic cancer cells
To examine the effect of kynurenine on cellular growth, Capan-1 pancreatic cancer cell spheroids were grown in 3D cultures and treated with 0, 10, 50 and 100 μM doses of kynurenine. Treatment with kynurenine resulted in enhanced growth of spheroids as compared to control in a dose-dependent manner (Figs. 4a and 4b). Next, we examined if kynurenine affects the invasive ability of pancreatic cancer cells. Panc-1 and Capan-1 pancreatic cancer cell lines were treated with different doses of kynurenine, as described above, which resulted in the increased invasiveness in a dose-dependent manner (Figs. 4c and 4d). These findings demonstrate that kynurenine enhances growth and invasiveness of pancreatic cancer cells.
Figure 4.

Kynurenine enhances pancreatic cancer cell spheroid growth and invasiveness. (a, b) Kynurenine treatment of pancreatic cancer cell line Capan-1 enhanced growth of spheroids in a dose-dependent manner (a minimum of 100 spheroids were measured for each treatment group using Image j, NIH, software). (c) Kynurenine treatment enhanced invasion of pancreatic cancer cell lines. All the experiments were repeated three times.
NO•-mediated regulation of kynurenine signaling involves RUNX3 transcription factor
As described above, our findings showed that NO• enhances IDO1 expression and kynurenine production, which results in the increased expression of Kynurenine/AHR-target genes. To further investigate the mechanism of NO•-mediated regulation of kynurenine signaling, we first investigated the potential IDO1 regulation by using UCSC genome browser and the transcription factor ChIP-seq data from the ENCODE Factorbook repository.21 This search identified ChIP-seq peak for the binding of RUNX3 transcription factor to IDO1 promoter (Fig. 5a). Furthermore, RUNX3 positively correlated with IDO1 (r = 0.73, p < 0.0001) and kynurenine (r = 0.32, p = 0.01) in tumors from patients with PDAC (Figs. 5b and 5c). Additionally, high-NOS2 tumors showed a higher expression of RUNX3 as compared to low-NOS2 tumors and a positive correlation existed between NOS2 and RUNX3 (r = 0.52, p < 0.0001; Figs. 5d and 5e). Based on these findings, we hypothesized that NO• may upregulate RUNX3 in pancreatic cancer. Treatment of pancreatic cancer cell lines Panc-1 and MiaPaCa-2 with NO• donor SPER/NO enhanced the mRNA and protein expression of RUNX3 (Figs. 5f and 5g). Furthermore, SPER/NO treatment enhanced the binding of RUNX3 to IDO1 promoter in these cell lines as determined by ChIP-PCR assay (Fig. 5h). Taken together, these findings show that NO• enhances the expression of RUNX3 and facilitates its binding to IDO1 promoter and also provides evidence of an association between NOS2 and RUNX3, RUNX3 and IDO-1 and RUNX3 and kynurenine production in human PDAC.
Figure 5.

NO•-induced regulation of kynurenine signaling is mediated by RUNX3 transcription factor. (a) ENCODE ChIP-seq data analysis identified RUNX3 binding site on IDO1 promoter. (b, c) RUNX3 showed a positive correlation with IDO1 gene expression and kynurenine level in tumors from PDAC patients. (d) NOS2-high tumors expressed a higher level of RUNX3 as compared to NOS2-low tumors. (e) RUNX3 positively correlated with NOS2 expression in human PDAC tumors. (f, g) Treatment of pancreatic cancer cell lines with 0.5 mM SPER/NO (NO• donor drug) enhanced RUNX3 expression as shown by qRT-PCR and immunoblotting. (h), ChIP-qPCR showing an enhanced binding of RUNX3 to IDO1 promoter in pancreatic cancer cell lines after SPER/NO treatment.
Discussion
Inflammatory signaling pathways and metabolic alterations are key biological elements supporting pancreatic cancer progression and disease aggressiveness.22–25 These events may independently and/or interactively contribute to tumorigenesis. Inflammatory mediators including cytokines, chemokines and free radicals are implicated in influencing metabolic alterations in tumorigenesis.6 However, the role of inflammatory signaling pathways in the regulation of metabolic adaptations are not adequately described in pancreatic cancer. One of the inflammatory and immune mediators, NO•, is implicated in tumorigenesis.5,15 NOS2/NO• signaling enhances pancreatic cancer progression and a higher NOS2 expression is associated with poor patient survival.14 In this study, we have investigated the role of NOS2/NO•-mediated signaling pathway in the regulation of metabolic alterations in human PDAC. Untargeted metabolic profiling of tumors from PDAC patients with a high- (>median) and low (<median)-NOS2 expression identified a previously undescribed NO•/RUNX3/kynurenine metabolic signaling, which enhanced the expression of AHR-target genes involved in tumorigenesis and predict poor patient outcome.
Kynurenine is a metabolite produced by tryptophan metabolism, which is catalyzed by IDO1/2 and TDO enzymes in both tumor and immune cells.26 kynurenine is an endogenous ligand to AHR.20 Kynurenine binds to AHR in both autocrine and paracrine fashion, which results in the nuclear translocation of AHR and expression of AHR-target genes leading to immune tolerance and migration of tumor cells.20,27 However, the role of kynurenine in pancreatic cancer growth and progression is not clear. Our findings of an association between increased level of kynurenine in tumors and worse survival in early-stage resected patients suggested a potential role of kynurenine in pancreatic cancer progression and disease aggressiveness. However, this analysis has been conducted in patients from a single cohort and further analysis in additional independent cohort would strengthen this observation. Additionally, enhanced growth of pancreatic cancer cell spheroids and migration of pancreatic cancer cells after kynurenine treatment in a dose-dependent manner are consistent with the hypothesis that kynurenine enhances pancreatic cancer growth and progression.
Understanding the regulation of metabolic adaptations may identify critical metabolic regulatory elements that may be potentially targeted to impede tumor progression in PDAC. As mentioned earlier, inflammatory mediators are implicated in the modulation of metabolic processes. An increased level of kynurenine in NOS2-high as compared to NOS2-low tumors in PDAC patients in our study suggested an association between NOS2/NO•-signaling pathway and kynurenine production. Enhanced kynurenine production in pancreatic cancer cell lines upon treatment with NO• donor SPER/NO is consistent with this hypothesis. It is earlier described that IDO1/2 and TDO catalyzes tryptophan metabolism and production of kynurenine. In line with these earlier studies, PDAC tumors with higher IDO1 expression showed a higher level of kynurenine as compared to tumors with a low IDO1 and there existed a positive correlation between IDO1 and kynurenine. Additionally, based on our findings showing a higher IDO1 gene expression in NOS2-high tumors as compared to NOS2-low tumors and a positive correlation between NOS2 and IDO1, we hypothesized that NOS2/NO• signaling may regulate IDO1 expression. Our data showing an increased IDO1 expression after treatment of pancreatic cancer cells with NO• are consistent with this hypothesis. Further mechanistic and functional analysis to elucidate NO•-induced kynurenine signaling identified NO•-induced RUNX3 transcription factor which regulated the expression of IDO1 through binding to its promoter. A positive correlation between RUNX3 and NOS2, RUNX3 and IDO1 and RUNX3 and kynurenine in tumors further indicated their relevance in human PDAC. RUNX3 has been earlier defined as a critical regulator of pancreatic cancer growth and metastasis.28 These findings suggested that NO•-induced increase in kynurenine production is mediated through RUNX3 and IDO1 in PDAC.
Kynurenine binding to AHR results in the expression of AHR-target genes which enhances malignant progression of human gliomas.20 NO•-treatment enhanced the expression of several AHR-target genes including NFE2L2 (Nrf2), SERPINB2, IL-1b, IL-6 and IL8, which could be blocked by an AHR-antagonist CH223191 in pancreatic cancer cell lines, confirming that NO•-induced expression of these genes is mediated through the activation of AHR. Furthermore, a higher expression of these AHR-target genes in NOS2-high and IDO1-high tumors as compared to NOS2-low and IDO1-low tumors indicate the potential clinical relevance of NO•-induced expression of AHR-target genes in human PDAC. NFE2L2 encodes for Nrf2, which is a key regulator of antioxidant machinery and favors pancreatic cancer growth and progression.29 Similarly, cytokines including IL-1b, IL-6 and IL-8 are implicated in tumorigenesis and their increased expression is associated with the development, progression and therapeutic resistance in pancreatic cancer.30–35 The role of SERPINB2, which encodes the plasminogen activator inhibitor 2, is context-dependent in cancer and both tumor-suppressing and promoting functions are reported.36,37 However, a potential tumor-suppressive role of SERPINB2 is earlier described in pancreatic cancer.38 Therefore, the significance of SERPINB2 in the context of NO•/Kynurenine/AHR mediated signaling in pancreatic cancer needs further clarification. These findings suggested that NO•-mediated upregulation of kynurenine, AHR activation and expression of AHR target genes are biologically relevant to the progression of pancreatic cancer.
Taken together, our findings describe a novel NO•/RUNX3/kynurenine metabolic signaling pathway (Fig. 6), which enhances pancreatic cancer progression and disease aggressiveness and may be useful in designing novel strategies to improve patient outcome.
Figure 6.

NO•-RUNX3-kynurenine metabolic axis: Schema showing NO•-RUNX3-Kynurenine axis, which enhances the expression of protumorigenic AHR-target genes in pancreatic cancer.
Supplementary Material
What’s new?
Metabolic reprogramming is a key biological event supporting pancreatic cancer progression but the regulatory mechanisms of metabolic adaptations in the tumors are not well defined. Here the authors focused on inflammatory signaling pathways and performed metabolic profiling of tumors with high or low inducible nitric oxide synthetase expression. They define a new metabolic axis composed of nitric oxide, the transcription factor RUNX3 and the tryptophan metabolite kynurenine that correlates with disease aggressiveness and may be useful in designing novel therapeutic approaches to improve patient outcome.
Acknowledgements
Authors thank Ms. Elise Bowman for the management of clinical samples, and the personnel at the University of Maryland Medical System for collection of clinical biospecimens using an IRB approved protocol and patient consent under NCI-UMD resource contract. This work was supported by the Intramural Research Program of the Center for Cancer Research, NCI, NIH. Intramural Research Program of the Center for Cancer Research, NCI, NIH.
Grant sponsor:
National Cancer Institute
Abbreviations:
- AHR
aryl hydrocarbon receptor
- CH223191
1-methyl-N-[2-methyl-4-[2-(2-methylphenyl)diazenyl]phen yl-1H-pyrazole-5-carboxamide
- ChIP
chromatin immunoprecipitation
- DAB
diaminobenzene
- IDO1
indoleamine-2,3-dioxygenase 1
- IDO2
indoleamine-2,3-dioxygenase 2
- IL1b
interleukin 1, beta
- IL6
interleukin 6
- IL8
interleukin 8
- MS
mass spectrometry
- NFE2L2
nuclear factor, erythroid 2 like 2
- NO
nitric oxide
- NOS2
nitric oxide synthase 2 (inducible nitric oxide synthase)
- NRF2
NFE2-related factor 2
- PDAC
pancreatic ductal adenocarcinoma
- qRT-PCR
quantitative real-time PCR
- RUNX3
RUNX family transcription factor 3
- SERPINB2
serpin family B member 2
- SPER/NO
spermine NONOate, N-[4-[1-(3-Aminopropyl)-2-hydroxy-2-nitrosohydrazino]butyl]-1,3-propanediamine
- STR
short tandem repeat
- TCA
trichloroacetic acid
- TDO
tryptophan dioxygenase
- UHPLC
ultra-high performance liquid chromatography
Footnotes
Additional Supporting Information may be found in the online version of this article.
Conflict of interest: The authors declare no competing financial interest.
References
- 1.Siegel RL, Miller KD, Jemal A. Cancer statistics, 2019. CA Cancer J Clin 2019;69:7–34. [DOI] [PubMed] [Google Scholar]
- 2.Sousa CM, Biancur DE, Wang X, et al. Pancreatic stellate cells support tumour metabolism through autophagic alanine secretion. Nature 2016;536: 479–83. [DOI] [PMC free article] [PubMed] [Google Scholar]
- 3.Sousa CM, Kimmelman AC. The complex landscape of pancreatic cancer metabolism. Carcinogenesis 2014;35:1441–50. [DOI] [PMC free article] [PubMed] [Google Scholar]
- 4.Perera RM, Bardeesy N. Pancreatic cancer metabolism: breaking it down to build it Back up. Cancer Discov 2015;5:1247–61. [DOI] [PMC free article] [PubMed] [Google Scholar]
- 5.Hussain SP, Hofseth LJ, Harris CC. Radical causes of cancer. Nat Rev Cancer 2003;3:276–85. [DOI] [PubMed] [Google Scholar]
- 6.Hotamisligil GS. Inflammation and metabolic disorders. Nature 2006;444:860–7. [DOI] [PubMed] [Google Scholar]
- 7.Lashinger LM, Rossi EL, Hursting SD. Obesity and resistance to cancer chemotherapy: interacting roles of inflammation and metabolic dysregulation. Clin Pharmacol Ther 2014;96:458–63. [DOI] [PubMed] [Google Scholar]
- 8.Harvey AE, Lashinger LM, Hays D, et al. Calorie restriction decreases murine and human pancreatic tumor cell growth, nuclear factor-kappaB activation, and inflammation-related gene expression in an insulin-like growth factor-1-dependent manner. PLoS One 2014;9:e94151. [DOI] [PMC free article] [PubMed] [Google Scholar]
- 9.Zubair H, Azim S, Srivastava SK, et al. Glucose metabolism reprogrammed by overexpression of IKKepsilon promotes pancreatic tumor growth. Cancer Res 2016;76:7254–64. [DOI] [PMC free article] [PubMed] [Google Scholar]
- 10.Cheng A, Guo J, Henderson-Jackson E, et al. IkappaB kinase epsilon expression in pancreatic ductal adenocarcinoma. Am J Clin Pathol 2011;136:60–6. [DOI] [PMC free article] [PubMed] [Google Scholar]
- 11.Tamir S, Tannenbaum SR. The role of nitric oxide (NO.) in the carcinogenic process. Biochim Biophys Acta 1996;1288:F31–6. [DOI] [PubMed] [Google Scholar]
- 12.Bredt DS, Snyder SH. Nitric oxide: a physiologic messenger molecule. Annu Rev Biochem 1994;63:175–95. [DOI] [PubMed] [Google Scholar]
- 13.Geller DA, Billiar TR. Molecular biology of nitric oxide synthases. Cancer Metastasis Rev 1998; 17:7–23. [DOI] [PubMed] [Google Scholar]
- 14.Wang J, He P, Gaida M, et al. Inducible nitric oxide synthase enhances disease aggressiveness in pancreatic cancer. Oncotarget 2016;7:52993–3004. [DOI] [PMC free article] [PubMed] [Google Scholar]
- 15.Wang J, Hussain SP. NO(*) and pancreatic cancer: a complex interaction with therapeutic potential. Antioxid Redox Signal 2017;26:1000–8. [DOI] [PMC free article] [PubMed] [Google Scholar]
- 16.Bailey P, Chang DK, Forget MA, et al. Exploiting the neoantigen landscape for immunotherapy of pancreatic ductal adenocarcinoma. Sci Rep 2016;6:35848. [DOI] [PMC free article] [PubMed] [Google Scholar]
- 17.Chang CF, Diers AR, Hogg N. Cancer cell metabolism and the modulating effects of nitric oxide. Free Radic Biol Med 2015;79:324–36. [DOI] [PMC free article] [PubMed] [Google Scholar]
- 18.De Vitto H, Mendonca BS, Elseth KM, et al. Part III. Molecular changes induced by high nitric oxide adaptation in human breast cancer cell line BT-20 (BT-20-HNO): a switch from aerobic to anaerobic metabolism. Tumour Biol 2013;34: 403–13. [DOI] [PubMed] [Google Scholar]
- 19.Caneba CA, Yang L, Baddour J, et al. Nitric oxide is a positive regulator of the Warburg effect in ovarian cancer cells. Cell Death Dis 2014;5:e1302. [DOI] [PMC free article] [PubMed] [Google Scholar]
- 20.Opitz CA, Litzenburger UM, Sahm F, et al. An endogenous tumour-promoting ligand of the human aryl hydrocarbon receptor. Nature 2011; 478:197–203. [DOI] [PubMed] [Google Scholar]
- 21.Wang J, Zhuang J, Iyer S, et al. Sequence features and chromatin structure around the genomic regions bound by 119 human transcription factors. Genome Res 2012;22:1798–812. [DOI] [PMC free article] [PubMed] [Google Scholar]
- 22.Ying H, Kimmelman AC, Lyssiotis CA, et al. Oncogenic Kras maintains pancreatic tumors through regulation of anabolic glucose metabolism. Cell 2012;149:656–70. [DOI] [PMC free article] [PubMed] [Google Scholar]
- 23.Shukla SK, Purohit V, Mehla K, et al. MUC1 and HIF-1alpha Signaling crosstalk induces anabolic glucose metabolism to impart gemcitabine resistance to pancreatic cancer. Cancer Cell 2017;32: 71–87 e7. [DOI] [PMC free article] [PubMed] [Google Scholar]
- 24.Son J, Lyssiotis CA, Ying H, et al. Glutamine supports pancreatic cancer growth through a KRAS-regulated metabolic pathway. Nature 2013;496: 101–5. [DOI] [PMC free article] [PubMed] [Google Scholar]
- 25.Gukovsky I, Li N, Todoric J, et al. Inflammation, autophagy, and obesity: common features in the pathogenesis of pancreatitis and pancreatic cancer. Gastroenterology 2013;144:1199–209 e4. [DOI] [PMC free article] [PubMed] [Google Scholar]
- 26.Zhai L, Spranger S, Binder DC, et al. Molecular pathways: targeting IDO1 and other tryptophan dioxygenases for cancer immunotherapy. Clin Cancer Res 2015;21:5427–33. [DOI] [PMC free article] [PubMed] [Google Scholar]
- 27.Prendergast GC. Cancer: why tumours eat tryptophan. Nature 2011;478:192–4. [DOI] [PubMed] [Google Scholar]
- 28.Whittle MC, Izeradjene K, Rani PG, et al. RUNX3 controls a metastatic switch in pancreatic ductal adenocarcinoma. Cell 2015;161:1345–60. [DOI] [PMC free article] [PubMed] [Google Scholar]
- 29.DeNicola GM, Karreth FA, Humpton TJ, et al. Oncogene-induced Nrf2 transcription promotes ROS detoxification and tumorigenesis. Nature 2011;475:106–9. [DOI] [PMC free article] [PubMed] [Google Scholar]
- 30.Zhang D, Li L, Jiang H, et al. Tumor–stroma IL1β-IRAK4 feedforward circuitry drives tumor fibrosis, Chemoresistance, and poor prognosis in pancreatic cancer. Cancer Res 2018;78:1700–12. [DOI] [PMC free article] [PubMed] [Google Scholar]
- 31.Biffi G, Oni TE, Spielman B, et al. IL1-induced JAK/STAT Signaling is antagonized by TGFbeta to shape CAF heterogeneity in pancreatic ductal adenocarcinoma. Cancer Discov 2018;9:282–301. [DOI] [PMC free article] [PubMed] [Google Scholar]
- 32.Zhang Y, Yan W, Collins MA, et al. Interleukin-6 is required for pancreatic cancer progression by promoting MAPK signaling activation and oxidative stress resistance. Cancer Res 2013;73: 6359–74. [DOI] [PMC free article] [PubMed] [Google Scholar]
- 33.Mace TA, Shakya R, Pitarresi JR, et al. IL-6 and PD-L1 antibody blockade combination therapy reduces tumour progression in murine models of pancreatic cancer. Gut 2018;67:320–32. [DOI] [PMC free article] [PubMed] [Google Scholar]
- 34.Chen L, Fan J, Chen H, et al. The IL-8/CXCR1 axis is associated with cancer stem cell-like properties and correlates with clinical prognosis in human pancreatic cancer cases. Sci Rep 2014;4: 5911. [DOI] [PMC free article] [PubMed] [Google Scholar]
- 35.Matsuo Y, Ochi N, Sawai H, et al. CXCL8/IL-8 and CXCL12/SDF-1alpha co-operatively promote invasiveness and angiogenesis in pancreatic cancer. Int J Cancer 2009;124:853–61. [DOI] [PMC free article] [PubMed] [Google Scholar]
- 36.Jin T, Suk Kim H, Ki Choi S, et al. microRNA-200c/141 upregulates SerpinB2 to promote breast cancer cell metastasis and reduce patient survival. Oncotarget 2017;8:32769–82. [DOI] [PMC free article] [PubMed] [Google Scholar]
- 37.Huang Z, Li H, Huang Q, et al. SERPINB2 down-regulation contributes to chemoresistance in head and neck cancer. Mol Carcinog 2014;53: 777–86. [DOI] [PubMed] [Google Scholar]
- 38.Harris NLE, Vennin C, Conway JRW, et al. SerpinB2 regulates stromal remodelling and local invasion in pancreatic cancer. Oncogene 2017;36: 4288–98. [DOI] [PMC free article] [PubMed] [Google Scholar]
- 39.Evans AM, DeHaven CD, Barrett T, et al. Integrated, nontargeted ultrahigh performance liquid chromatography/electrospray ionization tandem mass spectrometry platform for the identification and relative quantification of the small-molecule complement of biological systems. Anal Chem 2009;81:6656–67. [DOI] [PubMed] [Google Scholar]
- 40.Budhu A, Roessler S, Zhao X, et al. Integrated metabolite and gene expression profiles identify lipid biomarkers associated with progression of hepatocellular carcinoma and patient outcomes. Gastroenterology 2013;144:1066–75 e1. [DOI] [PMC free article] [PubMed] [Google Scholar]
- 41.Zhang G, He P, Tan H, et al. Integration of metabolomics and transcriptomics revealed a fatty acid network exerting growth inhibitory effects in human pancreatic cancer. Clin Cancer Res 2013; 19:4983–93. [DOI] [PMC free article] [PubMed] [Google Scholar]
- 42.Glynn SA, Boersma BJ, Dorsey TH, et al. Increased NOS2 predicts poor survival in estrogen receptor-negative breast cancer patients. J Clin Invest 2010;120:3843–54. [DOI] [PMC free article] [PubMed] [Google Scholar]
Associated Data
This section collects any data citations, data availability statements, or supplementary materials included in this article.
Supplementary Materials
Data Availability Statement
All the data and other items supporting the results in this article are included as the Supporting Information. Additionally, any data that are minimally required to replicate the outcomes of the study will be made available upon reasonable request.