Abstract
Abstract
Bioflavonoids such as hesperidin and hesperetin as anticancer and antioxidant agents are widely used in the formulation of many herbal drugs. Recently, promising evidence for the prevention and treatment of COVID 19 using these compounds has been reported. Unfortunately, these compounds are often insoluble in aqueous media and have low stability in gastric acid environment. These factors reduced the bioavailability of related oral dosage forms in digestive system. Reduction of particle size and controlled release delivery system can decline the mentioned problems. In the presented research, extraction of bioflavonoids from Citrus sinensis L. (sweet orange) peels was performed using supercritical carbon dioxide. Experimental central composite design was employed for determination of optimal conditions. Qualification analysis was performed using LC–MS, and hesperidin and hesperetin were identified in herbal extract. Micronization and coating of the flavonoids nanoparticles on sugar spheres have been performed using an inhouse developed supercritical technique. Characterization of coated nanoparticles was done using FESEM and ImageJ software. The in vitro antioxidant activity of coated samples was investigated by ferrous ion chelating activity. According to the extraction results, concentration of ethanol as organic co-solvent has the greatest effect on the extraction yield. Analysis of FESEM images illustrated that nanoparticles of extract components with particle size distribution of 5–100 nm were coated successfully. The solubility and antioxidant activity of nanoparticles in aqueous media have increased significantly compared to original form. This process led to increasing dissolution rate and improving the oral bioavailability of flavonoids.
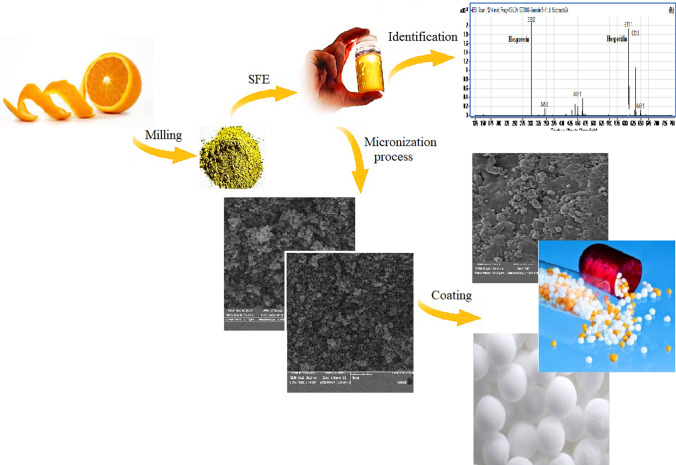
Graphical abstract
Keywords: Citrus sinensis L., Flavonoids, Supercritical fluid, Nanoparticle, Film coating
Introduction
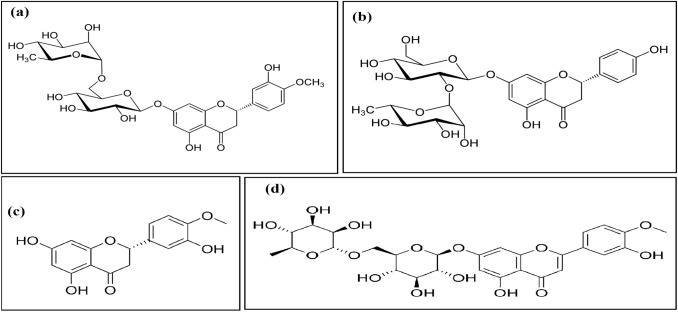
Citrus sinensis L., commonly called sweet orange (Rutaceae family), is planted in more than 100 countries all over the world. Brazil, China and India are the three largest producers of orange [1]. Annually, a lot of orange peel is produced in the production of juice as by-product. There are several phenolic compounds in these wastes such as hesperidin, hesperetin, naringin and diosmin which are mostly known as flavonoid glycoside (Fig. 1). Based on the phytochemical analysis, the main flavonoid in the sweet orange peels is hesperidin (47.8 mg/g dry peel) [2, 3]. According to previous studies, flavonoids have medicinal properties such as anticancer, inflammatory, antibacterial, antiapoptotic, antiallergic and antioxidant activities. Also, positive effects on blood pressure control and cholesterol decreasing have been reported [4–8].
Fig. 1.
Chemical structure of a hesperidin, b naringin, c hesperetin and d diosmin as main flavonoids in the peels of Citrus sinensis L. peels
Microwave-assisted extraction (MAE), maceration, ultrasound-assisted extraction (UAE) and Soxhlet extraction are conventional procedures for extraction of phytochemicals from plant organs. These methods suffer from disadvantages such as the consumption of toxic solvents, cost, time wasting and extended concentration steps. Besides, most of natural compounds are unstable in thermal conditions and the target analytes can loss or degrade [9, 10]. Recently, supercritical fluids especially carbon dioxide have been considered for herbal extraction of natural products. There are some advantages in usage of this technique including environmentally friendly nature, elimination of organic solvent and economic efficiency. Among the various supercritical fluids, carbon dioxide has specific advantages including low viscosity and surface tension, non-flammable and explosive, chemically inert and no pollution [11–15].
Flavonoids are almost insoluble or slightly soluble in water which ultimately leads to low drug absorption in digestive system from oral solid dosage forms and hence low bioavailability [16–18]. Size distribution and morphology of particles have impressive effect on solubility of powders. Accordingly, micronization process can be considered as an effective methodology to improve the dissolution rate of poorly water-soluble pharmaceutical compounds [19, 20]. Conventional methods for micronization of particles such as grinding, recrystallization and spray drying suffer from disadvantages including destruction of the most organic components like pharmaceutical ingredients in thermally conditions of spray driers or mills and residual solvents in recrystallization process [21, 22]. Using supercritical fluids for precipitation and micronization of particles has been applied as a new technology. By consideration the nature of compounds and substance, different techniques such as anti-solvent processes [gas anti-solvent (GAS), supercritical anti-solvent (SAS)], aerosol solvent extraction system (ASES), rapid expansion of supercritical solutions (RESS), controlled expansion of supercritical solution (CESS), solution-enhanced dispersion by supercritical fluids (SEDS) and particles from gas-saturated solutions/suspensions (PGSS) have been proposed [23–26].
Besides, hesperidin and other flavonoids are unstable at gastric acid and undergo degradation which leads to a low bioavailability in gastrointestinal tract [27, 28]. Encapsulation and controlled release delivery system are effective methods to obtain gastro-resistant and controlled release dosage forms such as pellets and granules [29, 30]. There are two general methods to palletization of pharmaceutics. The first procedure is based on the use of sugar spheres and coating of the active substance, and in the second method, direct palletization of the mixtures of active drug and excipient is considered. In the coating formulation, active pharmaceutical ingredients (API) are coated on sugar spheres (also called neutral pellets, nonpareil seeds, microgranules or sugar beads) as a spherical retaining surface, and sustained release additives like pH-resistant polymers will be coated in the next steps [31]. Film coating of pharmaceutics on spheres is an essential part in the formulation of enteric-coated pellets [32]. Conventional coating techniques are based on spraying solutions using fluidized bed coaters. Both aqueous- and organic-based film coating has some disadvantages such as solvent exposure, requirement for solvent evaporation and the low-temperature stability of drugs. Solventless coating was applied in recent studies to eliminate the drawbacks of liquid coating technology. Compression coating, hot-melt coating, electrostatic coating, dry powder coating and photocurable coating are some of these techniques [33–35]. Recently, the use of supercritical fluids for disposal of active pharmaceutical ingredients on cores has been considered. This environmentally friendly process is performed without heating and therefore can introduce an effective technique for coating of pharmaceutics which are temperature sensitive [36, 37].
In the presented study, flavonoids of sweet orange peels were extracted through supercritical extraction process. Experimental design including 2(n−1) fractional factorial and central composite design (CCD) was employed to evaluation and optimization of effective parameters on extraction yield. These parameters were pressure, dynamic and static extraction time, temperature and modifier volume. Supercritical herbal extract of sweet orange peels was analyzed using liquid chromatography–mass spectrometry (LC–MS). In this analysis, flavonoids like hesperidin and hesperetin were identified. Micronization technique, applied in this study, has been presented by our team work for the first time [38–41]. In the presented methodology, precipitation process was occurring by decreasing supercritical solvent density and hence dissolution rate of solute, whereas in routine methods like RESS or SAS, the basis of precipitation process is evaporation of solvent or anti-solvent activity of supercritical fluid. Solvation and many collisions between solvent molecules and primary precipitate nuclei lead to reduction of coagulation rate. In these conditions, particle size is much lower than the previous methods which were proposed. Field emission scanning electron microscopy (FESEM) was applied to characterizations of the collected nanoparticles and determination of particle size. Effective parameters such as pressure, temperature and time were investigated, and optimum micronization conditions were determined.
In order to prepare the sustained release pellets, film coating of extract nanoparticles on sugar spheres was carried out at optimal micronization conditions using an apparatus developed in house. In this method, sugar spheres rotate in the precipitation vessel at a certain speed and extract nanoparticles are uniformly coated on the surface of spheres. In this process, micronization and drug coating were done simultaneously and coating of sustained release polymers can be done in ordinary fluid bed coater. The coated spheres were evaluated for particle size, subjected to FESEM. To investigate the effect of micronization process on solubility and antioxidant activity of flavonoids in aqueous media, the chelation of ferrous ions by coated compounds was estimated according to the method presented by Dinis et al. [42]
Materials and methods
Chemicals and sample preparation
Ethanol, ethyl acetate, acetonitrile and cyclohexane (HPLC grade) were supplied from Merck Co. (Darmstadt, Germany). Formic acid was supplied by Fluka Co. (distributed by Sigma–Aldrich, Allentown, PA, USA). 3-(2-Pyridyl)-5,6-diphenyl-1,2,4-triazine-4′,4′′-disulfonic acid sodium salt (ferrozine) and iron (II) chloride tetrahydrate were purchased from Sigma-Aldrich (Germany). Pharmaceutical grade sugar spheres with a diameter range of 350–500 µm were supplied by MB Sugars & Pharmaceuticals LTD Co. (India) and carbon dioxide with 99.99% purity at analytical grade stored in a cylinder which was supplied from Roham Co. (Tehran, Iran). Sweet oranges (Citrus sinensis L.) were obtained from a local fruit shop in Tehran, Iran. All the fruits were of eating quality and without blemishes. After separation of peels, they were stored at a dark place for a week in order to loss their moisture and then a laboratory mill was applied to grind them to coarse powder (Myson, China).
Supercritical fluid extraction
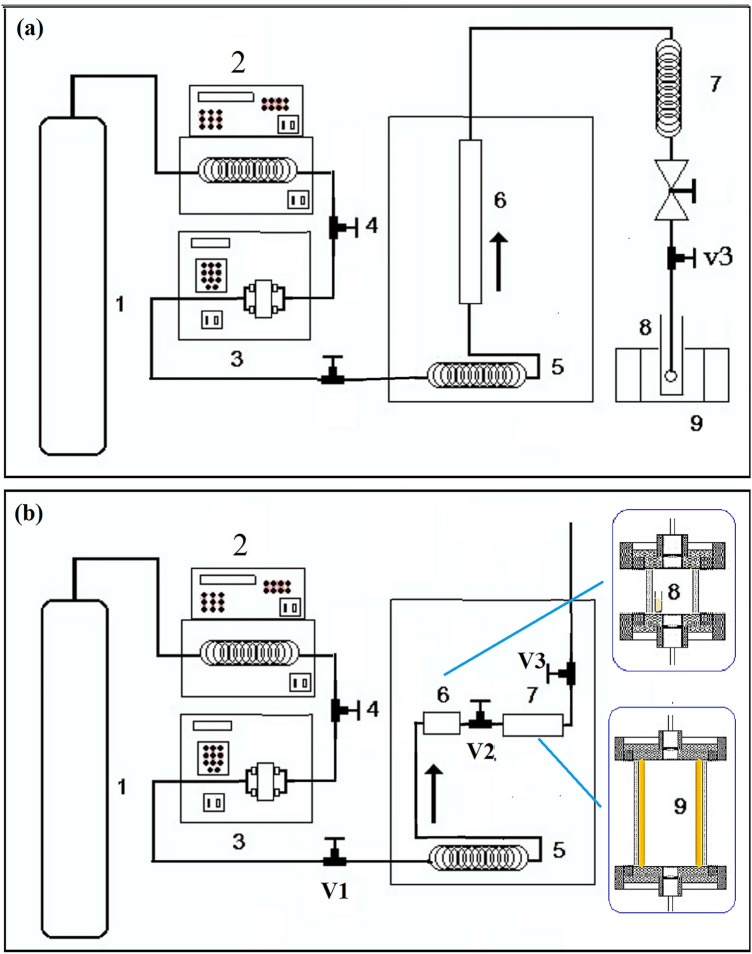
A Suprex MPS/225 system (Pittsburgh, PA) in the SFE mode was used for herbal extraction of flavonoids as shown in Fig. 2a. In each experiment, 1.00 g of sweet orange peels powder with a few glass beads (diameter of 0.5 mm) was loaded into a stainless steel extraction vessel (volume of 5.00 mL) (6). To evaluate the effect of co-solvent in extraction yield, different amounts of modifier were added to sample. A chillier (2) was used to decrease the temperature of CO2 to 0 °C before pumping using a syringe pump (3). A back-pressure regulator was used to control the pressure, and a restrictor (Dura flow manual variable; Suprex Co.) (7) was used to avoid sample plugging. When the pressure of CO2 raised to programmed pressure and after the equilibration time has elapsed, valve V3 was opened and the extraction solution was directed to the collector (8). To improve the efficiency of extraction and prevent solvent evaporation during collection, a 5.00-mL volumetric flask as collector was put in an ice bath (9). In this step, the flow rate was kept constant in 0.30 ± 0.05 mL min−1 and 3.00 mL of ethanol was loaded as solvent. At the end of each run, collected samples were diluted to 5. 00 mL and filtered using a 0.22-μm syringe filter (Microlab, china) and maintained for LC–MS analysis.
Fig. 2.
a Schematic diagram of supercritical fluid extractor including: (1) CO2 cylinder, (2) chiller, (3) syringe pump, (4) back-pressure valve, (5) heat exchanger, (6) extraction vessel, (7) restrictor, (8) collection vessel and (9) ice bath. b Schematic diagram of supercritical fluid precipitation apparatus: (1) CO2 cylinder, (2) chiller, (3) syringe pump, (4) back-pressure valve, (5) heat exchanger, (6) equilibration vessel, (7) precipitation vessel, (8) polyethylene vial for loading of sample and (9) collector (mica sheet)
Co-solvent (Modifier) selection
Several solvents with different polarities (ethanol, ethyl acetate and cyclohexane) were applied to extraction of flavonoids separately. In each experiment, 0.5 g of orange peel powder was weighed and diluted with desired solvent to 20 mL. Each sample was sonicated in constant conditions (time: 30 min, temperature: 40 °C and frequency: 40 kHz) in a sonication bath (Labsonic LBS 1-H3, 250 W, Falk Co. Ltd., Italy).
In the next, sediments were filtrated using a vacuum filtration and dryness of solvent was done at 60 °C. The following equation was applied to calculate the extraction yield (EY%):
In the presented equation, W2 presents the weight of residue extract and W1 presents the weight of orange peel powder.
Optimization of supercritical extraction
The Stat Graphics software (plus 5.1 package) was used for data analysis and the experimental design matrix. Here, the effective parameters were studied using a central composite design method (CCD) containing 2n factorial points, 2n star points and 3 central points, and results were investigated by ANOVA test. In experimental design, extraction temperature and static extraction time were selected at 50 °C and 15 min, respectively. Other parameters including extraction pressure in 150 and 350 atm (× 1), dynamic extraction time in 30 and 60 min (× 2) and modifier volume in 0 and 200 μl (× 3) were considered as effective parameters. The expression (2P + 2P + C) was applied for the determination the number of experiments, in this equation, P presents the number of factors and C presents the number of center points, and in the result, 17 runs were done randomly in this study. The measured response in each experiment was extraction yield (EY %).
Analysis of herbal extract
Flavonoids of hesperidin and hesperetin in extract samples were identified by LC–MS. In these experiments, liquid chromatography system (Agilent 1200) was connected to a triple quadrupole tandem mass spectrometer (Agilent 6410) via ESI source (Waldron, Germany). The mass analyzer was set in positive ion mode (ESI +), and electrospray capillary potential was set to 4000 V. Ultrapure nitrogen was applied as a nebulizer gas (flow rate of 10 L min-1) and drying gas for solvent evaporation (40 psi). Here, argon was selected as collision gas and the temperature of capillary head was set in 300 °C. MassHunter workstation was applied for acquiring the data and analysis them. It should be mentioned that the reported method was applied to select the HPLC chromatographic conditions as described in the following [43]. A gradient elution was performed and the composition of mobile phases A and B was 0.1% of formic acid and acetonitrile, respectively. The flow rate was set in 0.5 mL min−1, and the gradient elution was 75% A (t = 0–2 min), 70% A (t = 2–4 min), 68% A (t = 4–8 min), 45% A (t = 8–35 min). The LC column was StableBond-C18, 80 Å, 1.8 µm, 2.1 × 50 mm (Agilent, USA). Sample preparation was done with diluting of 1.00 mL extraction sample to 20 mL with ethanol, and in each run, injection volume was 10 μL. The mode of instrument was selected full scan and was done ranging from 100 to 700 m/z.
Micronization process
The method applied for micronization process was according to the previous report which was introduced by Raofi et al. [38–41]. The equipment which has been applied in this step is shown in Fig. 2b. A stainless steel equilibration vessel (volume of 5.00 mL) (6) was coupled to precipitation vessel (volume of 25 mL) (7), and 0.1-μm stainless steel filters were placed in both sides of vessels.
A polyethylene vial (volume of 1.00 mL) (8) was put in the equilibrium vessel, and different volumes of herbal extract solution were loaded into vial. In order to collect the precipitates for particle size analysis, a mica sheet (5 × 10 mm, Agar Scientific Ltd.) (9) was set as collector in precipitation vessel. The effective parameters on formation of particles and size distribution were investigated as equilibrating parameters (P1: pressure and t1: time), precipitation parameters (P2: pressure and t2: time), volume of loaded solution (V) and temperature (T).
In the first step, in order to dissolute herbal extract ingredients in SC-CO2, valve 1 was disclosed and CO2 gas was pumped into equilibration chamber. When the pressure was reached to programmed P1, purging was stopped automatically and the valve 1 was closed. At the end of time t1, valve 2 was opened and supercritical solution was introduced to precipitation vessel immediately. To adjust the pressure in P2, valve 3 was opened and flow rate was set at 0.1 mL min−1. Decreasing solvent density due to expansion of supercritical solution leads to reduction of solubility rate and effective precipitation. After time t2, the instrument was depressurized with opening valve 3 and mica sheet was removed and placed in a closed tube. Several micronization runs with different conditions were performed, and every run was repeated twice.
Characterization of collected particles
FESEM (Mira 3-XMU FESEM, Tescan Co, Brno, Czech Republic) was applied to analysis of size distribution of particles and morphology. For this purpose, a sputtering system (Pelco SC-7, Ted Pella Inc., Redding, CA) was used for coating of a gold layer on the surface of particles. ImageJ software was performed for analysis of resulted FESEM images and calculation of the count of particles and diameter.
Film coating operation
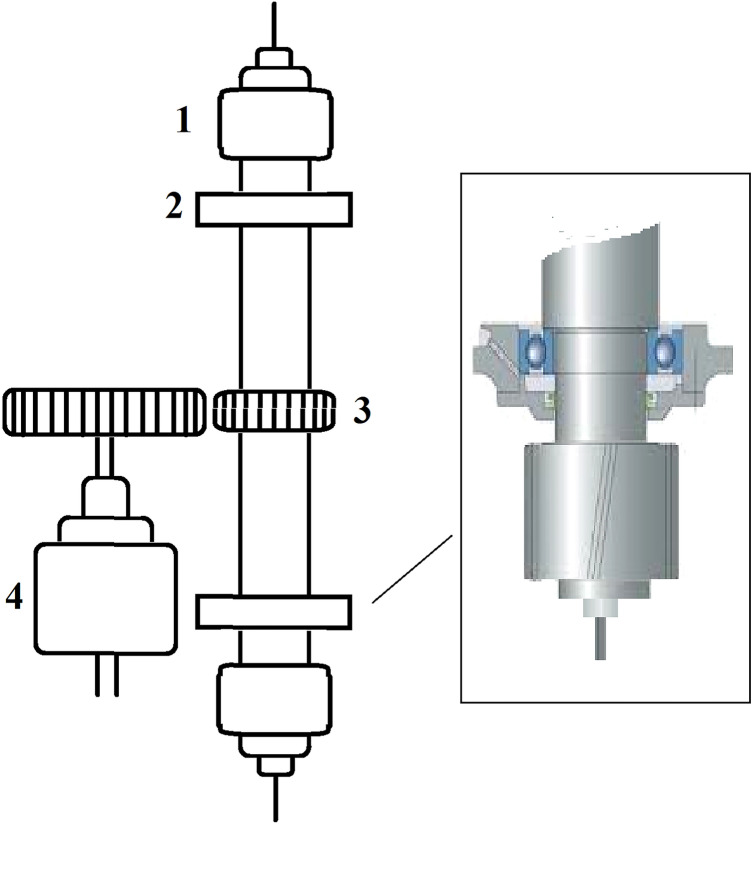
The equipment used in this process was similar to those used in the micronization step. In order to uniformly coat herbal extract particles on sugar spheres, the precipitation vessel was rotated at a specified speed by an electric motor equipped to electrical inverter as shown in Fig. 3. In this step, 1.00 g of sugar spheres was placed into precipitation vessel and micronization process was carried out in optimum conditions as described previously. Characterization of coated nanoparticles was done using FESEM. Qualitative analysis was performed to ensure the presence of flavonoids in coated film by LC–MS. For sample preparation, a few sugar spheres with 10 mL ethanol were placed in a sonication bath for 15 min and resulted solution was passed from a 0.22-µm wheel filter. The weight of coated nanoparticles on 1 g sugar spheres was calculated using the following equation:
where W1 and W2 are the weight of loaded sugar spheres before and after coating, respectively.
Fig. 3.
Schematic diagram of supercritical fluid-coating apparatus: (1) coating vessel, (2) ball bearing, (3) gird and (4) electric rotor
Coating efficiency was calculated as follows:
Solubility analysis
Solubility of extract components in micronized and original (non-micronized) form was evaluated in aqueous media. In this study, coated sugar spheres containing accurately weighed precipitates with different particle size distributions resulting from different micronization experiments were placed separately in the glass flasks containing 10 ml solvents. The samples were sonicated in constant conditions (time: 30 min, temperature: 40 °C and frequency: 40 kHz). Unresolved components were separated using a laboratory centrifuge, and quantification of the dissolved extract was conducted at λmax of hesperidin (283 nm) using an UV spectrophotometer (Perkin Elmer, Wilton, USA). The following equation was applied to compare the solubility of different samples:
where W1 and W2 are the weight of collected particles on the sugar spheres in samples 1 and 2, respectively. In addition, Abs1 and Abs2 denote the UV absorbance of desired solutions.
Antioxidant activity of nanoparticles
Antioxidant activity of extract components in micronized and original (non-micronized) form was evaluated using the previously reported methods [40]. In this method, a decrease in absorbance of the Fe2+–ferrozine complex due to addition of extract sample was considered as a measure of antioxidant properties. Briefly, 1 g of coated sugar spheres containing about 2 mg extract components with different particle size distributions, 2 ml of 0.2 mM FeCl2 and 0.2 ml of 2 mM ferrozine solutions were mixed by a magnetic stirrer for 10 min and then stood for 30 min at room temperature. Deionized water with sugar sphere and ferrozine sodium salt was used as blank solution. FeCl2 and ferrozine were used as control solution. The absorbance of samples was measured at 562 nm, and the chelating activity was calculated as follows:
In order to create calibration curve of Fe2+–ferrozine complex, 0.2–5 ml of the standard iron solution (10 μg/mL) was transferred to five volumetric flasks (25.0 mL) containing 50 mg of the ferrozine sodium salt. Finally, distilled water was added to make up the volume up to 25 ml. The samples were allowed to settle for 2 h, and the optical absorbance of the color complex was measured at 562 nm. The measured absorbance intensities were plotted against the concentration of Fe2+ solution. The line equation and the coefficient of determination for the linear regression were calculated.
Results and discussion
Co-solvent determination
Extraction yields of different solvents were investigated using the described process. Results of ethanol, ethyl acetate and cyclohexane were 10.7, 5.3 and 1.2%, respectively. Based on these results, ethanol was selected as modifier.
Optimization design
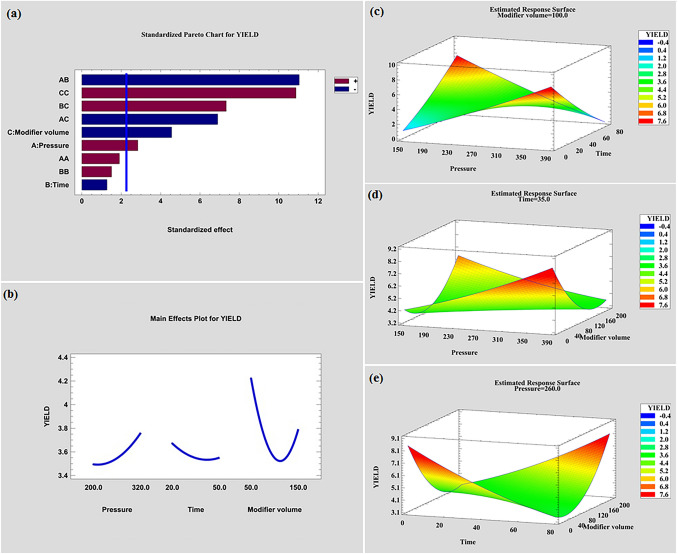
Standardized Pareto chart and main effects plot for yield (Fig. 4a and b, respectively) were applied for visual analyzing results. Based on these figures, co-solvent volume has the greatest effect on the extraction yield and was the most significant variable (corresponding to more negative standardized effect in Pareto chart and more slope in main effects plot). As shown in figures, at modifier volumes greater than 100 μL, the extraction of polar compounds increases due to changes in solvent polarity. The next most important variables were extraction pressure and dynamic time with positive and negative effects on extraction yield, respectively.
Fig. 4.
a Standardized Pareto chart in the central composite design, b main effect plots of pressure, modifier volume and dynamic extraction time, c response surfaces using the central composite design obtained by plotting pressure (atm.) versus dynamic extraction time at 100 μL of modifier volume, b pressure (atm.) versus modifier volume (µl) at 35 min of dynamic extraction time and d dynamic extraction time (min) versus modifier volume (µl) at 260 atm
Optimization of the mentioned parameters at three levels was done using CCD statistical model. The second-order polynomial model was acquired as:
where Y (extraction yield), X1 (pressure), X2 (dynamic time) and X3 (co-solvent volume).
Figure 4c displays the response surface plot of extraction pressure versus co-solvent volume, and dynamic extraction time was kept constant at 35 min. Based on this plot, increasing modifier volume at low pressures caused increasing extraction efficiency. On the other hand, at high pressures of SC-CO2, decreasing modifier increased extraction yield. These results show that polar components were extracted in low pressures and increasing polar modifier increased extraction of these compounds. Also, extraction of nonpolar components was done at high pressures, and reduction of polarity caused an increase in extraction efficiency. Figure 4d represents the plot of extraction pressure and dynamic extraction time while co-solvent volume was 100 µL. This plot shows that in low pressures and hence low density of SC-CO2, an increase in extraction time increased extraction yield and vice versa, at high pressures, extraction efficiency decreased. These results indicate that in long run times, volatile compounds are lost during collection process. Figure 4e is the diagram of extraction time and co-solvent volume in pressure of 260 atm. Based on this plot, in low volumes of modifier, extraction of nonpolar components occurs in short times and increasing collection time leads to loss of volatile components. On the other hand, in greater amounts of ethanol as co-solvent, extraction of more polar compounds increases in long dynamic times. According to the results obtained, the optimal extraction conditions were defined as follows: extraction pressure (368 atm), oven temperature (40 °C), modifier concentration in loaded peel powder (0.95% w/w), static extraction times (10 min) and dynamic extraction time (8 min).
Analysis of supercritical extract
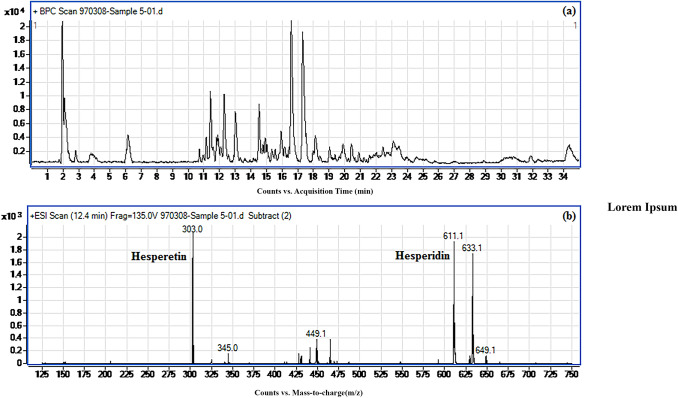
Qualification analysis of flavonoids was carried out using LC–MS and described previously. Chromatogram of extract sample and related spectrogram are shown in Fig. 5. The peak in the m/z ratio of 611.1 (retention time: 12.4 min) can present hesperidin (MW: 610.56 g mol−1), and the peak in the m/z of 303 is related to hesperetin (MW: 302.28 g mol−1).
Fig. 5.
a HPLC chromatogram of extract sample and b mass spectrum of hesperidin and hesperetin
Optimization of micronization process
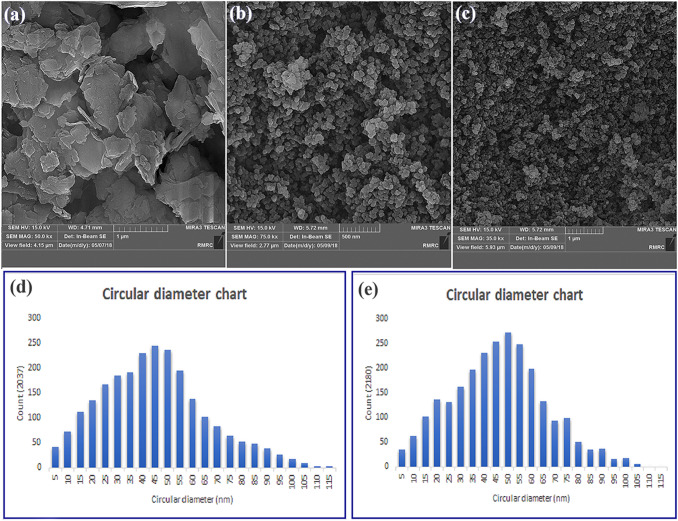
In the presented research, micronization and coating of extract nanoparticles on sugar spheres were done as described in related sections. Effect of main parameters including equilibration pressure and time (p1, t1), precipitation pressure and time (p2, t2), oven temperature (T) and volume of loaded sample (V) on morphology and number of particles were studied. Table 2 shows the various experiments to study effects of different parameters on micronization process. FESEM micrograph and distribution of particle size of collected nanoparticles under variable experimental conditions are shown in Fig. 6. Based on different experiments, the optimal micronization conditions were obtained as follows: volume of loading (30 µL), precipitation temperature (50 °C), equilibrium pressure and time (350 atm and 10 min), precipitation pressure and time (80 atm and 30 min). In the mentioned conditions, nanostructures with particle size of 5–100 nm were collected (Table 1).
Table 2.
Supercritical micronization conditions
| Run | T | V | t1 | t2 | P1 | P2 | Observation | Figure |
|---|---|---|---|---|---|---|---|---|
| 1 | 30 | 50 | 10 | 30 | 350 | 120 | Extra amount remained in the vial | – |
| 2 | 30 | 50 | 30 | 30 | 350 | 120 | Extra amount remained in the vial | – |
| 3 | 50 | 50 | 10 | 30 | 350 | 120 | Extra amount remained in the vial | – |
| 4 | 30 | 30 | 10 | 30 | 350 | 120 | No particles were formed | – |
| 5 | 30 | 30 | 10 | 30 | 350 | 100 | A few particles were formed | - |
| 6 | 30 | 30 | 10 | 60 | 350 | 100 | A few particles were formed | – |
| 7 | 30 | 30 | 10 | 30 | 350 | 80 | Big crystals were formed | 6a |
| 8 | 30 | 30 | 10 | 10 | 350 | 80 | Big crystals were formed | – |
| 9 | 50 | 30 | 10 | 30 | 350 | 80 | Nanoparticles were formed | 6b |
| 10 | 50 | 30 | 10 | 60 | 350 | 80 | No noticeable change | 6c |
Fig. 6.
FESEM images of precipitated extract particles under different conditions. a Crystalline particles produced during experiment 7 (size bar > 500 nm), b nanoparticles produced during experiment 9, c nanoparticles produced during experiment 10, d the particle size distribution diagrams correspond to experiment 9 (size bar < 120 nm, Count: 2037) and e the particle size distribution diagrams correspond to experiment 10 (size bar < 120 nm, count: 2180)
Table 1.
Design matrix and the responses for central composite blocked cube-star design for SFE
| Run | Pressure (bar) | Time (min) | Modifier volume (µL) | Yield % |
|---|---|---|---|---|
| 1 | 200 | 50 | 50 | 4.33 |
| 2 | 320 | 50 | 150 | 3.53 |
| 3 | 260 | 35 | 100 | 3.60 |
| 4 | 200 | 50 | 150 | 5.28 |
| 5 | 260 | 35 | 100 | 3.62 |
| 6 | 320 | 20 | 50 | 6.50 |
| 7 | 200 | 20 | 150 | 3.32 |
| 8 | 320 | 20 | 150 | 3.84 |
| 9 | 200 | 20 | 50 | 3.70 |
| 10 | 320 | 50 | 50 | 3.80 |
| 11 | 260 | 35 | 100 | 3.58 |
| 12 | 260 | 35 | 190 | 4.70 |
| 13 | 260 | 8 | 100 | 3.74 |
| 14 | 368 | 35 | 100 | 3.92 |
| 15 | 260 | 35 | 100 | 3.50 |
| 16 | 151 | 35 | 100 | 3.42 |
| 17 | 260 | 35 | 9 | 5.12 |
| 18 | 260 | 35 | 100 | 3.52 |
| 19 | 260 | 62 | 100 | 3.49 |
| 20 | 260 | 35 | 100 | 3.45 |
The study of equilibration parameters (time, temperature and volume)
Table 2 (run 1) reveals that a large amount of loaded sample remained in the polyethylene vial in equilibration chamber and dissolution in the SC-CO2 phase was not completely. Increasing equilibration time from 10 to 30 min and oven temperature from 30 to 50 ºC did not change the solubility of compounds significantly (Table 2, runs 2 and 3). Given that the oven temperature and equilibration pressure were set to the maximum value specified by the device, the solvent content may not be sufficient for complete dissolution of loaded compound. In the next experiment, volume of loaded sample was decreased to 30 mL (Table 2, run 4) and dissolved completely.
The study of precipitation parameters (time, temperature and pressure)
As shown in Table 2, run 4, no particles were formed during precipitation process and dissolved compound remained as supercritical solution. Reduction of pressure from 120 to 100 atm in run 5 and increasing time from 30 to 60 min caused collection of a few particles. These results can indicate that pressure drop was not adequate. Run 7 well proved this claim and reduction of precipitation pressure from 100 to 80 atm leads to collection of irregular compounds with particle size greater than 500 nm (Fig. 6a). On the other hand, particle accumulation has occurred extensively during this run. To prevent the accumulation and investigate impact of duration of pressure drop on the morphology of particles, precipitation time decreased from 30 to 10 min in run 8. Analysis of resulted particles using FESEM showed that agglomeration of particles has happened immediately and decreasing precipitation time had no considerable effects on morphology. As discussed in the classical nucleation theory, an increase in supersaturation concentration can lead to a decrease in the size of precipitated particles. When the temperature of solution increases, two conditions can occur, solvent density reduction and rising solute vapor pressure. Supersaturation concentration can be affected by these factors and may increase, decrease or remain constant [39]. The effect of precipitation temperature on the morphology of particles was studied by increasing the oven temperature from 30 to 60 ºC (Table 2, run 9). FESEM image and statistical analysis using ImageJ software as shown in Fig. 6b and d showed that an increase in temperature leads to formation of particles with the mean size of 5–120 nm and spherical shape. These results show that rising precipitation temperature leads to increasing supersaturation concentration and nucleation takes precedence over crystal growth.
To enhance the number of the precipitated nanoparticles, precipitation time was enhanced from 30 to 60 min (Table 2, run 10) and collection of particles was performed using the previous experiment conditions which was described. Statistical analysis of FESEM micrograph (Fig. 6c and e) shows that particle size and number of particles did not change significantly and precipitation process was rapid.
Characterization of coated film
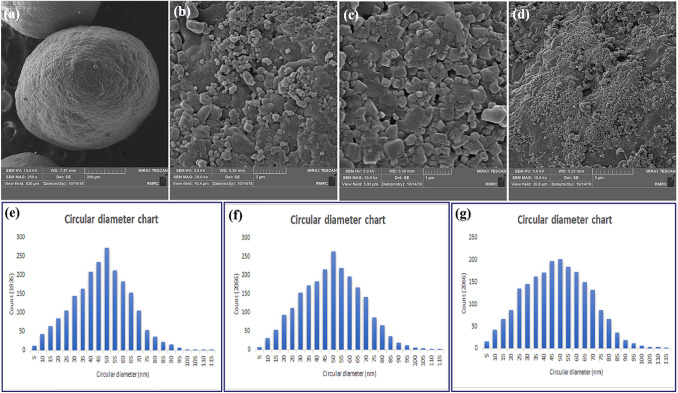
Coating of herbal extract nanoparticles on sugar spheres was done in 50, 100 and 150 rpm as described in the related section. FESEM image of sugar spheres before coating is shown in Fig. 7a, and FESEM images of coated sugar spheres with extract components in different rotational speeds are shown in Fig. 7b to d. Analysis of these images using ImageJ software showed no significant differences between the different experiments (Fig. 7e–g). Therefore, 50 rpm is sufficient to uniform film coating of nanoparticles on the surface of sugar spheres.
Fig. 7.
FESEM images of: a non-coated sugar sphere, b coated nanoparticles in 50 rpm, c coated nanoparticles in 100 rpm and b coated nanoparticles in 200 rpm
Qualification analysis of these spheres using LC–MS (Fig. 8) confirms the presence of the desired pharmaceutical ingredients such as hesperidin and hesperetin. Weight of coated nanoparticles and coating efficiency were described in film coating operation section and were calculated as 1.8 mg and 39.2%, respectively.
Fig. 8.
Spectrogram of coated nanoparticles in the positive ion mode (ESI+)
Solubility study of extract components with different particle size distributions resulting from different micronization conditions (runs 7 and 9 of micronization process) was done as described, and results are shown in Table.3. Experiments reveals that solubility of extract components increased to 55% when particle size distribution reduced from 500–1000 to 5–100 nm during micronization process.
Table 3.
Solubility analysis of coated nanoparticles
| Sample | W (mg) | Particle size distribution (nm) | Abs |
|---|---|---|---|
| 1 | 1.8 | 500–1000 | 0.28 |
| 2 | 1.4 | 5–100 | 0.56 |
The line equation and the coefficient of determination for the linear regression were calculated as y = 0.4957x + 0.0071 (y: absorbance of complex and x: concentration of Fe2+ solution) and r2 = 0.999, respectively. Calculating of ferrous ion-chelating activity of coated sugar spheres in different micronization conditions (run 5 and 6 in micronization process) was done as described in the related section. As compared with the chelating activity of the coated particles, Table 4 reveals that the activity of extract components increased from 12 to 47%. These results illustrated that solubility and hence antioxidant activity of flavonoids in extract samples increased significantly during micronization process.
Table 4.
Ferrous ion-chelating activity
| Sample | W (mg) | Particle size distribution (nm) | Chelating activity (%) |
|---|---|---|---|
| 1 | 1.6 | 500–1000 | 12 |
| 2 | 1.9 | 5–100 | 47 |
Samples 1 and 2 are sugar spheres coated with extract components under conditions described in runs 7 and 9 of micronization process (Table 2)
Conclusion
In summary, extraction of flavonoids from sweet orange peels using supercritical CO2 was described and different parameters were investigated. The optimal operation conditions were obtained as follows: extraction pressure (368 atm), modifier volume (9.5 µL), oven temperature (40 °C) and static and dynamic extraction times (10 and 8 min, respectively).
In order to prepare coated herbal nanoparticles on sugar spheres, micronization and coating process was done simultaneously by a novel technique with controlled expansion of supercritical solution. Finally, spherical nanoparticles with mean size of 5 to 100 nm were coated successfully. Optimal conditions in this process were specified as: volume of loading (30 µL), precipitation temperature (50 °C), equilibration and precipitation pressure (350 and 80 atm), equilibration and precipitation time (10 and 30 min) and rotation speed of coating vessel (50 rpm). In vitro studies illustrated that solubility and antioxidant activity of flavonoids in extract samples increased up to three times during micronization process. The presented method was simple, swift, green and inexpensive technique to micronization and coating of herbal pharmaceutical with low solubility and bioavailability in aqueous media to preparation of controlled release dosage forms.
Abbreviations
- SC-CO2
Supercritical carbon dioxide fluid
- CCD
Central composite design
- HPLC–MS
High-performance liquid chromatography–mass spectrometry
- FESEM
Field emission scanning electron microscopy
References
- 1.Milind P, Dev C. Int. Res. J. Pharm. 2012;3:59. [Google Scholar]
- 2.S. M. S. Sawalha, D. Arráez-Román, A. Segura-Carretero, A. Fernández-Gutiérrez, Food Chem. 116 (2009) 567.
- 3.Manthey JA, Grohmann K. J. Agric. Food Chem. 1996;44:811. doi: 10.1021/jf950572g. [DOI] [PubMed] [Google Scholar]
- 4.P. K. Wilmsen, D. S. Spada, M. Salvador, J. Agric. Food Chem. 53 (2005) 4757. [DOI] [PubMed]
- 5.H. Parhiz, A. Roohbakhsh, F. Soltani, R. Rezaee, M. Iranshahi, Phytother. Res. 29 (2015) 323. [DOI] [PubMed]
- 6.T. Guardia, A. E. Rotelli, A. O. Juarez, L. E. Pelzer, Il Farmaco 56 (2001) 683. [DOI] [PubMed]
- 7.S. P. Stella., A. C. Ferrarezi, K. O. dos Santos, M. Monteiro, J. Food Sci. 76 (2011) C392. [DOI] [PubMed]
- 8.R. Salerno, F. Casale, C. Calandruccio, A. Procopio, PharmaNutrition 4 (2016) S1.
- 9.Azwanida N. Med Aromat. Plants. 2015;4:2167. [Google Scholar]
- 10.M. Bimakr, R. A. Rahman, F. S. Taip, A. Ganjloo, L. M. Salleh, J. Selamat, A. Hamid, I. S. M. Zaidul, Food Bioprod Process 89 (2011) 67.
- 11.M. Herrero, J. A. Mendiola, A. Cifuentes, E. Ibáñez, J. Chromatogr. A 1217 (2010) 2495. [DOI] [PubMed]
- 12.M. Zougagh, M. Valcárcel, A. Ríos, TRAC 23 (2004) 399.
- 13.Lang Q, Wai CM. Talanta. 2001;53:771. doi: 10.1016/S0039-9140(00)00557-9. [DOI] [PubMed] [Google Scholar]
- 14.G. Bittencourt, D. Firmiano, R. Fachini, R. Lacaz‐Ruiz, A. Fernandes, A. Oliveira, J. Food Sci. 84 (2019) 1297. [DOI] [PubMed]
- 15.B. M. Siddique, A. Ahmad, A. F. Alkarkhi, M. H. Ibrahim, M. Omar AK, J. Food Sci. 76 (2011) C535. [DOI] [PubMed]
- 16.M. K. Anwer, R. Al-Shdefat, S. Jamil, P. Alam, M. S. Abdel-Kader, F. Shakeel, J. Chem. Eng 59 (2014) 2065.
- 17.Majumdar S, Srirangam R. Pharm. Res. 2009;26:1217. doi: 10.1007/s11095-008-9729-6. [DOI] [PMC free article] [PubMed] [Google Scholar]
- 18.A. W. Khan, S. Kotta, S. H. Ansari, R. K. Sharma, J. Ali, Drug Dev. Ind. Pharm. 41 (2015) 772. [DOI] [PubMed]
- 19.Kumar R. J. Drug. Deliv. Sci. Tec. 2019;53:101221. doi: 10.1016/j.jddst.2019.101221. [DOI] [Google Scholar]
- 20.S. C. Wu, P. J. Chien, M. H. Lee, C. F. Chau, J. Food Sci. 72 (2007) S618. [DOI] [PubMed]
- 21.Rasenack N, Müller BW. Pharmacol. Biochem. Behav. 2004;9:1. [Google Scholar]
- 22.Q. Wei, C. M. Keck, R. H. Müller, Drug Dev. Ind. Pharm. 44 (2018) 1. [DOI] [PubMed]
- 23.J. Chingunpitak, S. Puttipipatkhachorn, Y. Tozuka, K. Moribe, K. Yamamoto, Drug Dev. Ind. Pharm. 34 (2008) 609. [DOI] [PubMed]
- 24.J. C. Imperiale, G. Bevilacqua, P. d. T. V. e. Rosa, A. Sosnik, Drug Dev. Ind. Pharm. 40 (2014) 1607. [DOI] [PubMed]
- 25.R. A. Sharath, F. Fang, W. J. Trompetter, J. Futter, J. Kennedy, Mater. Today Proc. (2020).
- 26.M. Charoenchaitrakool, F. Dehghani, N. R. Foster, H. K. Chan, Ind. Eng. Chem. Res. 39 (2000) 4794.
- 27.F. Sansone, A. Rossi, P. Del Gaudio, F. De Simone, R. P. Aquino, M. R. Lauro, Aaps PharmSciTech 10 (2009) 391. [DOI] [PMC free article] [PubMed]
- 28.B. Afra, M. Mohammadi, M. Soleimani, R. Mahjub, Drug Dev. Ind. Pharm. (2020) 1. [DOI] [PubMed]
- 29.F. Liu, A. W. Basit, R. Lizio, H.-U. Petereit, C. Meier, M. Damm, Google Patents (2020).
- 30.F. Kanaze, E. Kokkalou, I. Niopas, P. Barmpalexis, E. Georgarakis, D. Bikiaris, Drug Dev. Ind. Pharm. 36 (2010) 292. [DOI] [PubMed]
- 31.R. Manivannan, K. G. Parthiban, G. Sandeep, A. Balasubramaniam, N. Senthilkumar, Drug Invention Today 2 (2010).
- 32.K. Lavanya, V. Senthil, V. Rathi, Int. J. Pharmaceutical Sci. Res. 2 (2011) 1337.
- 33.L.-L. Wang, B. Wang, N. Shang, W.-Z. Liu, South Af. J Bot. 104 (2016) 47.
- 34.Rhodes C, Porter S. Drug Dev. Ind. Pharm. 1998;24:1139. doi: 10.3109/03639049809108573. [DOI] [PubMed] [Google Scholar]
- 35.Bose S, Bogner RH. Pharmacol. Biochem. Behav. 2007;12:115. [Google Scholar]
- 36.C. Thies, I. R. Dos Santos, J. Richard, V. VandeVelde, H. Rolland, J.-P. Benoit, J. Microencapsul 20 (2003) 87. [PubMed]
- 37.Özçelik N, Yurtcan AB. J. Drug. Deliv. Sci. Tec. 2019;53:101213. doi: 10.1016/j.jddst.2019.101213. [DOI] [Google Scholar]
- 38.H. Salehi, M. Karimi, N. Rezaie, F. Raofie, J. Drug. Deliv. Sci. Tec. (2020) 101515.
- 39.Karimi M, Raofie F. J. Supercrit. Fluids. 2019;146:172. doi: 10.1016/j.supflu.2019.01.021. [DOI] [Google Scholar]
- 40.Momenkiaei F, Raofie F. J. Supercrit. Fluids. 2018;138:46. doi: 10.1016/j.supflu.2018.03.011. [DOI] [Google Scholar]
- 41.Momenkiaei F, Raofie F. J. Pharm. Sci. 2019;108:1581. doi: 10.1016/j.xphs.2018.11.010. [DOI] [PubMed] [Google Scholar]
- 42.T. C. Dinis, V. M. Madeira, L. M. Almeida, Arch. Biochem. Biophys. 315 (1994) 161. [DOI] [PubMed]
- 43.M. Molina-Calle, F. Priego-Capote, M. D. Luque de Castro, Talanta 144 (2015) 349. [DOI] [PubMed]


