

Discovery of nanometallic Cu0 with Fe0 in the human brain will fundamentally boost our understanding of neurobiology.
Abstract
The chemistry of copper and iron plays a critical role in normal brain function. A variety of enzymes and proteins containing positively charged Cu+, Cu2+, Fe2+, and Fe3+ control key processes, catalyzing oxidative metabolism and neurotransmitter and neuropeptide production. Here, we report the discovery of elemental (zero–oxidation state) metallic Cu0 accompanying ferromagnetic elemental Fe0 in the human brain. These nanoscale biometal deposits were identified within amyloid plaque cores isolated from Alzheimer’s disease subjects, using synchrotron x-ray spectromicroscopy. The surfaces of nanodeposits of metallic copper and iron are highly reactive, with distinctly different chemical and magnetic properties from their predominant oxide counterparts. The discovery of metals in their elemental form in the brain raises new questions regarding their generation and their role in neurochemistry, neurobiology, and the etiology of neurodegenerative disease.
INTRODUCTION
The transition metals iron and copper are essential for all organisms that undertake oxidative metabolism (1, 2) and, along with zinc, represent the three most abundant trace metals in the human brain (3). The ability of copper and iron to change oxidation state is crucial for their biological functions (1, 4, 5). They act as important components of numerous enzymes that partake in redox reactions (1, 5, 6). While copper and iron are systemically used throughout the human body, with Cu and Fe proteins accounting for ca. 3% of the human proteome (7), the high energy demand of the brain has resulted in both of these elements being extensively used there during multiple physiological processes (5, 6).
Redox-active, catalytic copper and iron can generate toxic effects when they are incorrectly handled in the brain. The activity of available, “labile” copper and iron in Fenton-like redox chemistry results in the production of reactive oxygen species (ROS) such as hydroxyl radicals, capable of inducing oxidative stress and cell death (8–10). The chemically reduced Cu+ and Fe2+ can catalyze these reactions, further driving ROS production (10). Hence, copper and iron homeostasis are tightly regulated in human tissues (5, 6, 11, 12).
Previous investigations into metal neurochemistry have shown that iron oxides exist within human brain tissues (5, 13–15). Notable is the discovery by Kirschvink et al. (14) of single-domain nanocrystals of the chemically reduced, magnetic iron mineral magnetite extracted from postmortem brain tissue. Subsequent studies have revealed in situ evidence for this mineral within tissues (16). Further understanding of metal homeostasis in the brain, and, in particular, the role of specific oxidation states in biomineralization, requires chemically sensitive measurements at nanoscale resolution.
Despite the discovery of nanoparticulate biogenic magnetite in the human brain almost 30 years ago (14), information on iron and copper biomineralization at physiologically relevant spatial scales in the brain remains scarce, with observations being limited to microorganisms, viruses, and plants [reviewed by Huang et al. (17)]. These processes include the formation of elemental metallic (zero–valent/oxidation state) nanoparticles from more oxidized precursors [e.g., (18–21)], which are much more reactive than their oxide counterparts (22). This enhanced reactivity has been exploited in a range of applications, from catalysis to environmental remediation as well as antimicrobial activity (16, 23–25).
Disruptions to brain metal homeostasis have been implicated in the development of multiple neurodegenerative disorders including Alzheimer’s disease (AD) (26–28), the most prevalent form of dementia worldwide, currently afflicting over 25 million people (29–31). More specifically, altered copper and iron homeostasis has been linked to the formation of amyloid plaques (32–36), a hallmark pathological lesion of AD believed to be fundamentally involved in disease pathogenesis (29, 37, 38). Amyloid plaques from the AD brain contain chemically reduced iron oxide phases that are potentially neurotoxic and may contribute to disease progression (15, 39).
Here, we use synchrotron-based scanning transmission x-ray microscopy (STXM; see fig. S1 for microscope schematic) to determine the nanoscale spatial distribution and chemical state of copper and iron within human amyloid plaque cores from two AD subjects. STXM can generate chemically specific images to ca. 20-nm spatial resolution while simultaneously providing detailed x-ray absorption spectra, allowing the precise chemical state of a sample to be assigned as a function of two-dimensional space. This technique requires no staining of the sample with either dyes or contrast agents used in conventional imaging techniques, while careful control of x-ray exposure conditions ensures that the biochemistry of the samples is not disturbed (15, 39, 40). In addition, using circularly polarized x-rays, it is possible to correlate the magnetic properties of regions of interest to their specific chemical speciation via the x-ray magnetic circular dichroism (XMCD) effect. Using these approaches, we found nanoscale deposits of elemental metallic copper (Cu0) and magnetic elemental iron (Fe0) within human brain tissue. To the best of our knowledge, this represents a first discovery of Cu0 within human tissue. This discovery raises intriguing new questions about the production and role of metal nanoparticles in the brain and whether their formation is linked to neuropathological processes.
RESULTS AND DISCUSSION
Amyloid plaque cores were isolated from the gray matter of the frontal and temporal lobes of two (Braak stage VI) AD brains. The full methodology used to obtain, isolate, and identify amyloid plaque structures is in Materials and Methods. Isolated amyloid plaques were embedded in a STXM-compatible resin and sectioned to either 500 or 200 nm thickness for STXM analysis.
STXM analysis of three resin-embedded amyloid plaque cores from the two different AD subjects are shown below. For analysis, we adopted a multimodal x-ray absorption–based approach, designed to exploit the nanoscale chemical sensitivity of STXM. Single-energy x-ray images were used to locate amyloid plaques and establish overall plaque morphology. X-ray metal maps allowed the identification of the metal, its oxidation state, and its distribution within the amyloid plaque. Metal oxidation state difference maps provided a qualitative distribution of differing metal oxidation states, showing (nanoscale) variations in metal chemistry. Magnetically sensitive XMCD maps were used to identify strongly magnetic metal deposits. X-ray absorption spectromicroscopy was then used to determine the precise chemical state of individual metal deposits through the generation of location-dependent x-ray absorption spectra. This included magnetic characterization of metal deposits via XMCD x-ray spectromicroscopy. Full details on the acquisition of x-ray images, metal maps, and absorption spectra are in Materials and Methods and figs. S2 to S4.
Discovery of Cu0 in subjects also displaying evidence of chemically reduced iron
X-ray images, maps, and absorption spectra of an amyloid plaque core from subject X are shown in Fig. 1. The x-ray image in Fig. 1A shows the overall morphology of the plaque. The composite image in Fig. 1B shows the plaque copper and iron content. Copper maps (see also fig. S2) showed this plaque to contain multiple discrete deposits of copper in nanoscale deposits of both Cu2+ (Fig. 1B, green) and Cu+/Cu0 (i.e., Cu+ and/or Cu0; Fig. 1B, red).
Fig. 1. STXM images, metal maps, and iron and copper L2,3-edge x-ray absorption spectra of an amyloid plaque core from subject X.
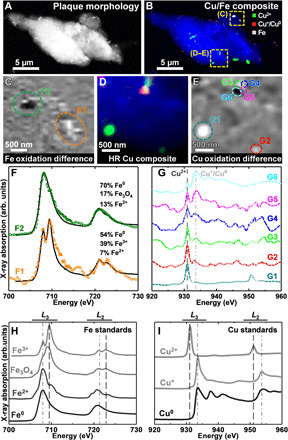
(A) STXM image showing the overall plaque morphology. (B) Composite STXM image showing plaque morphology (blue), Cu2+ (green), Cu+/Cu0 (red), and iron (gray) content. (C) Iron oxidation state difference map of the region highlighted in (B). Strongly absorbing oxidized iron (Fe3+) is shown as light contrast, and chemically reduced iron (Fe2+ and/or Fe0) is shown as dark contrast. (D) High-resolution composite image and (E) copper oxidation state difference map of the region highlighted in (B). In the oxidation state difference map, oxidized copper (Cu2+) is shown as light contrast, and chemically reduced copper (Cu+ and/or Cu0) is shown as dark contrast. (F) Iron x-ray absorption spectra from the regions highlighted in (C). (G) Copper x-ray absorption spectra from the regions highlighted in (E). Energies corresponding to Cu2+ and Cu+/Cu0 content are shown as dashed and dotted-dashed lines, respectively. (H and I) Reference x-ray absorption spectra from iron and copper standards of varying oxidation states. (H) Iron L2,3-edge and (I) copper L2,3-edge. The energies corresponding to the oxidized and reduced states of the metals are shown by the dotted-dashed and dashed lines, respectively. Copper x-ray absorption spectra. Reprinted from Jiang et al. (42) with the permission of AIP Publishing.
Iron mapping showed that the amyloid plaque also contains numerous nanoscale iron deposits (Fig. 1B, gray). High-resolution iron oxidation state difference mapping (Fig. 1C) shows a nanoscale variation in the oxidation state of amyloid plaque iron. The specific oxidation states of the iron deposits were determined from iron L2,3-edge x-ray absorption spectra.
Differing iron phases display markedly different spectral features, as illustrated in the reference spectra in Fig. 1H. Specifically, ferric (Fe3+) materials display principal x-ray absorption features at 709.5 and 723 eV, whereas ferrous (Fe2+) and zero–oxidation state metallic (Fe0) phases display features at 708 and 721 eV (41). Although Fe2+ and Fe0 share absorption features at identical energies, Fe0 can be further distinguished from Fe2+ by its broadened absorption peaks and enhanced L2/L3 peak ratios (41). Iron x-ray absorption spectra (colored circles) and their respective fits (black lines) from the areas highlighted in Fig. 1C are displayed in Fig. 1F. Fitting showed area F1 to be composed of mixed oxidation states of Fe3+, Fe2+, and Fe0, while area F2 was predominantly Fe0.
The chemical state of the plaque copper was examined in more detail by collecting high-resolution Cu2+ and Cu+/Cu0 maps, oxidation state difference maps, and copper L2,3-edge x-ray absorption spectra for the area highlighted in Fig. 1B (yellow square; bottom of image).
The resulting maps (Fig. 1, D and E) show a nanoscale (hundreds of nanometers) variation in copper speciation, with both oxidized (Cu2+) and chemically reduced (Cu+/Cu0) phases present. Copper x-ray absorption spectra from the areas highlighted in Fig. 1E are shown in Fig. 1G. As shown in the reference spectra in Fig. 1I, Cu2+ materials display a sharp high-intensity peak at 931 eV and a further lower-intensity peak at 951 eV (42). In contrast, Cu+ and Cu0 materials display peaks ca. 2.5 eV higher than Cu2+ at 933.5 and 953.5 eV (42). From these known spectral features, it can be seen that area G1 of the plaque contains a pure Cu2+ phase, whereas areas G2 to G6 show both Cu2+ and Cu+/Cu0 features. For areas G2 to G4, the Cu2+ peak is dominant over Cu+/Cu0, whereas in G5 they are approximately equal. In G6, the Cu0 peak becomes the dominant feature.
These results demonstrate the presence of both iron and copper in different chemically reduced states within the same amyloid plaque. The presence of copper in multiple oxidation states within an individual plaque suggests that redox cycling of copper may occur within these structures. A further amyloid plaque core from subject X was also found to contain chemically reduced copper, Cu+, shown in fig. S5.
The findings for subject X are supported by the analysis of an amyloid plaque from a second Alzheimer’s case (subject Y) shown in Fig. 2, where copper (Fig. 2B) and iron (Fig. 2C) were both present. Here, iron permeates the plaque and copper is confined to a single detectable Cu+/Cu0 deposit. The copper x-ray absorption spectrum from this deposit (Fig. 2E; cyan trace) strongly resembles an elemental metallic Cu0 reference film (Fig. 2E; black trace) (42) with additional minor contributions from Cu2+. While the spectra for Cu+ and Cu0 share principal peak positions at 933.5 and 953.5 eV, metallic copper (Cu0) is discernible through the presence of well-defined extended x-ray fine structure (EXAFS) at 938 and 941.8 eV (42, 43). Cu0 is additionally distinguishable from Cu+ by its comparably small absorption-edge steps and high post-edge absorption intensities (see also Fig. 1I) (42). This observation for subject Y is supported by evidence for elemental metallic Cu0 in the EXAFS data from subject X (Fig. 1, area G6).
Fig. 2. STXM images, metal maps, and copper and iron x-ray absorption spectra from a subject Y amyloid plaque.
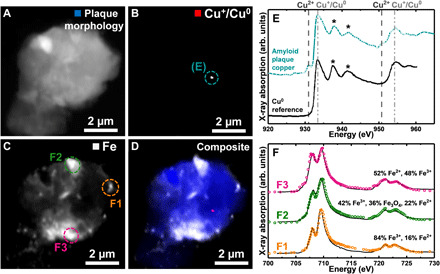
(A) STXM image showing the overall plaque morphology. (B) Cu+/Cu0 map. (C) Iron map. (D) Composite STXM image showing plaque morphology (blue), Cu+/Cu0 (red), and iron (gray) content. (E) Copper x-ray absorption spectrum from the copper area highlighted in (B) (cyan trace) and a Cu0 reference (black trace). Reprinted from Jiang et al. (42) with the permission of AIP Publishing. The energies corresponding to Cu2+ and Cu+/Cu0 content are shown by the dashed and dotted-dashed lines, respectively. Asterisks highlight extended x-ray absorption fine structure (EXAFS) indicative of metallic copper (Cu0). (F) Iron x-ray absorption spectra from the areas highlighted in (C).
Iron x-ray absorption spectra from iron-rich regions throughout the plaque showed spatial variation in the iron oxidation state (Fig. 2F), with iron predominantly present as Fe3+ (F1: Fig. 2, C and F) as well as reduced forms (F2 and F3: Fig. 2, C and F). This was not an isolated finding for this subject: fig. S6 shows an additional plaque from subject Y exhibiting multiple inclusions of reduced iron.
Copper mapping of a further amyloid plaque from subject X (Fig. 3) showed the presence of a single Cu+/Cu0 deposit (Fig. 3B). The copper x-ray absorption spectrum from this deposit (Fig. 3E) displayed small absorption-edge steps and high post-edge absorption intensities representative of Cu0, but without the well-defined EXAFS seen in the metallic Cu0 spectrum shown in Figs. 1I and 2E. This spectrum may therefore represent a mixed Cu0/Cu+ phase or a poorly crystalline Cu0 phase.
Fig. 3. STXM images, metal maps, and copper and iron x-ray absorption spectra from a subject X amyloid plaque core.
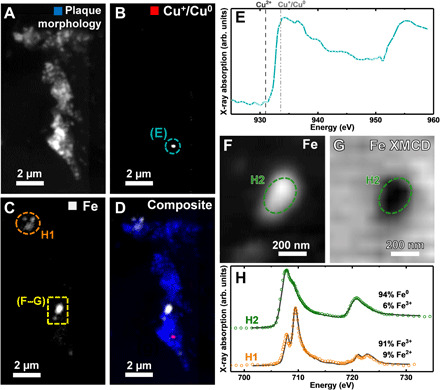
(A) Overall plaque morphology. (B) Cu+/Cu0 map. (C) Iron map. (D) Composite STXM image showing plaque morphology (blue), Cu+/Cu0 (red), and iron (gray) content. (E) Copper x-ray absorption spectrum from the copper deposit highlighted in (B). The energies corresponding to Cu2+ and Cu+/Cu0 content are shown by the dashed and dotted-dashed lines, respectively. (F) High-resolution iron map and (G) iron XMCD map from the region highlighted in yellow in (C). In the XMCD map, areas of bright and dark contrast represent the presence of magnetic iron. (H) Iron x-ray absorption spectra from the iron deposits highlighted in (C), (F), and (G).
Discovery of ferromagnetic elemental iron
Iron mapping of the amyloid plaque in Fig. 3 revealed multiple discrete areas of iron deposition. The strongest iron signal in the iron map(s) (Fig. 3C, high-resolution map in Fig. 3F) correlated with the region of dark contrast in the XMCD map (Fig. 3G), suggesting that this iron inclusion is magnetic. The iron x-ray absorption spectrum (Fig. 3H, green) from this dense iron area (H2) was composed primarily of Fe0 (94%), with only a small (6%) Fe3+ contribution. In contrast, for area H1, the spectrum (Fig. 3H; orange) consisted of contributions from Fe3+ (91%) and Fe2+ (9%).
Elemental iron is one of only three transition metals that display strong ferromagnetism. Therefore, to confirm the presence of elemental metallic Fe0, the fundamental magnetic properties of areas H1 and H2 were probed by performing magnetically sensitive XMCD measurements (see Fig. 4 and Materials and Methods for further experimental details), in addition to usual iron mapping.
Fig. 4. Schematic displaying the experimental setup for the magnetically sensitive XMCD measurements.
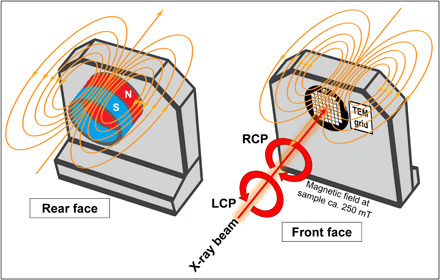
A magnet array was inserted into the rear face of the sample holder (magnetic field lines shown in orange), placing the sample (located on the front face of the holder) under a magnetic field of 250 mT. The incident x-ray beam was tuned to contain either left circularly polarized (LCP) or right circularly polarized (RCP) light. Sample regions were examined under both LCP and RCP light, with differences between these two measurements representing the XMCD effect (see also Materials and Methods).
The corresponding circular polarization–dependent x-ray absorption spectra and accompanying XMCD spectra, along with those from a pure elemental Fe0 film standard, are shown in Fig. 5 (A and B). XMCD measurements of the predominantly ferric region, H1, showed no clear evidence of dichroism (i.e., no difference between the x-ray absorption obtained using the two different x-ray polarizations), suggesting that this region is not strongly magnetic. Conversely, the circular polarization–dependent x-ray absorption and XMCD spectra obtained from region H2 showed strong dichroism (~16%), resulting in a negative XMCD peak at ca. 708 eV and a smaller broad positive peak (<~5%) at ca. 721 eV. The shape and intensity of this magnetic dichroism resemble the spectra of a ferromagnetic metallic Fe0 film standard. Although not identical to the Fe0 reference film, any differences are consistent with the presence of an oxidized nonmagnetic component in the amyloid plaque iron rather than the formation of a magnetic iron oxide mineral phase such as magnetite or maghemite, which would produce a more complex three-peak XMCD spectra typical for these ferrimagnetic biominerals (see fig. S7 and Supplementary Text) (15, 39). The strong intensity of the magnetic dichroism from this amyloid plaque iron also excludes the possibility of Fe-S compounds, which can have x-ray absorption and XMCD spectra similar in shape to metallic iron, but show a much weaker dichroism. For example, the most magnetic Fe-S mineral, pyrrhotite, was found to exhibit only a 2.5% dichroism effect in a 500-mT field (more than twice the field strength used here) at equivalent x-ray energies (44). These observations show that this amyloid plaque iron is elemental metallic rather than a mineral form of iron.
Fig. 5. XMCD measurements of a subject X amyloid plaque core.
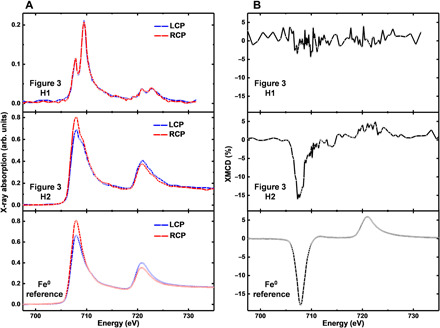
(A) LCP and RCP iron x-ray absorption spectra, and (B) XMCD spectra from the amyloid plaque iron shown in Fig. 3, and a thin Fe0 reference film.
XMCD measurements, performed on resin-embedded air-exposed Fe0 nanoparticle standards, yielded spectra consistent with oxidation products of metallic iron, namely, the ferrimagnetic phases magnetite and maghemite (fig. S7 and Supplementary Text). This observation demonstrates how readily nanoscale Fe0 particles oxidize in air. In turn, this indicates that plaque-bound iron, where it has been chemically reduced to metallic Fe0, is protected by amyloid encapsulation from postmortem auto-oxidation. The apparent absence of severe surface oxidation of nanoparticulate Fe0 within the amyloid plaques characterized here suggests that they are endogenous, rather than exogenous postmortem contamination by particulate matter (PM). If the living brain acquired this iron as airborne PM (45), subsequent surface reduction would be necessary to account for the observed properties of the iron particles.
The results presented here appear to be the first to report elemental metallic Cu0 and Fe0 in human tissue. The observation of these phases, apparently formed within amyloid plaque cores taken from the gray matter of human AD subjects, will stimulate new thinking about the role of metals in human neurobiology and may provide new insights into the etiology of Alzheimer’s and related neurodegenerative diseases.
The nanoscale chemical and magnetic specificities of STXM have allowed us to probe the biochemistry of human brain tissue on subcellular length scales. This enabled the detection of multiple different chemically reduced copper and iron phases within AD amyloid plaques, revealing nanoscale metallic deposits. Many studies have used microfocus x-ray spectroscopy to characterize metal chemistry in human tissues (33, 46). However, although chemically sensitive, the spatial resolution of these techniques leads to spatial averaging only across the micrometer scale, precluding the precise identification of the highly reduced nanoscale metal deposits observed here. The ability to separate spatially different metal phases with nanoscale resolution using STXM techniques provides unique characterization of copper and iron in tissues.
There are several plausible mechanisms for the formation of elemental metallic Cu0 and Fe0 in amyloid deposits. The first is direct reduction of Aβ-bound Cu+/2+ and Fe2+/3+. Given the reportedly high reduction potential of Aβ-Cu composites compared to other biomolecule-Cu complexes, this is feasible (47). Supporting this, we collected in vitro mass spectrometry (MS) data with collision-induced dissociation (CID) (see figs. S8 to S10 and Supplementary Text), which showed that Aβ(1–42) binds Cu2+, in the N-terminal region. Analysis of the isotope distributions of Cu-bound fragments demonstrated that Cu2+ reduction to Cu+ occurs during the CID process. Accompanying a- and c-type peptide fragments, formed from hydrogen-deficient peptide cation radicals (48), were also observed, providing direct evidence that Aβ(1–42) acts as the reducing agent during the conversion of Cu2+ to Cu+. Thus, the reduction of copper by Aβ(1–42) is a potential source of the chemically reduced Cu phases observed in AD amyloid plaque cores as evidenced by STXM.
Natural hydride donors such as NAD(P)H (reduced form of nicotinamide adenine dinucleotide phosphate) and formate may also be capable of reducing copper and iron to metallic forms. Other transition metals (notably, Ru, Os, and Ir) can accept hydride, although no in vitro evidence yet exists for copper and iron. It is notable that enzymes containing iron-sulfur clusters use formate as an electron donor (49–51).
Multiple bacteria, fungi, and plants produce elemental metallic nanoclusters, including Cu0 and Fe0, as a means of resistance to metal toxicity (52–54). The mechanisms for these syntheses are not fully understood, but are thought to proceed through enzymatic reduction, in some cases coupled to the oxidation of glucose (53). There may be analogous reductases in the human brain, including cysteine-rich Zn2+- and Cu+-binding metallothionein-3, a neuroprotective protein with thiolate clusters, capable of reducing Aβ-Cu2+ to Aβ-Cu+ (55).
Because Aβ-Cu2+ is readily reduced to Aβ-Cu+ by multiple biological reductants (56), Cu0 nanoclusters might be formed through the disproportionation of Aβ-bound Cu+ into Cu2+ and Cu0. Cu+ appears to prefer a linear or trigonal binding geometry to Aβ (e.g., involving His13 and His14), in which it could readily bind O2 (57). Under conditions of hypoxia, which are related to neurodegeneration and increased Aβ accumulation (58), aggregates of Aβ-Cu+ unable to bind O2 may instead destabilize and disproportionate to Cu2+ and Cu0.
Under conditions of oxidative stress, oxidative attack on coordinated amino acids such as Cys or His could disrupt the Cu coordination sphere, destabilizing Cu+ toward disproportionation. Such oxidative attack is feasible in the context of the oxidative damage observed in AD brain tissue. Possible oxidants include ROS, such as hydroxyl radicals (produced, for example, by an Aβ-Cu redox cycle) (57) and hypochlorous acid, which has been associated with amyloid burden in AD mouse models (59). This possibility is supported by the observation of oxidized Cu-binding amino acid residues (e.g., His6, His13, His14, and Tyr10) in Aβ-Cu complexes in vitro (also shown in supporting MS data here) and Aβ plaques from the brains of AD patients (57, 60).
A final intriguing possibility is the catechol- and phenol-oxidizing activity of Aβ-Cu2+. There is evidence for a dinuclear Cu2+ center in Aβ-Cu aggregates that is capable of both monooxygenase and oxidase activity, similar to the catechol oxidase and tyrosinase enzymes (61). The proposed inactivation mechanism for tyrosinase occurs when oxy-tyrosinase processes a catechol as a phenol, triggering its monooxygenation to a hydroxyquinone rather than its oxidation to an ortho-quinone. This mechanism results in the reductive elimination of one Cu as Cu0 (62). Over time, in the presence of excess catechol, tyrosinase is gradually deactivated, as the buildup of Cu0 limits the number of catalytically active Cu2+ centers. In the case of Aβ-Cu2+, its oxidation of catecholamines like l-DOPA and dopamine (both present in high concentrations in the brain) could result in a similar inactivation mechanism, producing Cu0 that is then stabilized and protected from subsequent oxidation by the Aβ aggregate. The ability of Aβ to stabilize copper in a Cu0 state would offer an explanation for the recently reported enrichment of isotopically light copper in AD brains compared to disease-free controls (63).
The accumulation of reduced metallic copper and iron observed here within amyloid plaques may induce oxidative stress through the localized overproduction of ROS (9, 10, 64, 65), thereby contributing to the pattern of neuroinflammation and neuronal failure in AD-affected brain areas. The presence of metallic elemental nanoparticles would be expected to further exacerbate these effects due to the increased reactivity of metallic phases compared to their oxide counterparts. Alternatively, the sequestering of redox-active and catalytically active metals by amyloid may represent an antioxidant mechanism by preventing metal-catalyzed oxidation of nearby cellular structures (66). The process of amyloid plaque formation and degradation in human brains, for both healthy individuals and those with AD, remains to be fully elucidated.
Transition metals that can be associated with specific disease pathologies offer potential for disease diagnosis and staging, particularly with the application of advances in iron-sensitive clinical imaging (67). Chemically reduced copper and iron associated with amyloid structures may also represent an innovative target for alternative AD therapies intended to lower the oxidative stress burden in affected brain regions. While it is critical that metal-modifying strategies are not detrimental to essential metabolic processes dependent on these elements, targeting the interaction of amyloid with copper and iron may alter neurotoxicity arising from this interaction, thereby modifying disease progression.
The unexpected identification of Cu0 and Fe0 within AD amyloid plaques suggests that biogenic metallic elements, previously observed only in microorganisms, viruses, and plants, can also occur in humans. The reactivity of these metallic phases differs from their metal oxide counterparts previously detected in the human brain and has the scope to redefine our understanding of metal neurochemistry and the role of metal toxicity in neurodegenerative diseases.
MATERIALS AND METHODS
Preparation of amyloid plaque cores for STXM analysis
Human brain tissue was obtained from two AD subjects at autopsy with the informed written consent of their relatives. The methodology used to obtain, isolate, and identify amyloid plaque structures from the brain tissue was approved by the Bioethics Committee (Department of Pathology, Case Western Reserve University), and this study was performed under U.K. ethical approval 07/MRE08/12 and U.S. IRB 03-00-26. The process of amyloid plaque core preparation for STXM analysis has also been previously described by Everett et al. (15).
The brains from the two confirmed AD subjects (Braak stage VI) were removed at autopsy (5 hours postmortem), divided into half, cut into 1-cm slices, and stored at −70°C. The frozen tissue slices were thawed, and the gray matter from the frontal and temporal lobes was isolated through the removal of the blood vessels, meninges, and white matter. The isolated gray matter was then homogenized by heating to 95°C in the presence of 2% SDS in 50 mM tris buffer. This homogenate was filtered (100-μm pore size) to remove any remaining large tissue debris and pelleted through centrifugation at 800 rpm. AD gray matter was then further homogenized through the addition of 0.1% (w/v) SDS, 150 mM NaCl, and 0.02% NaN3 (w/v) before being filtered (35 μm pore size) and pelleted at 1000 rpm for ca. 30 min. Amyloid plaque cores were isolated from the filtrate through ultracentrifugation at 20,000 rpm in a sucrose gradient [1.8 to 1.2 M sucrose, in a 0.1% (w/v) SDS, 150 mM NaCl, and 0.02% (w/v) NaN3 solution]. The resulting fractions were collected, before being recovered for a final time with 0.1% (w/v) SDS, 150 mM NaCl, and 0.02% (w/v) NaN3, and concentrated via centrifugation at 1200 rpm.
Forty microliters of pelleted amyloid plaque core material was transferred into a centrifugal concentrator (Corning Spin-X UF; 40-kDa cutoff) and spun at 6690 rpm for 10 min. Amyloid plaque cores were dehydrated through an ethanol series (100 μl; 40 to 100% dry), with waste ethanol being removed at each step through centrifugation at 6690 rpm for 10 min. No other chemical fixatives were introduced to prevent metal leeching and preserve mineral composition within the amyloid plaque cores. Following dehydration, amyloid plaque cores were embedded in an STXM-compatible resin composed of an equimolar mixture of trimethylolpropane triglycidyl ether: 4,4′-methylenebis (2-methylcyclohexylamine). This resin has previously been used successfully by our group to examine biological tissues using x-ray spectromicroscopy (15, 39, 68–70). Resin polymerization occurred at 60°C over a period of 24 hours. Semi-thin sections, 500 or 200 nm thickness, of embedded amyloid plaque cores were cut with a Reichert-Jung Ultra-cut microtome, using a nonmetallic (diamond) blade to minimize the risk of metal contamination during the sectioning process. Sections containing embedded amyloid plaque cores were deposited onto transmission electron microscopy (TEM) grids (Agar Scientific; 100 mesh), and these grids were, in turn, mounted onto sample plates for STXM examination.
The presence of amyloid plaque material within the sectioned sample material was confirmed via staining with 1% (w/v) Congo red solution and subsequent examination using cross-polarized optical microscopy as shown in figure 1 of Everett et al. (15). Congo red–stained sections were not used for STXM experiments.
Preparation of metal standards
Copper(II) oxide (CuO) nanopowder (<50 nm particle diameter) and Fe0 nanoparticles (25 to 45 nm diameter; both from Sigma-Aldrich) were embedded in an STXM-compatible resin composed of an equimolar mixture of trimethylolpropane triglycidyl ether, 4,4′-methylenebis (2-methylcyclohexylamine), as used during the embedding of the amyloid plaque cores. Semi-thin sections (100 to 500 nm thickness) of the embedded metal standards were cut with a Reichert-Jung Ultra-cut microtome using a diamond blade and were mounted onto TEM grids (Agar Scientific; 100 mesh) for STXM examination. Both the embedding and sectioning of the metal nanoparticles were performed under ambient conditions. These standards were prepared to assess the effect of the embedding process and to confirm that the STXM measurements did not alter the oxidation state of metals embedded within an organic matrix. An additional ferric (Fe3+) iron standard was also prepared in an organic polymer matrix [as described by Brooks et al. (68)] to further assess the effect on iron oxidation state of successive x-ray beam doses. To avoid cross-contamination of samples, the preparation of metal nanoparticle standards was performed after the preparation and storage of amyloid plaque core materials.
Scanning transmission x-ray microscopy
STXM experiments were performed at the Advanced Light Source (Lawrence Berkeley National Laboratory, CA, USA) beamline 11.0.2 and Diamond Light Source (Oxfordshire, UK) beamline I08. Focused x-ray spot sizes were ≤50 nm at both sources. Single-energy x-ray images taken at the iron L3-edge (706 eV; fig. S6) or copper L3-edge (928 eV; Figs. 1 to 3 and figs. S2 and S5) were used to locate and visualize the overall morphology of the amyloid plaques.
STXM metal maps
To generate maps showing the spatial distribution of metal phases associated with the amyloid plaque cores, paired images were taken: one peak image at the energy corresponding to a feature of interest (e.g., the Cu2+ L3-edge peak; 931 eV) and a further off-peak image a few electron volts below this feature. The off-peak image was then subtracted from the peak image, yielding a metal map. This method of metal mapping, shown in fig. S2, allows artifacts from the embedding resin to be removed, providing a true representation of the metal distribution within the amyloid plaque cores. By finely tuning the energy of the incident x-ray beam, metal distribution maps showing distinct oxidation states were generated by exploiting the preferential absorption of x-rays of differing energies by specific metal phases (e.g., Cu2+ at 931 eV and Cu+/Cu0 at 933.5 eV). Metal maps were created at the iron L3-edge (710 eV) showing iron distribution and two energies at the copper L3-edge (ca. 931 and 933.5 eV) showing Cu2+ and Cu+/Cu0 content, respectively.
Additional iron and copper oxidation state difference maps were created by subtracting images taken at energies corresponding to a chemically reduced state (Fe2+/Fe0 [708 eV], Cu+/Cu0 [933.5 eV]) from the oxidized state (Fe3+ [709.5 eV], Cu2+ [931 eV]). The resulting maps provide a qualitative distribution of the different iron and copper oxidation states within the plaque, with reduced phases showing as dark contrast and oxidized phases showing as light contrast (see also fig. S3).
Metal x-ray absorption spectra
X-ray absorption spectra providing detailed information regarding the oxidation state of metal phases within the amyloid plaque cores were obtained from a series of images (called a “stack”) taken over a desired energy absorption edge (see fig. S4). Raw x-ray absorption intensities were normalized to the incident x-ray beam by conversion to optical density using background regions that did not contain any sample material. Using this approach, specific x-ray absorption spectra can be generated from each pixel of an image, allowing the chemical composition of highly localized (<50 nm in this instance) regions of interest to be determined. Stacks were acquired over the iron L2,3-edge (700 to 740 eV) and copper L2,3-edge (920 to 960 eV). For stack measurements, the dark count (background noise attributable to the beamline) was subtracted before the generation of the x-ray absorption spectra. When examining amyloid plaque material, dwell (exposure) times per pixel were kept as short as possible while ensuring sufficient signal:noise to minimize photon-dose effects, thereby negating any substantial alteration of native sample chemistry (see also the “Optimization of STXM scanning parameters” section and the Supplementary Materials).
Scanning transmission x-ray microscopy–x-ray magnetic circular dichroism
To establish the magnetic state of the iron inclusions identified within the amyloid plaque cores, magnetically sensitive XMCD measurements were performed. These measurements were facilitated by inserting a NdFeB ring magnet array (allowing x-ray transmission) into the rear face of the STXM sample holder and mounting the sample to the front face of the holder (see Fig. 4 for STXM-XMCD sample holder schematic and fig. S1 for STXM beamline schematic). The magnetic field strength at the sample position was measured to be ~250 mT, which we have previously shown is sufficient to induce a significant degree of magnetic polarization in iron mineral (e.g., magnetite) standards, as well as magnetic iron inclusions within amyloid plaque cores (15). X-ray absorption spectra from such magnetized samples were created by performing paired stacks over the iron L2,3-edge using both left and right circularly polarized (RCP) light. The dichroism is revealed as the difference spectrum obtained by subtracting the x-ray absorption spectra obtained using RCP light from the equivalent spectra obtained using left circularly polarized (LCP) light (see, e.g., fig. S7).
To visualize iron deposits showing strong magnetic polarization (i.e., strongly magnetic deposits), XMCD maps were also created. These were obtained by first averaging five images taken close to the Fe2+/Fe0 L3-edge peak energy position for both LCP and RCP measurements. The averaged RCP image was then subtracted from the equivalent LCP image to yield an XMCD difference map, with areas of bright or dark contrast indicating significant dichroism effects (e.g., Fig. 3G).
Optimization of STXM scanning parameters
To best preserve the native chemistry of the amyloid plaque copper and iron upon examination with STXM, control measurements were first performed on ferric (Fe3+) and cupric (Cu2+) metal oxide standards to assess the effect of x-ray beam dose on the oxidation state of these metals.
The purpose of these control measurements was to ascertain STXM scan parameters that generate sufficient signal:noise to determine metal oxidation state while simultaneously limiting x-ray doses to ensure negligible x-ray beam–induced changes to sample chemistry, thereby validating the use of these methodologies for the examination of metal oxidation state. This is typically achieved by tuning the incident beam intensity by, for example, increasing/decreasing exposure (dwell) times or altering the beamline optics such as the exit slits. Because of the inherent variations in synchrotron light source specifications, the x-ray dose tolerance of sample materials, and the scientific questions under investigation, these parameters must be empirically tailored for each individual experiment. The experiments described below demonstrate our method for optimizing the specific STXM scanning parameters used in this study.
To determine the optimal scan parameters for iron L-edge spectromicroscopy, we performed a series of repeat iron L3-edge STXM measurements on a ferric standard within an organic polymer matrix, using differing x-ray doses controlled by altering the beamline exit slit size. We determined an appropriate x-ray dose to be where no changes in the iron L3-edge spectra were observed over successive iron L3-edge measurements. Scans were performed with either 10- or 5-μm exit slit sizes. No perceivable changes to Fe3+ oxidation state were observed in successive measurements using 5-μm exit slits (see fig. S11 and Supplementary Text).
Using these 5-μm exit slits, the stability of amyloid plaque core iron was assessed over four successive iron L2,3-edge measurements, performed as two paired XMCD measurements (as described in the previous section). No changes in amyloid plaque iron L2,3-edge spectra were observed over the four successive measurements, confirming these parameters to be suitable for assessing the chemical and magnetic state of amyloid plaque iron (see fig. S12 and Supplementary Text).
To determine appropriate x-ray exposure (dwell) times for the examination of amyloid plaque copper, successive copper L2,3-edge measurements were performed on embedded CuO standards to assess the effect of extended periods of high-energy beam exposure on the oxidation state of copper(II) (see fig. S13 and Supplementary Text). No perceivable changes to copper(II) oxidation state were observed over the measurements, with spectra representative of a pure Cu2+ material being generated in all instances, thereby validating the use of this methodology for the examination of copper oxidation state. Dwell times of <10 ms/pixel were used at both synchrotron light sources.
STXM data processing
STXM data were processed using the aXis 2000 software package (http://unicorn.mcmaster.ca/aXis2000.html). Grayscale x-ray microscopy images were converted to false color and recombined as overlays to create pseudo-colored composite images. For each measured iron L2,3-edge x-ray absorption spectrum, the relative proportion of different iron phases contributing to the spectrum was estimated by fitting the measured spectra to standards of Fe3+, Fe2+, Fe3O4, and Fe0 using a nonlinear least-squares fitting procedure, as described by Everett et al. (15). A total of 22 amyloid plaque cores were examined. The Fe0 reference spectrum used for fitting, displayed in Figs. 1 and 5, was obtained from Fe0 film standards prepared and measured under vacuum to prevent oxidation (71).
Fourier transform ion cyclotron resonance mass spectrometry
MS experiments were performed on a 12-T solariX quadrupole/Fourier transform ion cyclotron resonance (FTICR) instrument (Bruker Daltonik GmbH, Bremen, Germany) equipped with an infinity cell (72). Ions were introduced using nano-electrospray ionization in positive ion mode and externally accumulated in a hexapole collision cell before being transferred to the ICR cell. For CID experiments, precursor ions were selected in the quadrupole, and a collision voltage of 25 V was applied. Data analysis was performed using Bruker Compass DataAnalysis 4.1, and peaks were assigned manually. For this, at least two isotope peaks were observed to ascertain the ion’s charge state. Assignments were typically made with a mass accuracy better than 1 part per million (see table S1).
Samples were prepared in Milli-Q grade H2O containing 25 mM ammonium acetate (Thermo Fisher Scientific, Loughborough, UK). Aβ(1–42) (monoisotopic mass, 4511.27 Da) was purchased from Bachem (Bubendorf, Switzerland), and CuSO4 was acquired from Sigma-Aldrich (Dorset, UK). The concentration of both the peptide and CuSO4 was 12.5 μM.
Acknowledgments
We thank S. Siedlak (Case Western Reserve University, Cleveland OH, USA) for technical assistance in isolation of the amyloid plaque cores. We thank B. Kaulich, T. Araki, and M. Kazemian for their support at Diamond Light Source beamline I08, and D. Vine for support at the Advanced Light Source beamline 11.0.2. The amyloid plaque cores were isolated from donated tissues obtained with informed consent and were analyzed in accordance with the Declaration of Helsinki under the remit of ethical approval 07/MRE08/12 from the UK National Research Ethics Service. The amyloid plaque cores in this study were analyzed under the remit of a material transfer agreement between the University of Texas at San Antonio and the University of Warwick. The Advanced Light Source is supported by the Director, Office of Science, Office of Basic Energy Sciences, of the U.S. Department of Energy under contract no. DE-AC02-05CH11231. Funding: This work was supported by the following: Engineering and Physical Sciences Research Council grant EP/K035193/1 (J.F.C.), Engineering and Physical Sciences Research Council grant EP/N033191/1 (J.F.C., P.B.O., and P.J.S.), Engineering and Physical Sciences Research Council grant EP/N033140/1 (N.D.T.), Engineering and Physical Sciences Research Council grant EP/P030572/1 (P.J.S.), Engineering and Physical Sciences Research Council grant EP/N509796/1 (J.B.), Engineering and Physical Sciences Research Council grant EP/L015307/1 (K.B.), University of Warwick alumni donations (J.E. and V.T.-T.), Fulbright-Warwick Scholarship (J.M.D.), Kleberg Foundation 2019 Medical Research Grant, Kleberg Foundation 2020 Medical Research Grant, NIH NIA R01AG066749, Alzheimer’s Association grant AARFD-17-529742 (G.P.-V.), The Lowe Foundation, and Semmes Foundation. Author contributions: Conceptualization: J.E., F.L., G.P., P.J.S., P.B.O., J.F.C., and N.D.T. Methodology: J.E., F.L., G.P.-V., G.P., J.F.C., and N.D.T. Investigation: J.E., F.L., J.B., V.T.-T., G.P.-V., I.H.-P., J.M.D., K.B., G.P., J.F.C., and N.D.T. Visualization: J.E., F.L., G.P.-V., G.P., P.J.S., P.B.O., J.F.C., and N.D.T. Supervision: J.F.C. and N.D.T. Writing—original draft: J.E. Writing—review and editing: J.E., F.L., J.B., V.T.-T., G.P.-V., I.H.-P., J.M.D., K.B., G.P., X.Z., P.J.S., P.B.O., J.F.C., and N.D.T. Competing interests: The authors declare that they have no competing interests. Data and materials availability: All data needed to evaluate the conclusions in the paper are present in the paper and/or the Supplementary Materials. The datasets from this study are available through the Keele University research repository at: http://doi.org/10.21252/g99p-0058.
SUPPLEMENTARY MATERIALS
Supplementary material for this article is available at http://advances.sciencemag.org/cgi/content/full/7/24/eabf6707/DC1
REFERENCES AND NOTES
- 1.Tisato F., Marzano C., Porchia M., Pellei M., Santini C., Copper in diseases and treatments, and copper-based anticancer strategies. Med. Res. Rev. 30, 708–749 (2010). [DOI] [PubMed] [Google Scholar]
- 2.Piñero D. J., Connor J. R., Iron in the brain: An important contributor in normal and diseased states. Neuroscientist 6, 435–453 (2000). [Google Scholar]
- 3.Graham S., Nasaruddin M. B., Carey M., Holscher C., McGuinness B., Kehoe P. G., Love S., Passmore P., Elliott C. T., Meharg A. A., Green B. D., Age-associated changes of brain copper, iron, and zinc in Alzheimer’s disease and dementia with Lewy bodies. J. Alzheimers Dis. 42, 1407–1413 (2014). [DOI] [PubMed] [Google Scholar]
- 4.Outten F. W., Theil E. C., Iron-based redox switches in biology. Antioxid. Redox Signal. 11, 1029–1046 (2009). [DOI] [PMC free article] [PubMed] [Google Scholar]
- 5.Connor J. R., Menzies S. L., Burdo J. R., Boyer P. J., Iron and iron management proteins in neurobiology. Pediatr. Neurol. 25, 118–129 (2001). [DOI] [PubMed] [Google Scholar]
- 6.Scheiber I. F., Mercer J. F. B., Dringen R., Metabolism and functions of copper in brain. Prog. Neurobiol. 116, 33–57 (2014). [DOI] [PubMed] [Google Scholar]
- 7.Bertini I., Rosato A., From genes to metalloproteins: A bioinformatic approach. Eur. J. Inorg. Chem. 2007, 2546–2555 (2007). [Google Scholar]
- 8.Bush A. I., The metallobiology of Alzheimer’s disease. Trends Neurosci. 26, 207–214 (2003). [DOI] [PubMed] [Google Scholar]
- 9.Kell D. B., Iron behaving badly: Inappropriate iron chelation as a major contributor to the aetiology of vascular and other progressive inflammatory and degenerative diseases. BMC Med. Genomics 2, 2 (2009). [DOI] [PMC free article] [PubMed] [Google Scholar]
- 10.Prousek J., Fenton chemistry in biology and medicine. Pure Appl. Chem. 79, 2325–2338 (2007). [Google Scholar]
- 11.Ward R. J., Zucca F. A., Duyn J. H., Crichton R. R., Zecca L., The role of iron in brain ageing and neurodegenerative disorders. Lancet Neurol. 13, 1045–1060 (2014). [DOI] [PMC free article] [PubMed] [Google Scholar]
- 12.Smith M. A., Harris P. L. R., Sayre L. M., Perry G., Iron accumulation in Alzheimer disease is a source of redox-generated free radicals. Proc. Natl. Acad. Sci. U.S.A. 94, 9866–9868 (1997). [DOI] [PMC free article] [PubMed] [Google Scholar]
- 13.J. F. Collingwood, N. D. Telling, in Iron Oxides: From Nature to Applications, D. Faivre, Ed. (Wiley-VCH Verlag GmbH & Co. KGaA, 2016). [Google Scholar]
- 14.Kirschvink J. L., Kobayashi-Kirschvink A., Woodford B. J., Magnetite biomineralization in the human brain. Proc. Natl. Acad. Sci. U.S.A. 89, 7683–7687 (1992). [DOI] [PMC free article] [PubMed] [Google Scholar]
- 15.Everett J., Collingwood J. F., Tjendana-Tjhin V., Brooks J., Lermyte F., Plascencia-Villa G., Hands-Portman I., Dobson J., Perry G., Telling N. D., Nanoscale synchrotron x-ray speciation of iron and calcium compounds in amyloid plaque cores from Alzheimer’s disease subjects. Nanoscale 10, 11782–11796 (2018). [DOI] [PMC free article] [PubMed] [Google Scholar]
- 16.Dobson J., Grassi P., Magnetic properties of human hippocampal tissue––Evaluation of artefact and contamination sources. Brain Res. Bull. 39, 255–259 (1996). [DOI] [PubMed] [Google Scholar]
- 17.Huang J., Lin L., Sun D., Chen H., Yang D., Li Q., Bio-inspired synthesis of metal nanomaterials and applications. Chem. Soc. Rev. 44, 6330–6374 (2015). [DOI] [PubMed] [Google Scholar]
- 18.Lin I. W.-S., Lok C.-N., Che C. M., Biosynthesis of silver nanoparticles from silver(i) reduction by the periplasmic nitrate reductase c-type cytochrome subunit NapC in a silver-resistant E. coli. Chem. Sci. 5, 3144 (2014). [Google Scholar]
- 19.Das S. K., Liang J., Schmidt M., Laffir F., Marsili E., Biomineralization mechanism of gold by zygomycete fungi Rhizopous oryzae. ACS Nano 6, 6165–6173 (2012). [DOI] [PubMed] [Google Scholar]
- 20.Ramanathan R., Field M. R., O’Mullane A. P., Smooker P. M., Bhargava S. K., Bansal V., Aqueous phase synthesis of copper nanoparticles: A link between heavy metal resistance and nanoparticle synthesis ability in bacterial systems. Nanoscale 5, 2300–2306 (2013). [DOI] [PubMed] [Google Scholar]
- 21.Aljabali A. A. A., Barclay J. E., Lomonossoff G. P., Evans D. J., Virus templated metallic nanoparticles. Nanoscale 2, 2596–2600 (2010). [DOI] [PubMed] [Google Scholar]
- 22.Adusei-Gyamfi J., Acha V., Carriers for nano zerovalent iron (nZVI): Synthesis, application and efficiency. RSC Adv. 6, 91025–91044 (2016). [Google Scholar]
- 23.Chatterjee A. K., Sarkar R. K., Chattopadhyay A. P., Aich P., Chakraborty R., Basu T., A simple robust method for synthesis of metallic copper nanoparticles of high antibacterial potency against E. coli. Nanotechnology 23, 085103 (2012). [DOI] [PubMed] [Google Scholar]
- 24.Guerra F. D., Attia M. F., Whitehead D. C., Alexis F., Nanotechnology for environmental remediation: Materials and applications. Molecules 23, 1760 (2018). [DOI] [PMC free article] [PubMed] [Google Scholar]
- 25.Zhou Y., Jin C., Li Y., Shen W., Dynamic behavior of metal nanoparticles for catalysis. Nano Today 20, 101–120 (2018). [Google Scholar]
- 26.Giampietro R., Spinelli F., Contino M., Colabufo N. A., The pivotal role of copper in neurodegeneration: A new strategy for the therapy of neurodegenerative disorders. Mol. Pharm. 15, 808–820 (2018). [DOI] [PubMed] [Google Scholar]
- 27.Kozlowski H., Luczkowski M., Remelli M., Valensin D., Copper, zinc and iron in neurodegenerative diseases (Alzheimer’s, Parkinson’s and prion diseases). Coord. Chem. Rev. 256, 2129–2141 (2012). [Google Scholar]
- 28.Zecca L., Youdim M. B. H., Riederer P., Connor J. R., Crichton R. R., Iron, brain ageing and neurodegenerative disorders. Nat. Rev. Neurosci. 5, 863–873 (2004). [DOI] [PubMed] [Google Scholar]
- 29.Ballard C., Gauthier S., Corbett A., Brayne C., Aarsland D., Jones E., Alzheimer’s disease. Lancet 377, 1019–1031 (2011). [DOI] [PubMed] [Google Scholar]
- 30.Castellani R. J., Rolston R. K., Smith M. A., Alzheimer disease. Dis. Mon. 56, 484–546 (2010). [DOI] [PMC free article] [PubMed] [Google Scholar]
- 31.Erkkinen M. G., Kim M.-O., Geschwind M. D., Clinical neurology and epidemiology of the major neurodegenerative diseases. Cold Spring Harb. Perspect. Biol. 10, a033118 (2018). [DOI] [PMC free article] [PubMed] [Google Scholar]
- 32.Lovell M. A., Robertson J. D., Teesdale W. J., Campbell J. L., Markesbery W. R., Copper, iron and zinc in Alzheimer’s disease senile plaques. J. Neurol. Sci. 158, 47–52 (1998). [DOI] [PubMed] [Google Scholar]
- 33.Collingwood J. F., Chong R. K. K., Kasama T., Cervera-Gontard L., Dunin-Borkowski R. E., Perry G., Pósfai M., Siedlak S. L., Simpson E. T., Smith M. A., Dobson J., Three-dimensional tomographic imaging and characterization of iron compounds within Alzheimer’s plaque core material. J. Alzheimers Dis. 14, 235–245 (2008). [DOI] [PubMed] [Google Scholar]
- 34.Moynier F., Creech J., Dallas J., Le Borgne M., Serum and brain natural copper stable isotopes in a mouse model of Alzheimer’s disease. Sci. Rep. 9, 11894 (2019). [DOI] [PMC free article] [PubMed] [Google Scholar]
- 35.Acevedo K., Masaldan S., Opazo C. M., Bush A. I., Redox active metals in neurodegenerative diseases. J. Biol. Inorg. Chem. 24, 1141–1157 (2019). [DOI] [PubMed] [Google Scholar]
- 36.Dong J., Atwood C. S., Anderson V. E., Siedlak S. L., Smith M. A., Perry G., Carey P. R., Metal binding and oxidation of amyloid-β within isolated senile plaque cores: Raman microscopic evidence. Biochemistry 42, 2768–2773 (2003). [DOI] [PubMed] [Google Scholar]
- 37.Fiala J. C., Mechanisms of amyloid plaque pathogenesis. Acta Neuropathol. 114, 551–571 (2007). [DOI] [PubMed] [Google Scholar]
- 38.Goedert M., Sisodia S. S., Price D. L., Neurofibrillary tangles and β-amyloid deposits in Alzheimer’s disease. Curr. Opin. Neurobiol. 1, 441–447 (1991). [DOI] [PubMed] [Google Scholar]
- 39.Telling N. D., Everett J., Collingwood J. F., Dobson J., van der Laan G., Gallagher J. J., Wang J., Hitchcock A. P., Iron biochemistry is correlated with amyloid plaque morphology in an established mouse model of Alzheimer’s disease. Cell Chem. Biol. 24, 1205–1215.e3 (2017). [DOI] [PubMed] [Google Scholar]
- 40.Lermyte F., Everett J., Brooks J., Bellingeri F., Billimoria K., Sadler P. J., O’Connor P. B., Telling N. D., Collingwood J. F., Emerging approaches to investigate the influence of transition metals in the proteinopathies. Cells 8, 1231 (2019). [DOI] [PMC free article] [PubMed] [Google Scholar]
- 41.Regan T. J., Ohldag H., Stamm C., Nolting F., Lüning J., Stöhr J., White R. L., Chemical effects at metal/oxide interfaces studied by x-ray-absorption spectroscopy. Phys. Rev. B. 64, 214422 (2001). [Google Scholar]
- 42.Jiang P., Prendergast D., Borondics F., Porsgaard S., Giovanetti L., Pach E., Newberg J., Bluhm H., Besenbacher F., Salmeron M., Experimental and theoretical investigation of the electronic structure of Cu2O and CuO thin films on Cu(110) using x-ray photoelectron and absorption spectroscopy. J. Chem. Phys. 138, 024704 (2013). [DOI] [PubMed] [Google Scholar]
- 43.Grioni M., van Acker J. F., Czyžyk M. T., Fuggle J. C., Unoccupied electronic structure and core-hole effects in the x-ray-absorption spectra of Cu2O. Phys. Rev. B 45, 3309–3318 (1992). [DOI] [PubMed] [Google Scholar]
- 44.Pearce C. I., Pattrick R. A. D., Vaughan D. J., Electrical and magnetic properties of sulfides. Rev. Mineral. Geochem. 61, 127–180 (2006). [Google Scholar]
- 45.Maher B. A., Ahmed I. A. M., Karloukovski V., MacLaren D. A., Foulds P. G., Allsop D., Mann D. M. A., Torres-Jardón R., Calderon-Garciduenas L., Magnetite pollution nanoparticles in the human brain. Proc. Natl. Acad. Sci. U.S.A. 113, 10797–10801 (2016). [DOI] [PMC free article] [PubMed] [Google Scholar]
- 46.Collingwood J. F., Davidson M. R., The role of iron in neurodegenerative disorders: Insights and opportunities with synchrotron light. Front. Pharmacol. 5, 191 (2014). [DOI] [PMC free article] [PubMed] [Google Scholar]
- 47.Guilloreau L., Combalbert S., Sourina-Saquet A., Mazarguil H., Faller P., Redox chemistry of copper–amyloid-β: The generation of hydroxyl radical in the presence of ascorbate is linked to redox-potentials and aggregation state. Chembiochem 8, 1317–1325 (2007). [DOI] [PubMed] [Google Scholar]
- 48.Tureček F., Julian R. R., Peptide radicals and cation radicals in the gas phase. Chem. Rev. 113, 6691–6733 (2013). [DOI] [PubMed] [Google Scholar]
- 49.Soldevila-Barreda J. J., Romero-Canelón I., Habtemariam A., Sadler P. J., Transfer hydrogenation catalysis in cells as a new approach to anticancer drug design. Nat. Commun. 6, 6582 (2015). [DOI] [PMC free article] [PubMed] [Google Scholar]
- 50.P. A. Frey, Radical reactions featuring lysine 2,3-aminomutase, in Comprehensive Natural Products Chemistry, S. D. Barton, K. Nakanishi, O. Meth-Cohn, Eds. (Pergamon, 1999), vol. 5, pp. 205–223. [Google Scholar]
- 51.Betanzos-Lara S., Liu Z., Habtemariam A., Pizarro A. M., Qamar B., Sadler P. J., Organometallic ruthenium and iridium transfer-hydrogenation catalysts using coenzyme NADH as a cofactor. Angew. Chem. Int. Ed. 51, 3897–3900 (2012). [DOI] [PubMed] [Google Scholar]
- 52.Roh Y., Lauf R. J., McMillan A. D., Zhang C., Rawn C. J., Bai J., Phelps T. J., Microbial synthesis and the characterization of metal-substituted magnetites. Solid State Commun. 118, 529–534 (2001). [Google Scholar]
- 53.Jang G. G., Jacobs C. B., Gresback R. G., Ivanov I. N., Meyer H. M. III, Kidder M., Joshi P. C., Jellison G. E. Jr., Phelps T. J., Graham D. E., Moon J.-W., Size tunable elemental copper nanoparticles: Extracellular synthesis by thermoanaerobic bacteria and capping molecules. J. Mater. Chem. C. 3, 644–650 (2015). [Google Scholar]
- 54.Pantiodos N., Horsfall L. E., Biological synthesis of metallic nanoparticles by bacteria, fungi and plants. J. Nanomed. Nanotechnol. 5, 233 (2014). [Google Scholar]
- 55.Vašák M., Meloni G., Mammalian metallothionein-3: New functional and structural insights. Int. J. Mol. Sci. 18, 1117 (2017). [DOI] [PMC free article] [PubMed] [Google Scholar]
- 56.Opazo C., Huang X., Cherny R. A., Moir R. D., Roher A. E., White A. R., Cappai R., Masters C. L., Tanzi R. E., Inestrosa N. C., Bush A. I., Metalloenzyme-like activity of Alzheimer’s disease β-amyloid: Cu-dependent catalytic conversion of dopamine, cholesterol, and biological reducing agents to neurotoxic H2O2. J. Biol. Chem. 277, 40302–40308 (2002). [DOI] [PubMed] [Google Scholar]
- 57.Atrián-Blasco E., Gonzalez P., Santoro A., Alies B., Faller P., Hureau C., Cu and Zn coordination to amyloid peptides: From fascinating chemistry to debated pathological relevance. Coord. Chem. Rev. 371, 38–55 (2018). [DOI] [PMC free article] [PubMed] [Google Scholar]
- 58.Lall R., Mohammed R., Ojha U., What are the links between hypoxia and Alzheimer’s disease? Neuropsychiatr. Dis. Treat. 15, 1343–1354 (2019). [DOI] [PMC free article] [PubMed] [Google Scholar]
- 59.Samanta S., Govindaraju T., Unambiguous detection of elevated levels of hypochlorous acid in double transgenic AD mouse brain. ACS Chem. Nerosci. 10, 4847–4853 (2019). [DOI] [PubMed] [Google Scholar]
- 60.Gu M., Bode D. C., Viles J. H., Copper redox cycling inhibits Aβ fibre formation and promotes fibre fragmentation, while generating a dityrosine Aβ dimer. Sci. Rep. 8, 16190 (2018). [DOI] [PMC free article] [PubMed] [Google Scholar]
- 61.da Silva G. F. Z., Ming L.-J., Alzheimer’s disease related copper(II)-β-amyloid peptide exhibits phenol monooxygenase and catechol oxidase activities. Angew. Chem. Int. Ed. 44, 5501–5504 (2005). [DOI] [PubMed] [Google Scholar]
- 62.Ramsden C. A., Riley P. A., Tyrosinase: The four oxidation states of the active site and their relevance to enzymatic activation, oxidation and inactivation. Bioor. Med. Chem. 22, 2388–2395 (2014). [DOI] [PubMed] [Google Scholar]
- 63.Moynier F., Le Borgne M., Lahoud E., Mahan B., Mouton-Ligier F., Hugon J., Paquet C., Copper and zinc isotopic excursions in the human brain affected by Alzheimer’s disease. Alzheimers Dement. 12, e12112 (2020). [DOI] [PMC free article] [PubMed] [Google Scholar]
- 64.Huang X., Atwood C. S., Hartshorn M. A., Multhaup G., Goldstein L. E., Scarpa R. C., Cuajungco M. P., Gray D. N., Lim J., Moir R. D., Tanzi R. E., Bush A. I., The Aβ peptide of Alzheimer’s disease directly produces hydrogen peroxide through metal ion reduction. Biochemistry 38, 7609–7616 (1999). [DOI] [PubMed] [Google Scholar]
- 65.Smith M. A., Rottkamp C. A., Nunomura A., Raina A. K., Perry G., Oxidative stress in Alzheimer’s disease. Biochim. Biophys. Acta 1502, 139–144 (2000). [DOI] [PubMed] [Google Scholar]
- 66.Carrillo-Mora P., Luna R., Colin-Barenque L., Amyloid beta: Multiple mechanisms of toxicity and only some protective effects? Oxid. Med. Cell. Longev. 2014, 795375 (2014). [DOI] [PMC free article] [PubMed] [Google Scholar]
- 67.Damulina A., Pirpamer L., Soellradi M., Sackl M., Tinauer C., Hofer E., Enzinger C., Gesierich B., Duering M., Ropele S., Schmidt R., Langkammer C., Cross-sectional and longitudinal assessment of brain iron level in Alzheimer disease using 3-T MRI. Radiology 296, 619–626 (2020). [DOI] [PubMed] [Google Scholar]
- 68.Brooks J., Everett J., Lermyte F., Tjendana Tjhin V., Banerjee S., O’Connor P. B., Morris C. M., Sadler P. J., Telling N. D., Collingwood J. F., Label-free nanoimaging of neuromelanin in the brain by soft x-ray spectromicroscopy. Angew. Chem. Int. Ed. 59, 11984–11991 (2020). [DOI] [PMC free article] [PubMed] [Google Scholar]
- 69.Brooks J., Everett J., Lermyte F., Tjendana Tjhin V., Sadler P. J., Telling N. D., Collingwood J. F., Analysis of neuronal iron deposits in Parkinson’s disease brain tissue by synchrotron x-ray spectromicroscopy. J. Trace Elem. Med. Biol. 62, 126555 (2020). [DOI] [PubMed] [Google Scholar]
- 70.Everett J., Tjendana Tjhin V., Brooks J., Lermyte F., Hands-Portman I., Dobson J., Collingwood J., Telling N., Nanoscale examination of biological tissues using x-ray spectromicroscopy. Microsc. Microanal. 24, 490–491 (2018). [Google Scholar]
- 71.Telling N. D., van der Laan G., Georgieva M. T., Farley N. R. S., Facility for combined in situ magnetron sputtering and soft x-ray magnetic circular dichroism. Rev. Sci. Instrum. 77, 073903 (2006). [Google Scholar]
- 72.Caravatti P., Allemann M., The ‘infinity cell’: A new trapped-ion cell with radiofrequency covered trapping electrodes for fourier transform ion cyclotron resonance mass spectrometry. Org. Mass Spectrom. 26, 514–518 (1991). [Google Scholar]
- 73.Le M., Ren M., Zhang Z., Sprunger P. T., Kurtz R. L., Flake J. C., Electrochemical reduction of CO2 to CH3OH at copper oxide surfaces. J. Electrochem. Soc. 158, E45–E49 (2011). [Google Scholar]
- 74.Hävecker M., Knop-Gericke A., Schedel-Niedrig T., Schlögl R., High-pressure soft x-ray absorption spectroscopy: A contribution to overcoming the “pressure gap” in the study of heterogeneous catalytic processes. Angew. Chem. Int. Ed. 37, 1939–1942 (1998). [Google Scholar]
- 75.Lermyte F., Everett J., Lam Y. P. Y., Wootton C. A., Brooks J., Barrow M. P., Telling N. D., Sadler P. J., O’Connor P. B., Collingwood J. F., Metal ion binding to the amyloid β monomer studied by native top-down FTICR mass spectrometry. J. Am. Soc. Mass Spectrom. 30, 2123–2134 (2019). [DOI] [PMC free article] [PubMed] [Google Scholar]
- 76.Lermyte F., Valkenborg D., Loo J. A., Sobott F., Radical solutions: Principles and application of electron-based dissociation in mass spectrometry-based analysis of protein structure. Mass Spectrom. Rev. 37, 750–771 (2018). [DOI] [PMC free article] [PubMed] [Google Scholar]
- 77.Barlow C. K., McFadyen W. D., O’Hair R. A., Formation of cationic peptide radicals by gas-phase redox reactions with trivalent chromium, manganese, iron, and cobalt complexes. J. Am. Chem. Soc. 127, 6109–6115 (2005). [DOI] [PubMed] [Google Scholar]
- 78.Syme C. D., Nadal R. C., Rigby S. E., Viles J. H., Copper binding to the amyloid-beta (Abeta) peptide associated with Alzheimer’s disease: Folding, coordination geometry, pH dependence, stoichiometry, and affinity of Abeta-(1-28): Insights from a range of complementary spectroscopic techniques. J. Biol. Chem. 279, 18169–18177 (2004). [DOI] [PubMed] [Google Scholar]
- 79.Hureau C., Coordination of redox active metal ions to the amyloid precursor protein and to amyloid-β peptides involved in Alzheimer disease. Part 1: An overview. Coord. Chem. Rev. 256, 2164–2174 (2012). [Google Scholar]
Associated Data
This section collects any data citations, data availability statements, or supplementary materials included in this article.
Supplementary Materials
Supplementary material for this article is available at http://advances.sciencemag.org/cgi/content/full/7/24/eabf6707/DC1