Abstract
We present a new size-modified Poisson–Boltzmann ion channel (SMPBIC) model and use it to calculate the electrostatic potential, ionic concentrations, and electrostatic solvation free energy for a voltage-dependent anion channel (VDAC) on a biological membrane in a solution mixture of multiple ionic species. In particular, the new SMPBIC model adopts a membrane surface charge density and a natural Neumann boundary condition to reflect the charge effect of the membrane on the electrostatics of VDAC. To avoid the singularity difficulties caused by the atomic charges of VDAC, the new SMPBIC model is split into three submodels such that the solution of one of the submodels is obtained analytically and contains all the singularity points of the SMPBIC model. The other two submodels are then solved numerically much more efficiently than the original SMPBIC model. As an application of this SMPBIC submodel partitioning scheme, we derive a new formula for computing the electrostatic solvation free energy. Numerical results for a human VDAC isoform 1 (hVDAC1) in three different salt solutions, each with up to five different ionic species, confirm the significant effects of membrane surface charges on both the electrostatics and ionic concentrations. The results also show that the new SMPBIC model can describe well the anion selectivity property of hVDAC1, and that the new electrostatic solvation free energy formula can significantly improve the accuracy of the currently used formula.
Keywords: size-modified, Poisson–Boltzmann equation, ion channel modeling, VDAC electrostatics , solvation free energy, finite element method
Introduction
Voltage-dependent anion channel (VDAC) is the most abundant protein on the outer mitochondrial membrane (OMM) and is the main conduit that connects the cytosol to the narrow intermembrane space of mitochondria. It regulates the simultaneous transport of respiratory substrates (e.g., pyruvate, malate, and glutamate), adenine nucleotides and phosphates (e.g., ATP, ADP, Pi), and anions and cations (e.g., Cl−, Na+, K+) into and out of mitochondria.[1–4] By providing substrates, nucleotides, and phosphates necessary for electron transfer along the electron transport chain complexes and proton pumping across the inner mitochondrial membrane. VDAC plays an important role in regulating mitochondrial bioenergetics and ATP synthesis. The rate of transport of a particular species depends on its size and charge as well as on the OMM potential and biophysical characteristics of VDAC (permeability, opening, and gating; conductance) that largely depend on its exquisite structure.[5,6] Attenuation of VDAC conductance due to alterations in VDAC structure under pathophysiological conditions can lead to reduction in substrate supply and ADP/ATP exchange across the inner mitochondrial membrane during oxidative phosphorylation and ATP synthesis, leading to mitochondrial dysfunction and cellular injury/death. Thus, as a major regulatory gateway for ions and metabolites (organic anions) to go into and out of mitochondria, VDAC plays a crucial role in regulating an intimate dichotomy between cell survival and cell death, characterizing health and diseases.[7–16] An important first step toward understanding how alteration in VDAC function impacts mitochondrial function is to characterize the structure-dependent transport characteristics of VDAC across OMM in a solution of multiple ionic species of different ion sizes.
The Poisson–Boltzmann equation (PBE) is one of the widely used dielectric continuum models for computing the electrostatics of a biomolecule surrounded by a salt solution due to the popularity of several PBE software packages, such as DelPhi,[17] UHBD,[18] APBS,[19,20] PBSA,[21,22] and PBEQ[23] as well as the recent software packages MIBPB[24] and SDPBS.[25,26] However, for such approach to work for modeling of ion channels on a biological membrane, such as VDAC on OMM, the PBE and its software packages need to be significantly modified to address the additional modeling and numerical solver challenges due to the geometric complexity of a transmembrane channel protein and solvent that is a mixture of many ionic species. Furthermore, a PBE ion channel model requires new interface conditions between the membrane and the solvent regions, new permittivity constants within the channel pore and membrane region, and new boundary value conditions for the boundary parts involving the membrane. Since a biological membrane consists of many lipid and cholesterol molecules, itssurface charge density can be up to 30 (μC/cm2),[27,28] which can have significant effects on the flow of ions and metabolites into and out of the ion channel pore.[28–31] Hence, charges from a biological membrane should be accounted for in the modeling of an ion channel, such as VDAC.
Significant efforts have been devoted toward the development of PBE-based ion channel models.[31–36] For such models, the complexity of an ion channel was reduced by imposing different assumptions. One typical technique that was used to deal with the complexity of a charged membrane was to introduce a membrane potential and treat it as an additional charge source for PBE.[29,31] In doing so, the membrane was simply treated as a water barrier between the inner and outer solution spaces without any charge. The Dirichlet boundary value conditions from the PBE for a protein surrounded by salt solution were retained in current PBE-based ion channel models, thus ignoring any influence of the membrane. Numerically speaking, the governing equations for the current PBE-based ion channel models were solved directly without using any solution decomposition reformulation, as was done in Reference [25] to deal with the singularity difficulties caused by the atomic charges of an ion channel molecule. To the best of our knowledge, there are no ion size-modified PBE-based ion channel models in the literature that work for a solution of multiple ionic species, even though ion size effects have been known to be important, especially for the calculation of ionic concentrations.[26,35,37–41]
In this article, we present a new size-modified Poisson–Boltzmann ion channel (SMPBIC) model and use it to calculate the electrostatic potential, ionic concentrations, and electrostatic solvation free energy for a VDAC protein on a biological membrane in a solution mixture of multiple ionic species. One significant difference between our new SMPBIC model and current ion channel models is the fact that our model not only accounts for ionic size effects but also adopts a membrane surface charge density and a natural Neumann boundary condition. Thus, our new SMPBIC model can reflect both the ionic size effect and the membrane charge effect on the electrostatics of VDAC. Moreover, our SMPBIC model can be solved numerically by a fast finite element algorithm based on a submodel partitioning scheme, and can work for a VDAC three-dimensional (3D) molecular structure or any other ion channel structure in a solution mixture of multiple ionic species.
As an application of our SMPBIC model, we carried out numerical simulations using a 3D human VDAC isoform 1 (hVDAC1) structure from the Protein Data Bank (PDB) website (PDB ID 2JK4)[42] in three different ionic solvents, each with up to five different ionic species. Note that this hVDAC1 protein (PBD ID 2JK4) is known to be in the open state conformation (i.e., maximal conducting state with zero voltage across the OMM, which is the most physiologically plausible condition for VDAC on OMM) with an anion selectivity property. Hence, it can serve as a good test case for assessing the accuracy and efficiency of our SMPBIC model and the associated software package. Numerical results show that the hVDAC1 anion selectivity property can be well predicted by our SMPBIC model. They also demonstrate the significant impact of membrane surface charges on the electrostatic potential and ionic concentrations.
Materials and Methods
Mathematical Modeling of Ion Channels
In this section, we describe the construction of our SMPBIC model based on a box domain, Ω, as defined by
| (1) |
As illustrated in Figure 1a, we partition this box domain and its boundary ∂Ω as follows:
| (2) |
where Lx1, Lx2, Ly1, Ly2, Lz1, and Lz2 are real numbers, representing the dimensions of the three-dimensional (3D) box domain, with the origin of the rectangular coordinate system located at the center of the channel pore; Dp, Dm, and Ds denote the protein region, which hosts the VDAC molecule, the membrane region, and the solvent region, respectively; Γm denotes the interface between Dm and Ds; Γp denotes the interface between Dp and Ds; Γpm denotes the interface between Dp and Dm; ΓD denotes the bottom and top surfaces of the box; and ΓN denotes the four side surfaces of the box. Furthermore, the location of the membrane is indicated by the two numbers Z1 and Z2 on the z-axis, and the membrane normal is assumed to coincide with the z-axis direction of the 3D rectangular coordinate system of the whole space . In addition, the three regions Dp, Dm, and Ds are treated as the dielectric continuum media with permittivity constants ϵp, ϵm, and ϵs, respectively.
Figure 1.
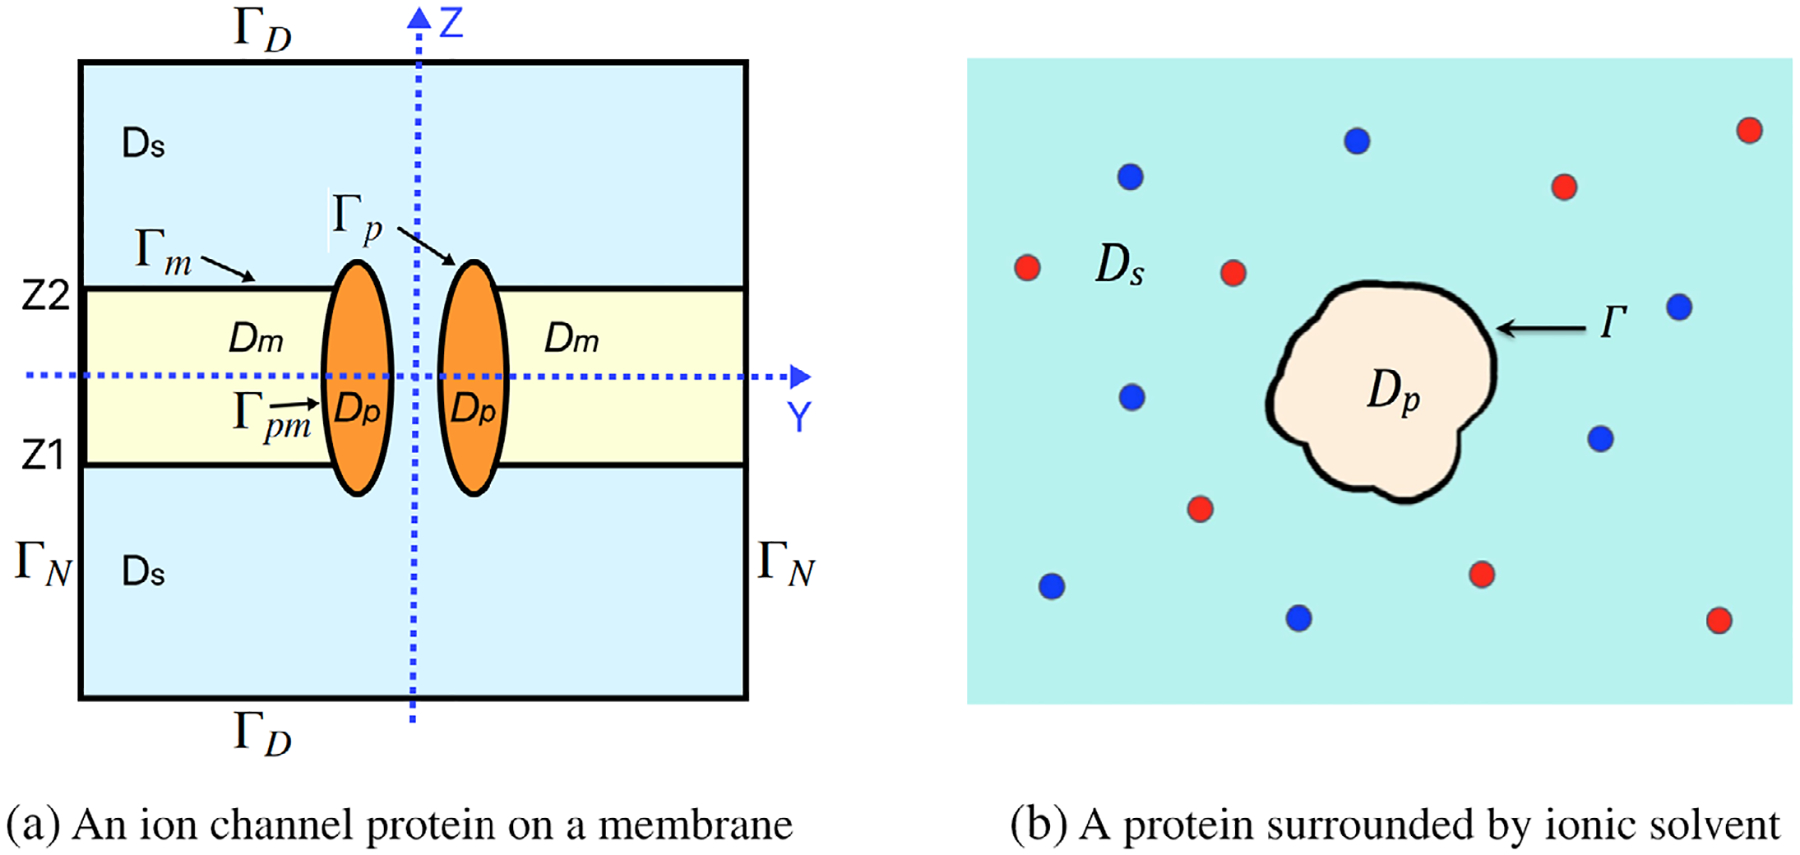
An illustration of a box domain partition: a) an ion channel protein on a membrane in an ionic solvent for the domain partition (2). b) A protein surrounded by an ionic solvent. Here, Γ denotes the interface between the protein region Dp and solvent region Ds.
In the currently used size-modified Poisson–Boltzmann equation (SMPBE),[41,43] the protein region Dp is surrounded by the solvent region Ds, as illustrated in Figure 1b, and there is no membrane region involved. In addition, an electrostatic potential function, u, of the electric field induced by the atomic charges of the protein and the ionic charges of the ionic solvent is governed by a Poisson equation in Dp,
| (3) |
and a Poisson–Boltzmann equation in Ds,
| (4) |
together with the following interface and boundary value conditions:
| (5) |
where np is the unit outward normal vector of Dp; Γ denotes the interface between Dp and Ds; ; , which are the two sided limits along the direction of np from inside and outside the protein region Dp; g is a boundary value function, which can be simply set as zero for a sufficiently large box domain based on the fact that u (r)→0 as |r| →∞; np is the number of atoms of the protein; n is the number of ionic species of the ionic solvent; rj and zj denote the position and charge number for the jth atom of the protein; , Zi, and vi denote the bulk concentration, the charge number, and an ion volume of the ith ionic species; α, β, γ, and are the model parameters defined by
| (6) |
where v0 is a size scaling parameter (by default, v0 = min {vi | i = 1, 2, …, n}), and is the Dirac delta distribution at rj. Here, ec is the elementary charge, kB is the Boltzmann constant, T is the absolute temperature, ϵ0 is the permittivity of the vacuum, and NA denotes the Avogadro number.
In eqs. (3)–(5), the SI units have been used to measure length in angstroms (Å), ionic concentrations in moles per liter (mol/L), temperature in kelvins (K), charges in Coulombs (C), and electrostatic potential in volts.
For our numerical simulations, we used the following physical constant values:
where F, J, and m denote Farad (the unit of capacitance), Joule (the unit of energy), and meter, respectively. By these physical constants, we have
To extend the SMPBE for a protein in an ionic solvent to an ion channel on a membrane in an ionic solvent, we need to deal with membrane modeling issues. Currently, the membrane region Dm is treated as a dielectric slap without any charge. Thus, the electrostatic potential, u, within Dm is defined by the Laplace equation
| (7) |
where ϵm denotes a permittivity constant of the membrane region. In other words, the membrane is only considered as a water barrier in the current ion channel modeling.
However, because the membrane consists of many lipid and cholesterol molecules, its charge effect on the membrane potential is too strong to be ignored. To account for such an effect, we added a surface charge density, σ (in units of μC/cm2), on the membrane surface, Γm, and then obtained a new electric flux interface condition on Γm as follows:
| (8) |
where nm denotes the unit outward normal vector of Dm, and τ is a scaling constant such that τσ has units Å−1. Note that the directional derivatives also have units Å−1. Hence, these units can be removed from both sides of eq. (8), making it dimensionless. Under such conditions:
| (9) |
which is about 4.392 at T = 298.5 K. Experimentally measured values for σ range from 0.2 to 30 (μC/cm2).[27,28]
Another important ion channel modeling issue arises from the selection of boundary value conditions. Currently, the Dirichlet boundary condition of eq. (5) was set similarly to what was done in the case of a protein surrounded by an ionic solvent without considering any membrane boundary influence on the four side surface ΓN of the box domain. We address this issue by constructing a mixed boundary value condition—a Neumann boundary condition on the four side surfaces ΓN as follows:
| (10) |
together with the Dirichlet boundary value condition on the bottom and top surfaces ΓD:
| (11) |
where nb denotes the unit outward normal vector of Ω, and g is selected as a piecewise function:
| (12) |
Here, ub and ut denote two boundary potential functions defined on the bottom surface Γb and top surface Γt of the box domain Ω, respectively. Clearly, we can simply set ut = 0 and ub = 0 when the box dimension in the z-axis direction is sufficiently large according to the fact that u(r) → 0 as |z| → ∞ for r = (x, y, z). We can also set nonzero ut and ub to mimic an external voltage, V, across the membrane by setting V = ut − ub.
The Neumann boundary condition (10) is a natural boundary value condition because it reflects the fact that none of the charges enters the box domain Ω from the four side surface ΓN. Hence, our new mixed boundary value condition well reflects the influence of membrane on the boundary values of electrostatic potential u.
In addition, we redefine the solvent permittivity constant ϵs as a piecewise constant function
| (13) |
where θ is a reduction factor between 0 and 1. This new change reflects the fact that the channel pore has much less water than the bulk solvent due to ions crowding inside the channel pore; thus, the solvent permittivity constant ϵs of bulk water can be significantly reduced within the pore area.
For clarity, we now combine eqs. (3), (4), and (7) with the interface and boundary value conditions, namely eqs. (5), (8), (10), and (11), to obtain a nonlinear interface boundary value problem as follows:
| (14) |
which gives the definition of our SMPBIC model. Here, α, β, γ, τ, g, and ϵs are given in eqs. (6), (9), (12), and (13), respectively, is the bulk concentration of species i in mol/L, and σ is a membrane surface charge in μC/cm2. When a solution u of SMPBIC model is given, the corresponding electrostatic potential function Φ is derived by the formula
Specifically, when we set v0 = 0, our SMPBIC model (14) is reduced to a Poisson–Boltzmann equation ion channel (PBEic) model as follows:
| (15) |
Furthermore, setting all for i = 1, 2, …, n (i.e., no any ion in the solvent) in the above PBEic model, we obtain a Poisson dielectric model for an ion channel in the pure water solvent as follows:
| (16) |
Although the above Poisson dielectric model is unrealistic in biology because an ion channel protein cannot survive in water solution, it can be a valuable reference model for the calculation of electrostatic solvation free energy, as discussed under the Calculation of Electrostatic Solvation Free Energy section.
When our SMPBIC model solution u is known, the concentration function ci of species i (in units mol/L) can be calculated using the following equation:
| (17) |
Setting v0 = 0 in the above formula gives the classic Boltzmann distribution formula
| (18) |
where u is a solution of the PBEIC model, namely eq. (15).
A Submodel Partitioning of the SMPBIC Model
In this section, we on our SMPBIC model into three submodels to overcome the solution singularity difficulties caused by the atomic charges from an ion channel molecular structure. Similar partitioning was done for a protein surrounded by an ionic solvent in References [25,41,43], but its construction becomes more difficult for the case of SMPBIC model since it involves more complicated geometries, more difficult interface conditions, and more difficult boundary value conditions. The three submodels of our SMPBIC model are referred to as models 1–3 for clarity.
For simplicity, we only consider the case for which ϵm = ϵp. Under this assumption, we set
and find that model 1 is defined by the Poisson equation over the whole space ,
| (19) |
Model 2 is defined by the linear interface boundary value problem
| (20) |
and Model 3 is defined by the nonlinear interface boundary value problem
| (21) |
In the above equations, n denotes the unit outward normal vector of Dpm. From Ref. [25], we can show that the analytical solution G of model 1 is given by
| (22) |
and its gradient vector is given by
| (23) |
Clearly, when the solutions Ψ and of models 2 and 3 are found, the solution u of our SMPBIC model (14) can be constructed by the formula
| (24) |
Note that G is singular at each atomic position rj for j = 1, 2, …, np, and models 2 and 3 are well defined within the protein, membrane, and solvent regions. Hence, from the solution decomposition formula (24), one can show that our SMPBIC model (14) has np singularity points within the protein region Dp, causing it to become very difficult to solve numerically. With the three submodel partitioning, we completely avoid this singularity problem by solving models 2 and 3, which are clearly much easier to solve than the original SMPBIC model (14).
Furthermore, using the fact that ΔG(r) = 0 for r ∈ Dm ⋃ Ds, we can show that the sum of G and Ψ gives the solution of the Poisson dielectric model (16) for an ion channel in water.
Calculation of Electrostatic Solvation Free Energy
Electrostatic solvation energy, E, is one important part of the solvation energy. In general, E can be estimated by
where u is an electrostatic potential of an electric field induced by a fixed charge density function ρ, and is a constant for converting the unit of E from Joules to kilocalories per mole (kcal/mol). The electrostatic solvation free energy, ΔE, represents the energy that is required to move a charged system from the reference state to the current state. It can be estimated as the energy difference from a reference state:
where Eref is the electrostatic solvation energy induced by the same charge density ρ in the reference state.
In the case of our SMPBIC model, we have the charge density function ρ in the expression
| (25) |
We define the reference state using the water solvent SMPBIC model (16) and then use solution decomposition (24) to obtain the reference potential uref as follows:
| (26) |
Note that all ci = 0 for i = 1, 2, …, n in the reference state, and for r ∈Ω. Hence, with eqs. (25), (26), and the box domain partition (2), we can obtain a new formula for computing ΔE as follows:
| (27) |
where γ = 10−27NA ≈ 6.02214129 × 10⁻⁴, which converts the concentration unit from mol/L to per cubic angstroms as required in the calculation of energy.
Currently, the free energy ΔE is often calculated in three steps:
Step 1: Calculate the electrostatic solvation energy Esol by solving the PBE on the solvated state.
Step 2: Calculate the electrostatic solvation energy Eref by solving the Poisson dielectric model on the reference state—a protein in the whole space with permittivity ϵp.
Step 3: Set the free energy ΔE = Esol − Eref.
See the website https://apbs-pdb2pqr.readthedocs.io/en/latest/examples/solvation-energies.html from the APBS project, for example. When ϵp = 1, the reference state reflects the case of a protein in the vacuum. In our notation, the potential uref of the current reference state is the solution G of model 1, which is defined in eq. (19) with G given in eq. (22). Thus, the potential difference can be obtained directly from our solution decomposition formula (24) as follows:
Hence, the current formula for computing the free energy ΔE can be reformulated in terms of our component functions Ψ and in the expression:
| (28) |
The above expression for ΔE is often approximated by
| (29) |
without involving any ionic concentrations ci. The reason why each ci is ignored in the calculation of ΔE is that formula (29) is originally introduced in the case of PBE, in which ions are treated as volume-less points. As such, each ci, estimated by the Boltzmann distribution (18), may become unrealistically large, especially near a strongly charged molecular surface.
Numerical Results
We developed an effective finite element algorithm for solving our SMPBIC model, and programmed it as a software package based on the above submodel partitioning (eq. (24)), our PBE and SMPBE program packages,[25,43] the state-of-the-art finite element library from the FEniCS project,[44] and an ion channel membrane finite element mesh program package from.[45] Using this software package and three ionic solvents with up to five ionic species, we simulated the ionic concentrations, electrostatic potential, and electrostatic solvation free energy based on a 3D human VDAC1 (hVDAC1) structure, which we downloaded from the Orientations of Proteins in Membranes (OPM) database https://opm.phar.umich.edu using the PDB identification number 2JK4.
The reason why we did not use the PDB website https://www.rcsb.org/ to download the PDB file of hVDAC1 is that the PDB file from OPM gives the membrane location numbers Z1 and Z2, and the 3D molecular structure of hVDAC1 has been transformed in the position as illustrated in Figure 2. This molecular structure was determined conjointly by NMR spectroscopy and X-ray crystallography.[42] As shown in Figure 2, it is composed of 19 beta strands with an alpha-helix located horizontally midway within the pore to adopt a beta-barrel architecture. Such a channel architecture is common to all VDAC proteins. It has been known that this hVDAC1 molecular structure is in the open state and is anion selective. Thus, it is a good test case to check whether our SMPBIC model can retain the hVDAC1 anion selectivity property or not.
Figure 2.
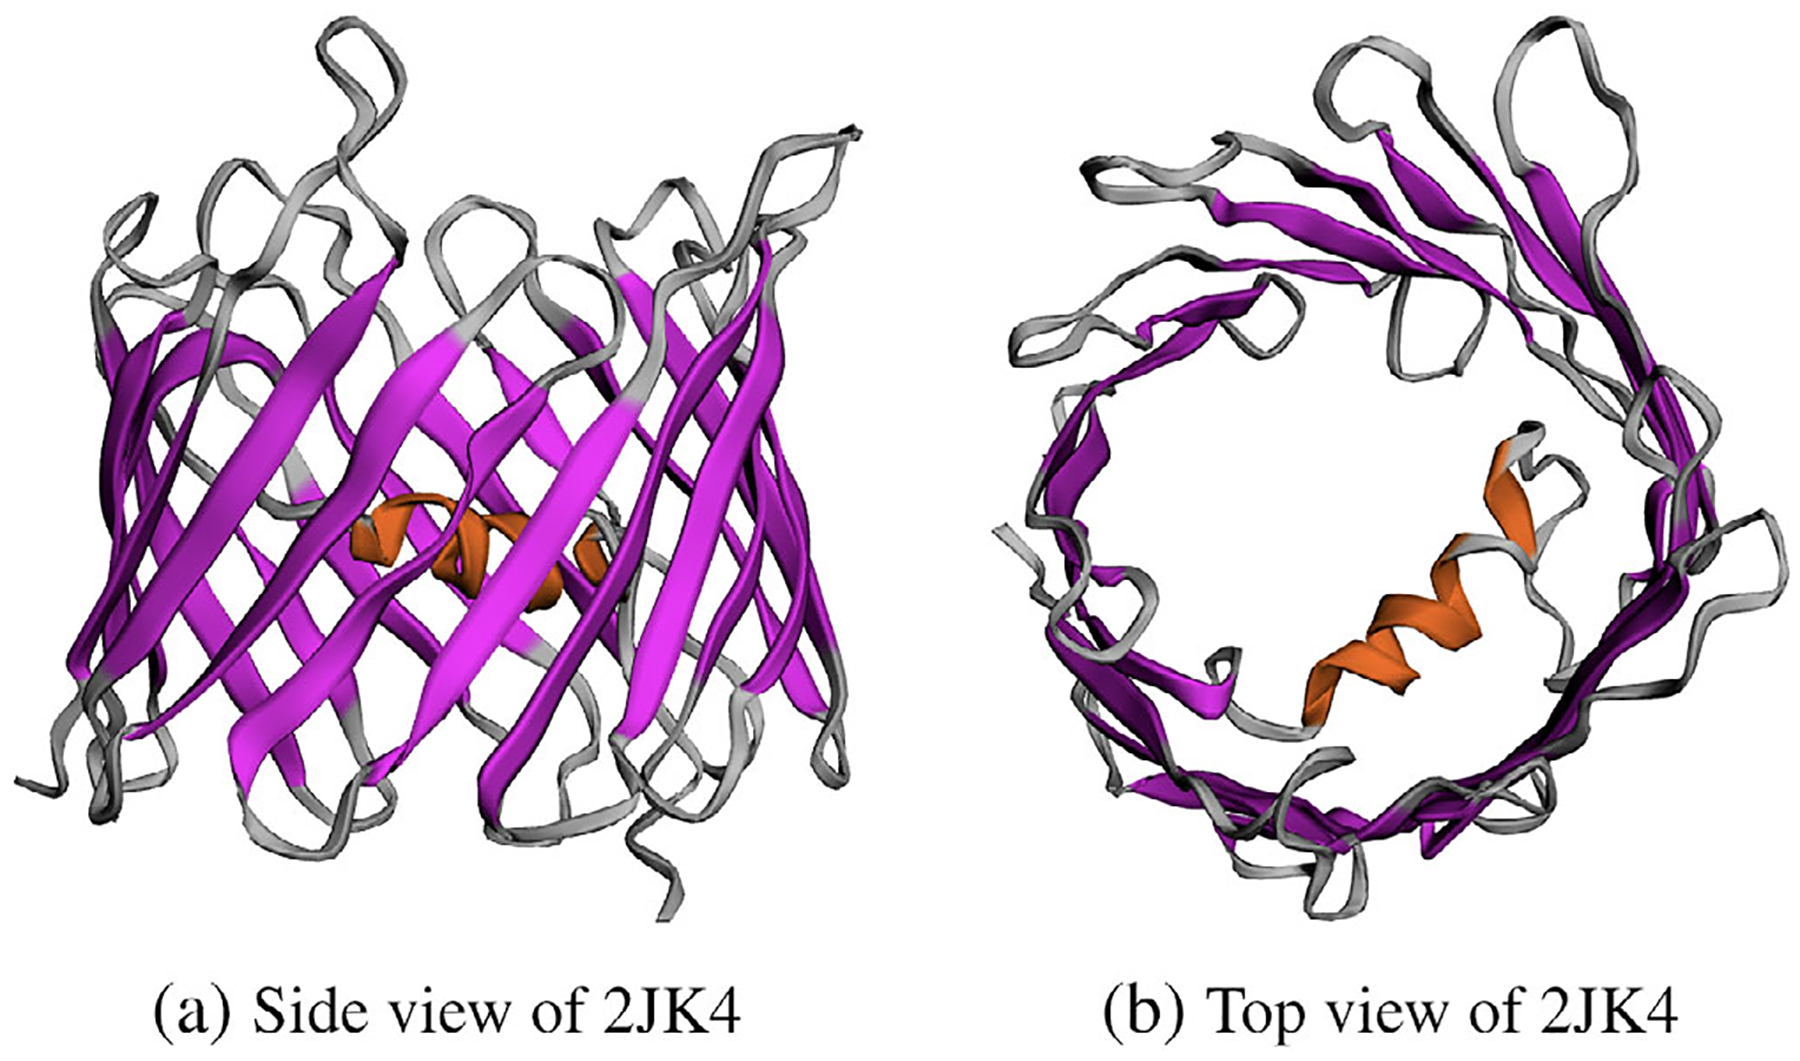
Two molecular structure views (in cartoon style) of the human voltage-dependent anion channel with PDB ID 2JK4.[42]
With the PDB file of hVDAC1, we got the missed data in the PDB file (such as the hydrogen atoms, the atomic charge numbers, and atomic radii) from the PDB2PQR web server (http://nbcr-222.ucsd.edu/pdb2pqr_2.1.1/) as required by our SMPBIC model and the finite element mesh generation software package.[45] Here, we selected a CHARMM forcefield and removed all the water molecules to produce a PQR file of hVDAC1.
Using the membrane position numbers Z1 = −11.7 and Z2 = 11.7 in Å, which were produced from OPM, and the PQR file of hVDAC1, we generated an interface fitted irregular tetrahedral mesh of a box domain Ω with dimensions 80 × 80 × 100 by the mesh program package.[45] Here, the box domain Ω of eq. (1) is defined by using
and its mesh has 78,888 mesh nodes and 488,206 tetrahedra. Two views of the mesh are shown in Figure 3a,b. The submeshes for the membrane and protein regions Dm and Dp were also extracted from the box mesh, and displayed, separately, in Figure 3c,d to demonstrate the complexity of an interface fitted irregular tetrahedral mesh.
Figure 3.
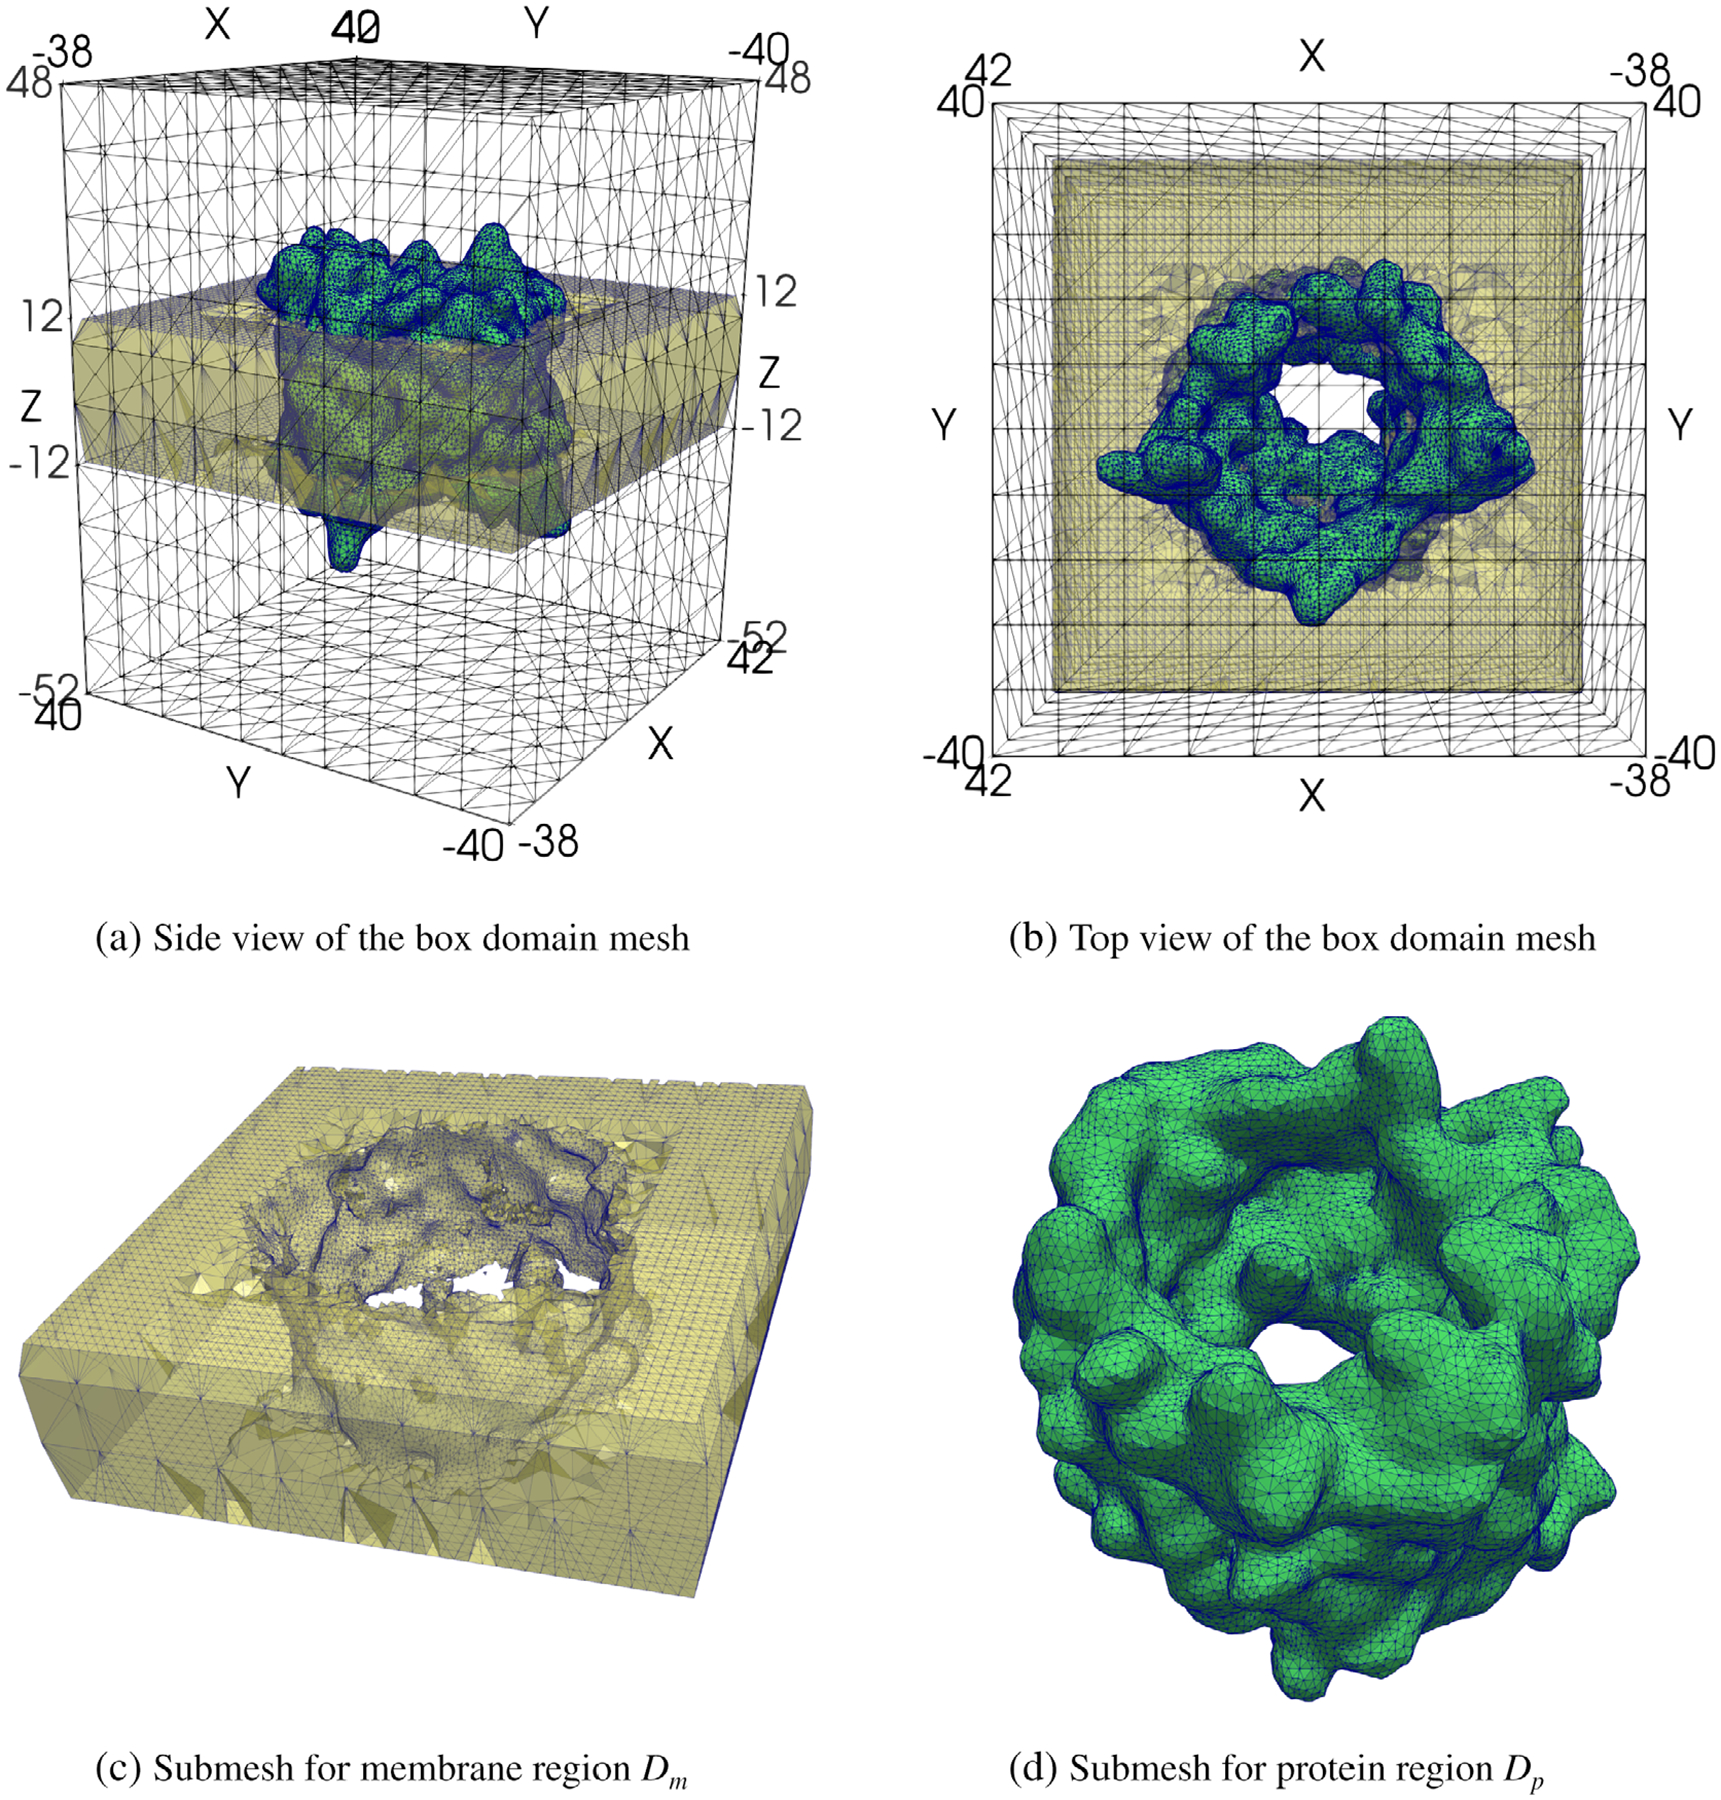
Four views of the interface fitted irregular tetrahedral mesh of a box domain Ω used for SMPBIC model calculation. Here, the meshes of the membrane region Dm and protein region Dp are colored in yellow and green, respectively, for clarity.
Using this mesh, we constructed the systems of linear and nonlinear finite element equations of models 2 and 3, which are defined in eqs. (20) and (21), respectively, to approximate Ψ and We solved the nonlinear algebraic system for by a modified Newton minimization algorithm and approximated the solution of each related linear algebraic system by a preconditioned generalized minimal residual method (GMRES) with incomplete LU preconditioning. Each of the linear and nonlinear systems has about 78,888 unknown variables to solve, and each iterative process was terminated whenever the residual norm of a finite element equation systems was less than 10−5.
For simplicity, we set ϵp = 2, ϵm = 2, ϵs = 80, ub = 0, and ut = 0 for all the numerical tests. Each ion was treated as a cubic box with the same volume as defined in eq. (6). Here, the hydrated ion radii of five ionic species, K+, Na+, Mg2+, Ca2+, and Cl− were set as 3.31, 3.58, 4.28, 4.12, and 3.32 in Å, respectively, which came from reference [46] (see table 1 in this reference). The bulk concentrations were set in mol/L according to the electroneutrality condition and the definition of ionic strength Is as follows:
| (30) |
In the numerical tests, we used the following three salt solutions:
A salt solution of NaCl with mol/L.
A salt solution of KCl with mol/L.
A solution mixture of KCl (0.140 mol/L), NaCl (0.01 mol/L), MgCl2 (0.01 mol/L), and CaCl2 (0.00025 mol/L).
Using the conditions of eq. (30), we found that the bulk concentrations of Cl−, K+, Na+, Mg2+, and Ca2+ were 0.15140, 0.14, 0.01, 0.0007, and 0.83333 × 10⁻⁷ in mol/L, respectively, for the solution mixture.
All the numerical tests were done on one processor of a Mac Pro Workstation with the 3.7 GHz Quad-Core Intel XeonE5 and 64 GB memory. Each SMPBIC model test took only about 30 s, including solving the linear finite element system of Ψ and the nonlinear finite element system of and calculating the potential u and ionic concentrations ci. This demonstrates the efficiency of our SMPBIC model finite element program package. The numerical results are reported in Figures 4–9 to show, respectively, (1) the case of varying the solvent permittivity constant ϵs within the channel pore; (2) the case of varying the membrane surface charge density σ; (3) the potential values on the four side surface ΓN caused by the Neumann boundary condition; (4) the potential values on the molecular surface of hVDAC1; and (5) the values of potential u and ionic concentrations ci on a cross section of the box domain and within the channel pore of hVDAC1. In these tests, we calculated the electrostatic free energies using formulas (27) and (29) to show their differences.
Figure 4.
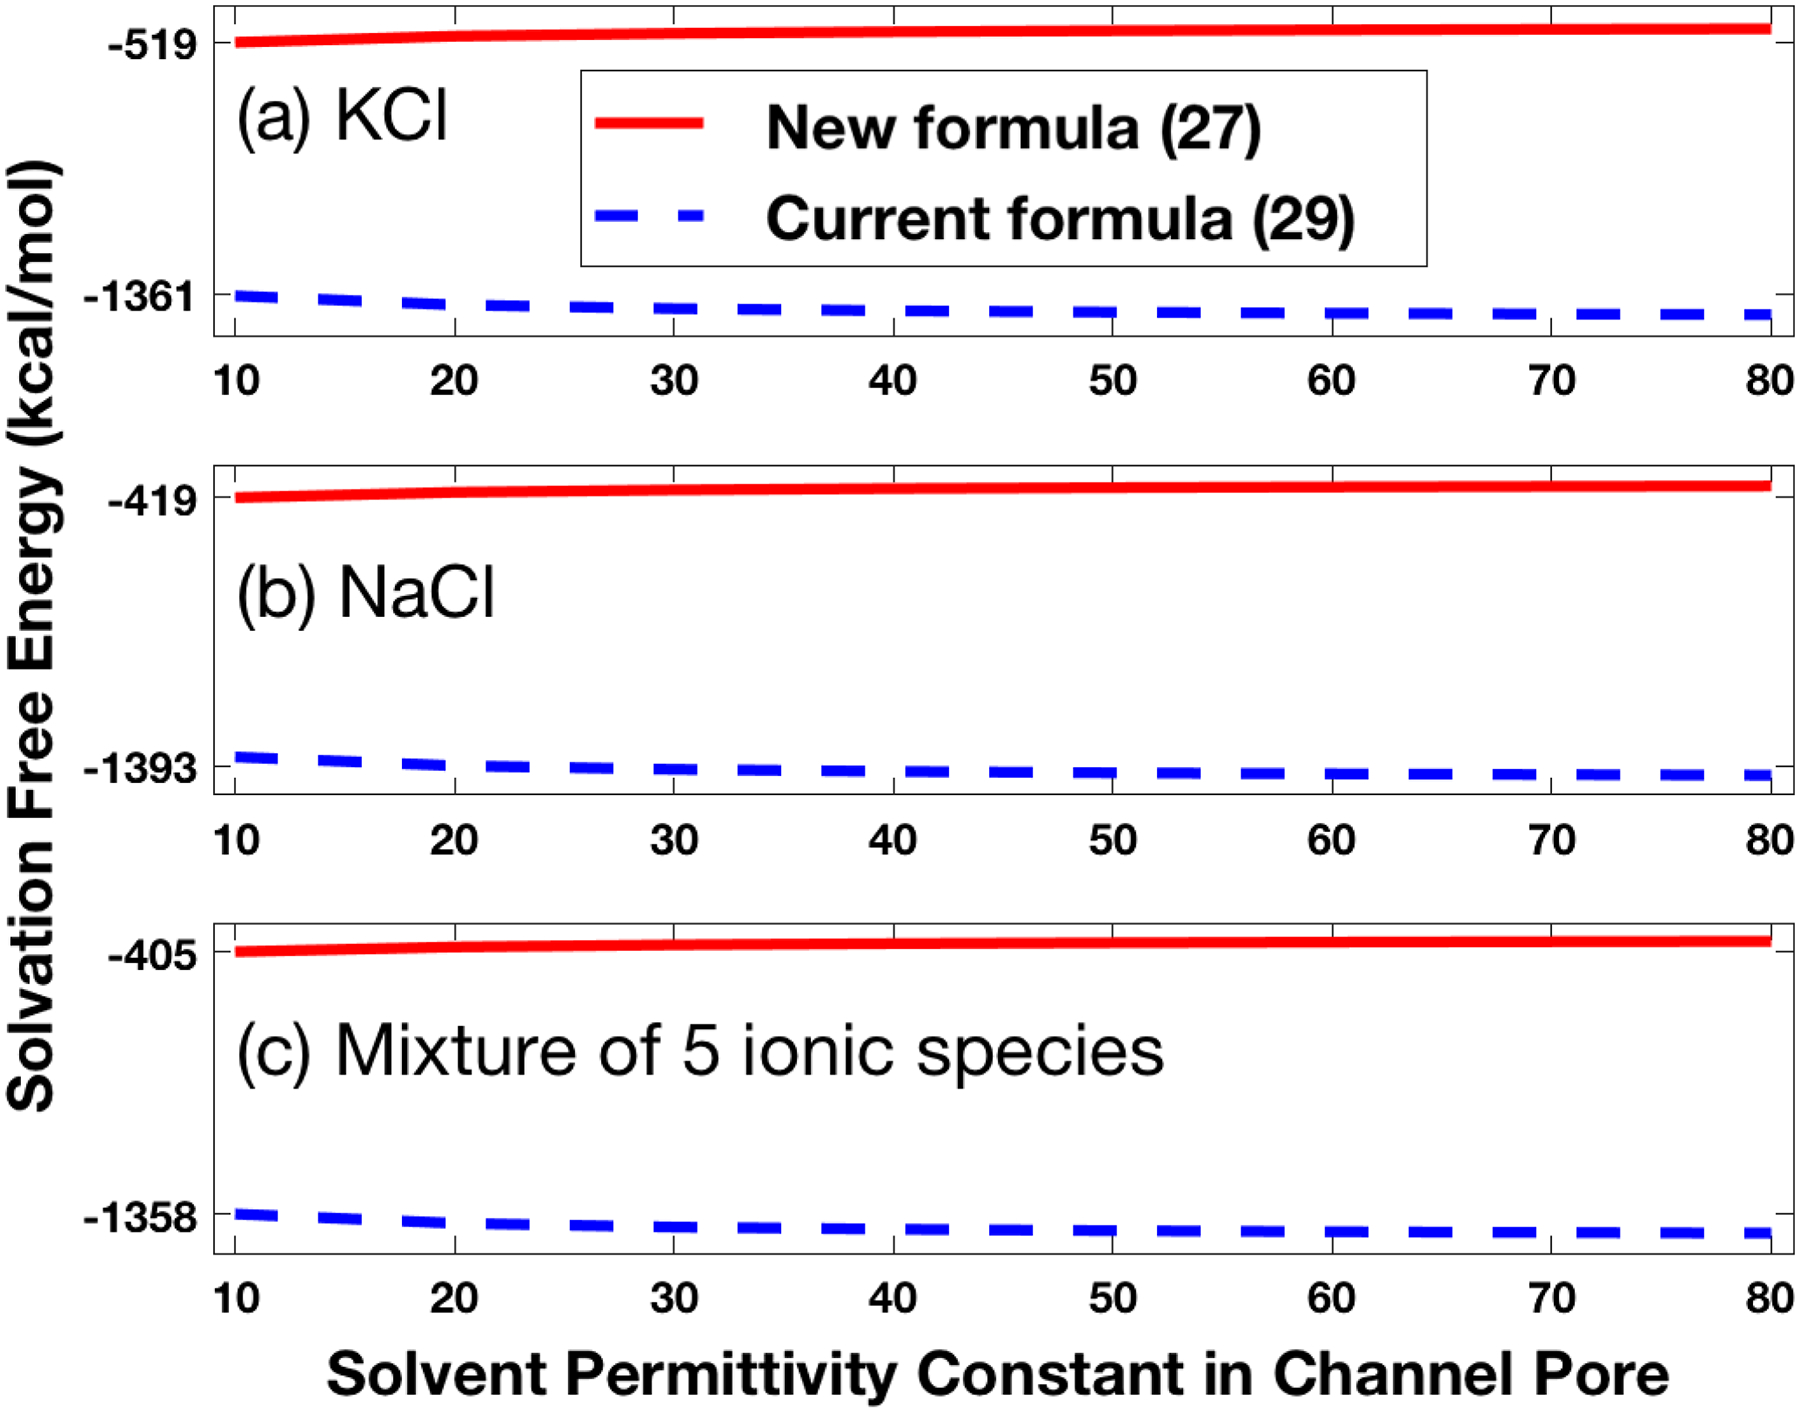
Effects of reducing the solvent permittivity constant ϵs within the channel pore from 80 to 10 on the solvation free energy ΔE for the hVDAC1 in a) a solution of 0.14 mol KCl, b) a solution of 0.1 mol NaCl, and c) a mixture of 0.14 mol KCl, 0.01 mol NaCl, 0.01 mol MgCl2, and 0.00025 mol CaCl2.
Figure 9.
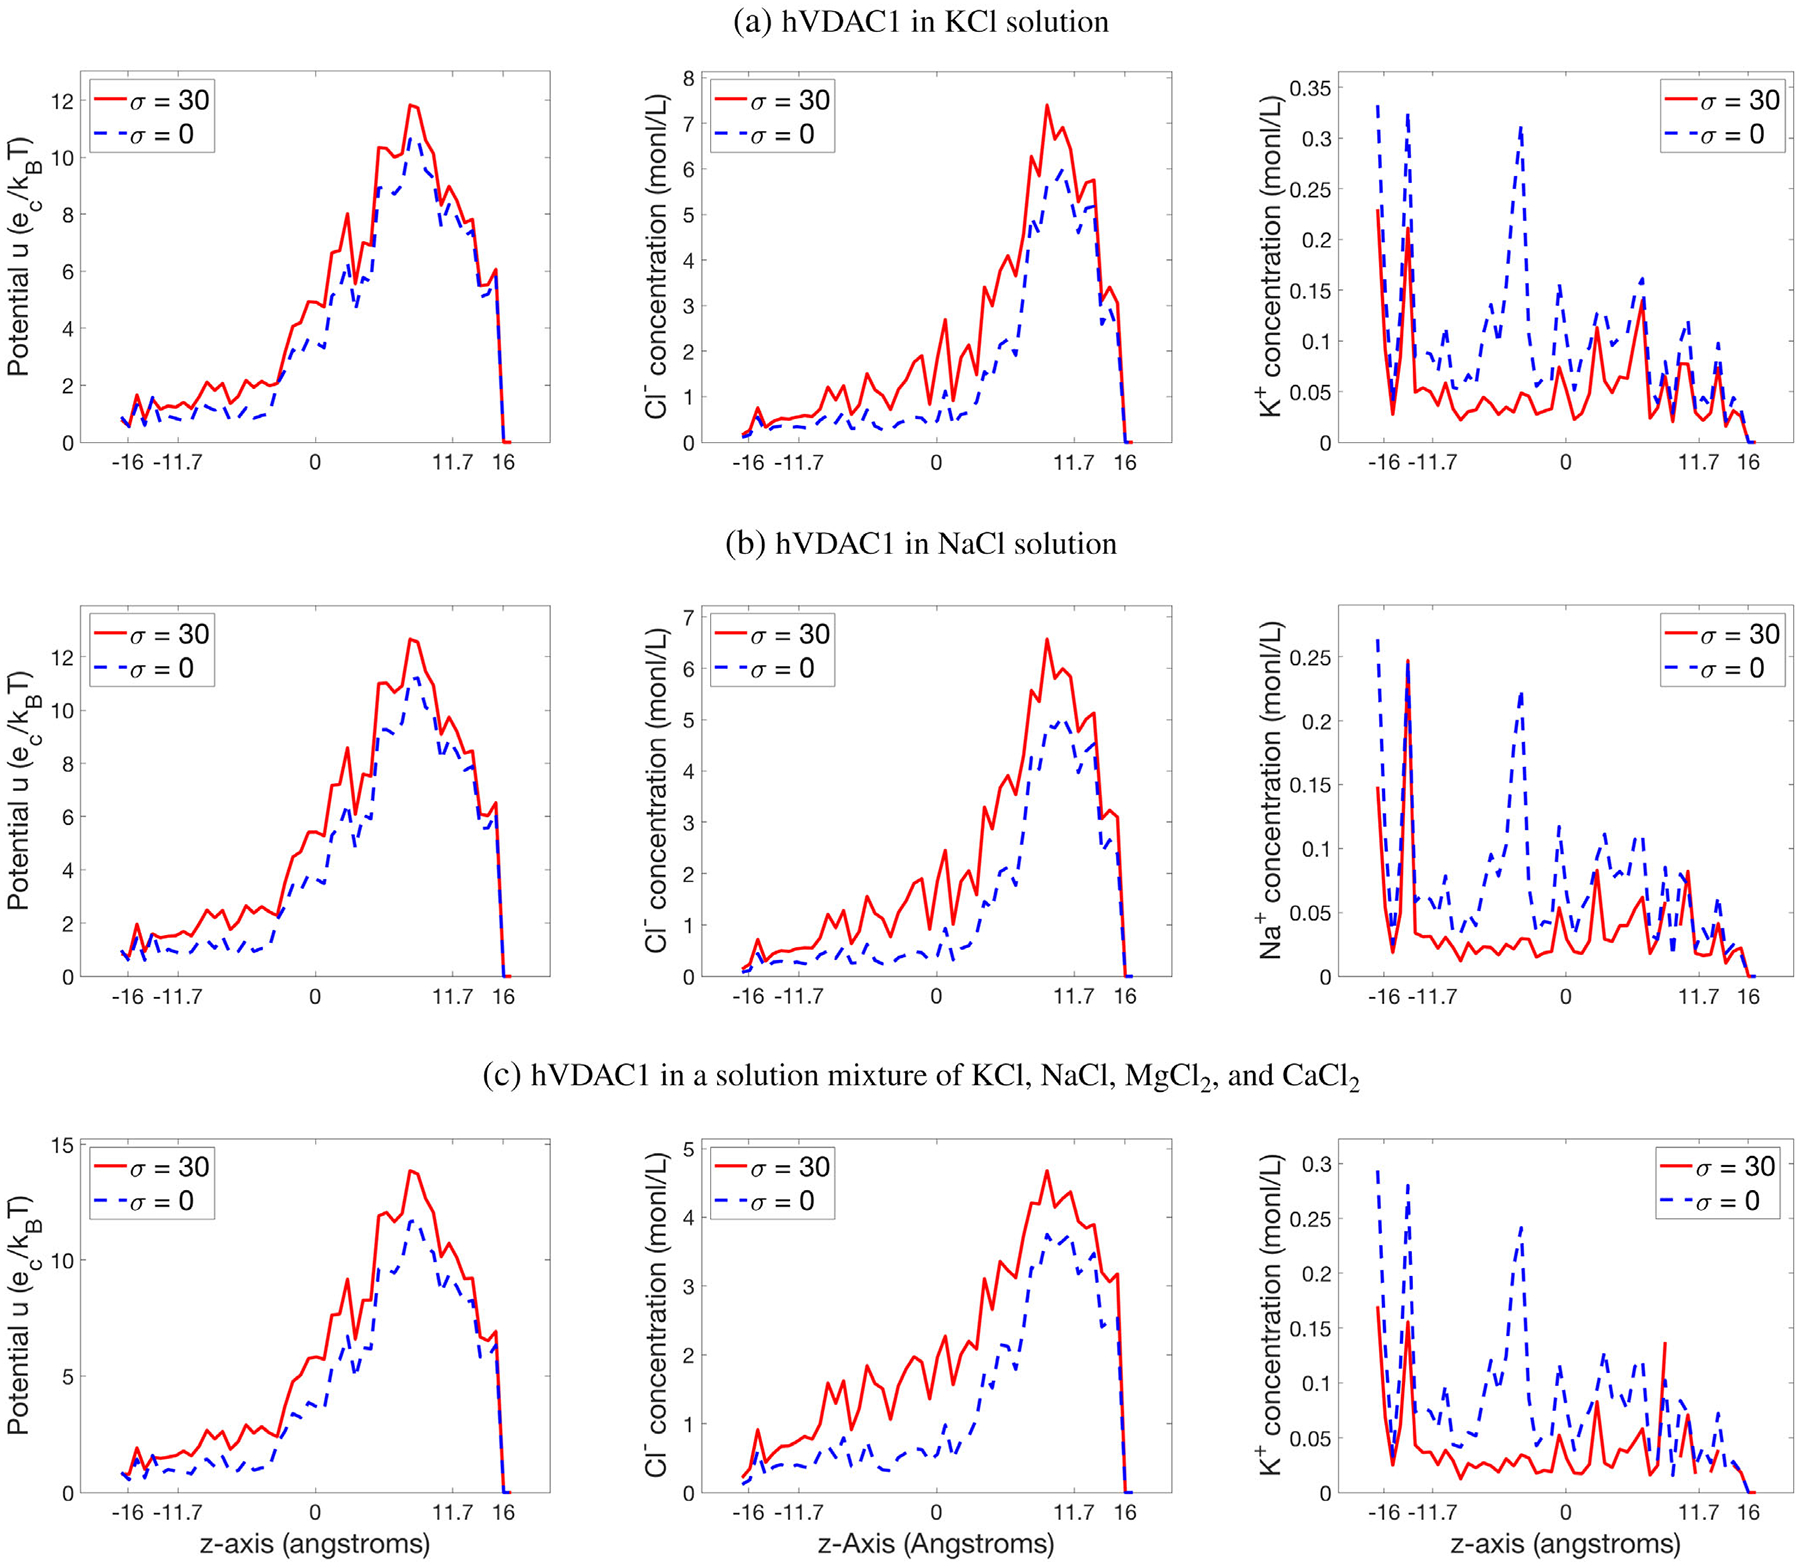
A comparison of the electrostatic potential u and ionic concentrations ci generated by SMPBIC model using membrane surface charge density σ = 30 μC/cm2 or without any membrane surface charge (i.e., σ = 0). a)–c) report the results for hVDAC1 in a solution of KCl (0.14 mol/L), a solution of NaCl (0.1 mol/L), and a solution mixture of KCl (0.14 mol/L), NaCl (0.01 mol/L), MgCl2 (0.01 mol/L), and CaCl2 (0.00025 mol), respectively. Here, the values of potential and concentrations are defined by eqs. (31) and (32).
Figure 4 displays the values of solvation free energy ΔE as a function of the bulk solvent permittivity constant within the channel pore with σ = 0. From this figure, it can be seen that these values did not vary much when the bulk solvent permittivity constant ϵs was reduced from 80 to 10 within the channel pore, consistent with the small effects of using a smaller solvent permittivity constant within the channel pore on the calculation of ΔE. From Figure 4, it can also be seen that our new formula (27) produced much smaller free energy values than the current formula (29) in absolute value. These results are consistent with the fact that moving a charged hVDAC1 from the ionic solvent state to the pure water state should take less energy than that to the state of the whole space full of water.
Figure 5 displays the values of ΔE as a function of the membrane surface charge density σ for the hVDAC1 in the three ionic solvents with up to five ionic species with ϵs = 50 within the channel pore. From this figure, we can see that the values of solvation free energy ΔE calculated by our new formula (27) better reflect the effects of membrane surface charges than that by the current formula (29), since the new formula (27) includes the energy contribution from the solvent region Ds, which is ignored in the current formula (29).
Figure 5.
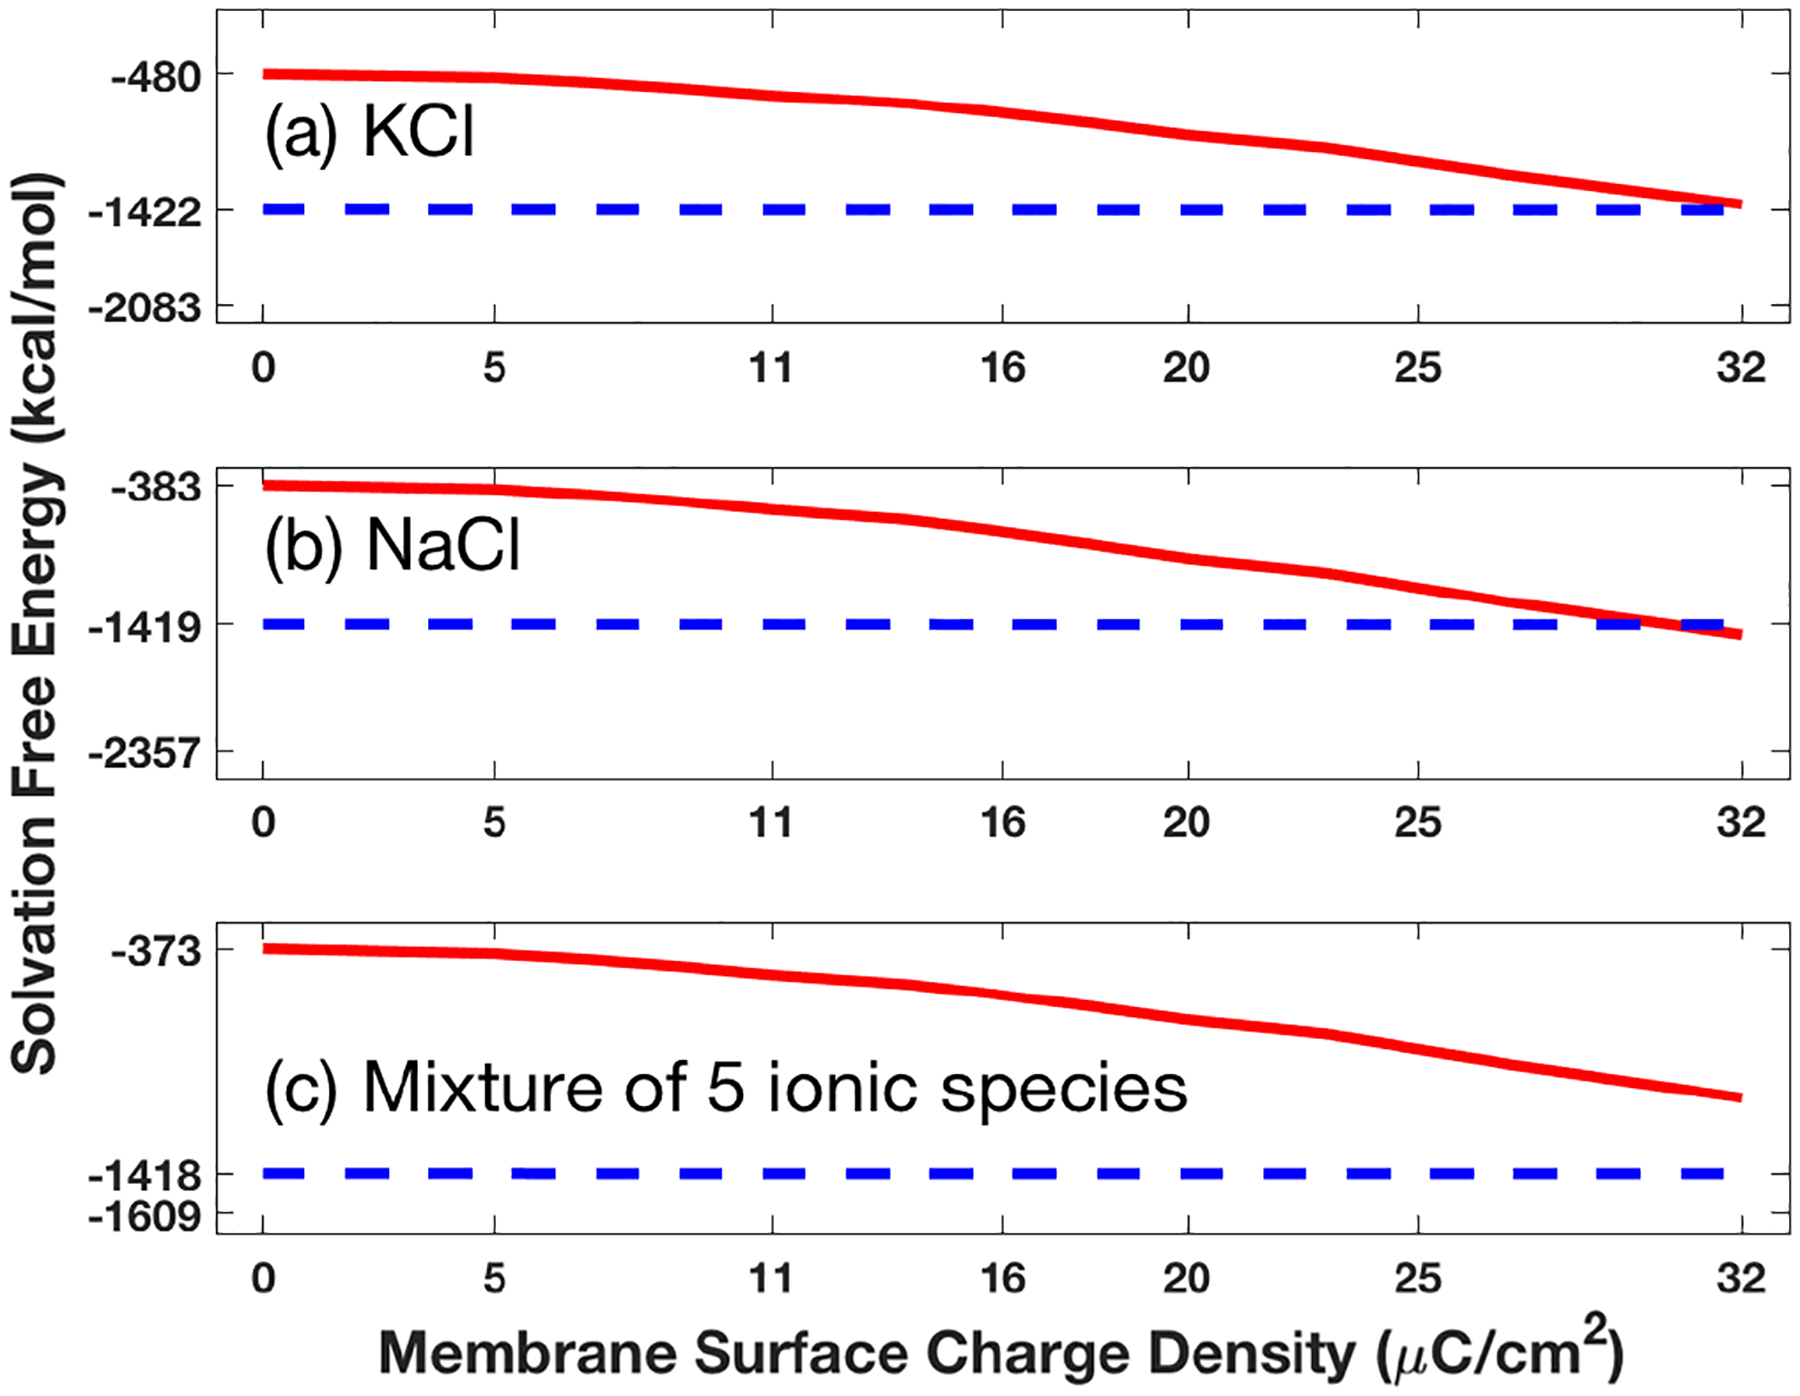
Effects of increasing the membrane surface charge density σ from 0 to 32 on the solvation free energy ΔE for the hVDAC1 in a) a solution of 0.14 mol KCl, b) a solution of 0.1 mol NaCl, and c) a mixture of 0.14 mol KCl, 0.01 mol NaCl, 0.01 mol MgCl2, and 0.00025 mol CaCl2.
We next visualized the electrostatic potential u and ionic concentrations ci generated by our SMPBIC model (14) onto a molecular surface of hVDAC1 protein or a cross section of the box domain Ω in color mapping (i.e., representing values in colors). Such a visualization method is commonly used in the study of a biomolecule to visually display the charge distribution and charge related properties of a biomolecule. As examples, we only plotted the electrostatic potential u and ionic concentrations ci for the KCL solution case in Figures 6–8. Here, we fixed the Direchlet boundary condition (11) with ut = ub = 0, and the bulk concentration of a KCL solution as 0.14 mol/L (physiologically realistic condition).
Figure 6.
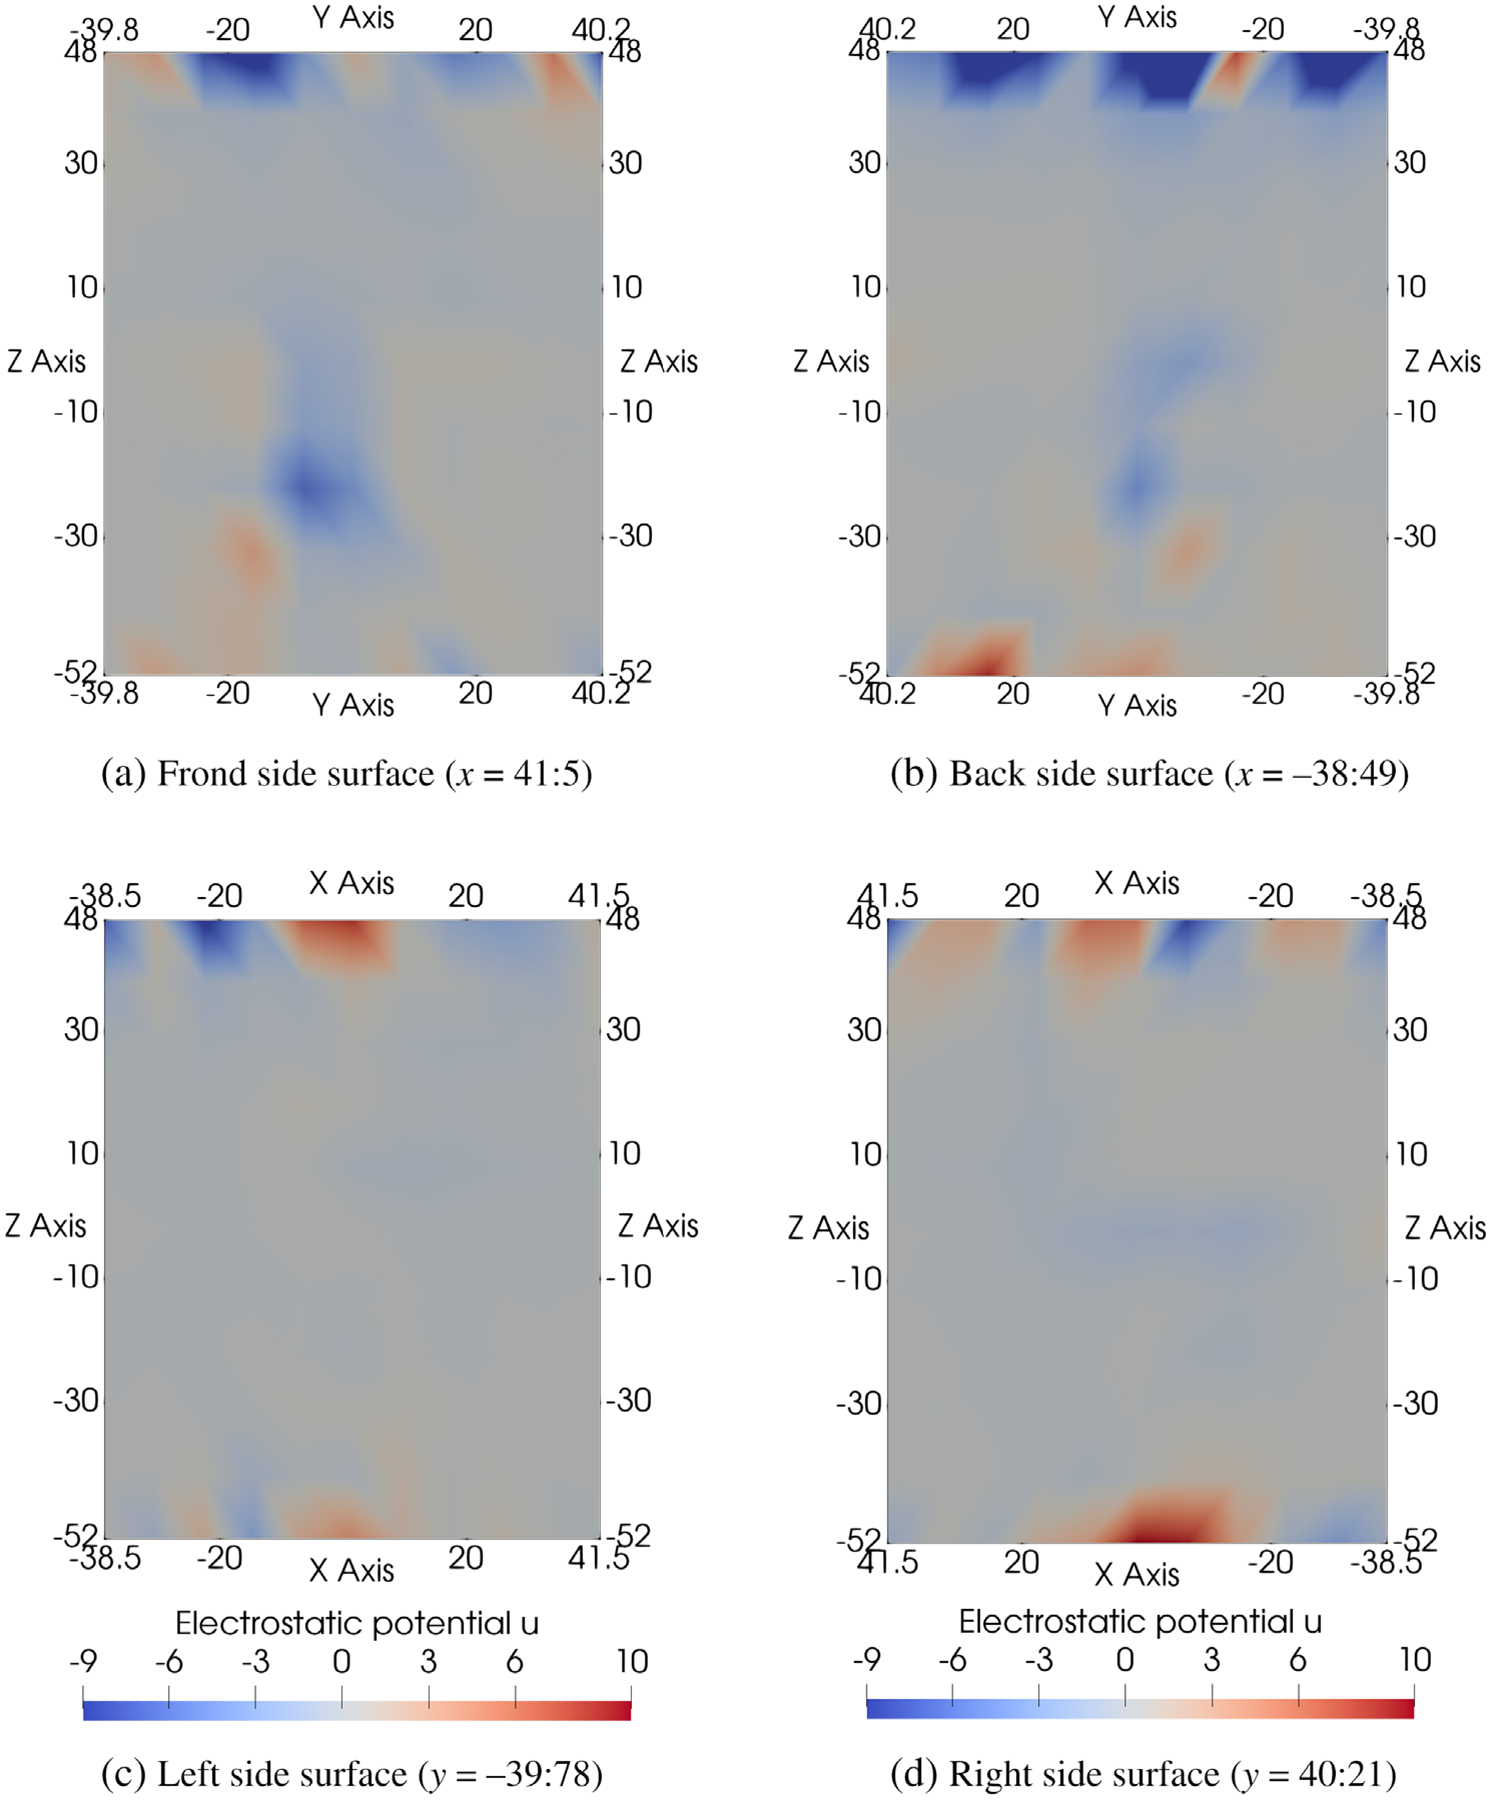
Electrostatic potential u on the four side surfaces of the box domain Ω generated by SMPBIC model using the Neumann boundary condition (10) for hVDAC1 in a salt solution of KCl (0.14 mol/L). Here, the membrane surface charge density σ = 0 for hVDAC1 in KCl solution.
Figure 8.
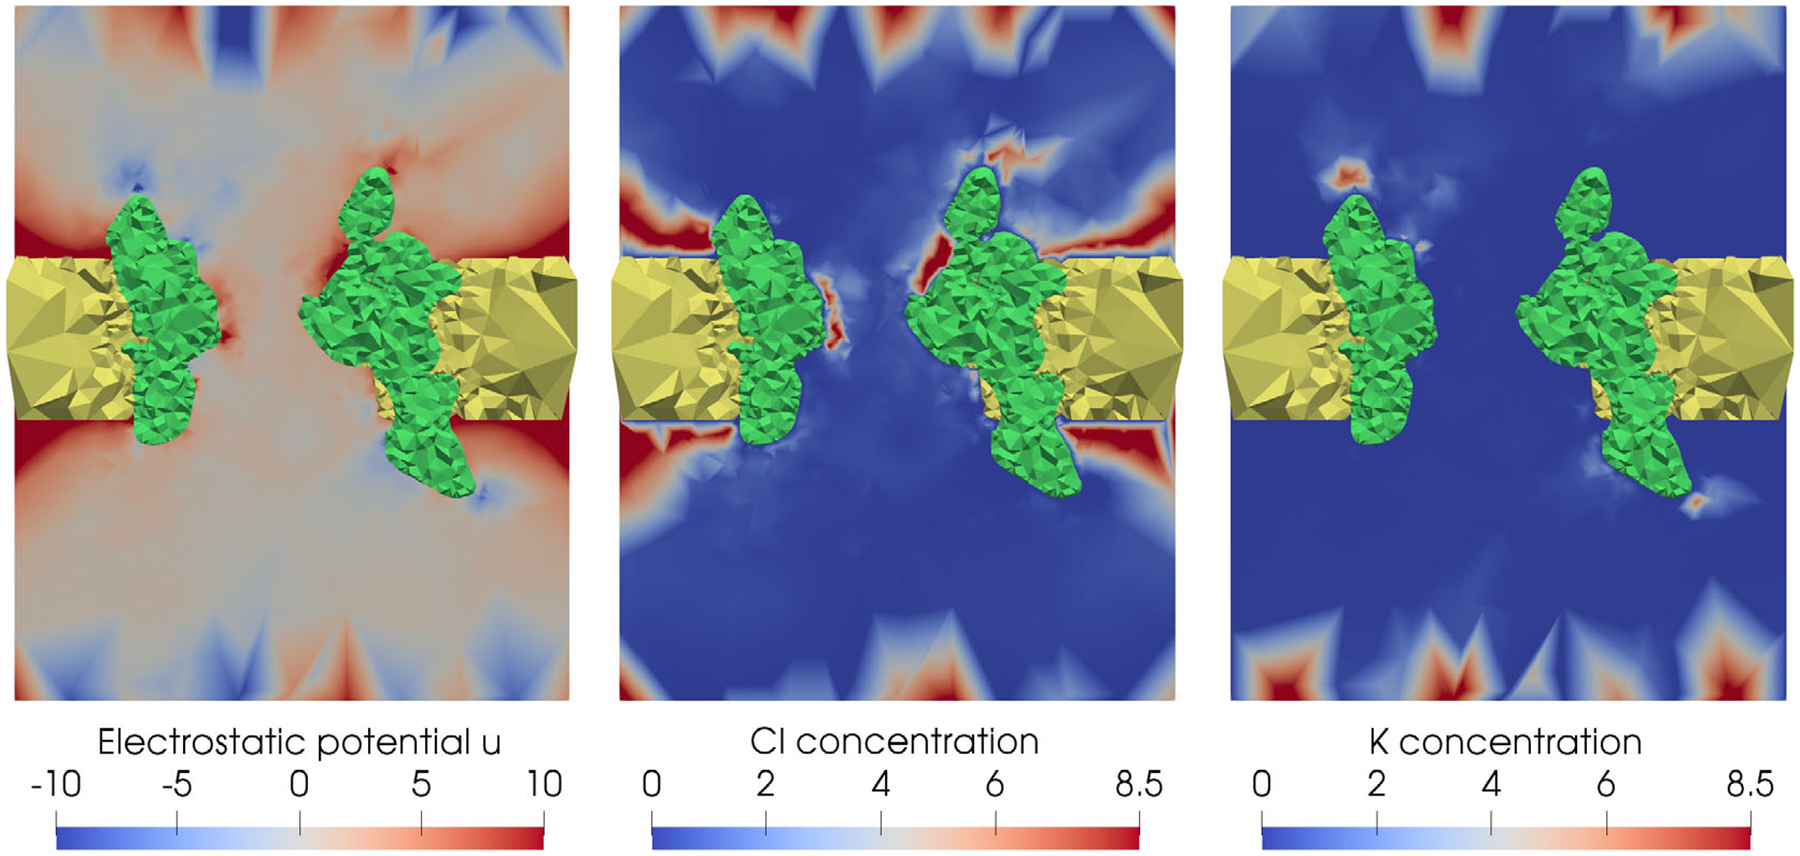
The electrostatic potential u and concentrations of Cl− and K+ ions calculated by SMPBIC model on a cross section of the box domain (x = 0) in color mapping for hVDAC1 in KCl solution (0.14 mol/L) with the membrane surface charge density σ = 30μC.
Figure 6 displays the boundary values of electrostatic potential u on the four side surfaces ΓN of the box domain Ω with σ = 0. From Figure 6, it can be seen that the boundary values on ΓN varied in a large range from −9 to 10, which has significant impact on the electrostatics of hVDAC1. These boundary values are very different from a boundary value function used in the current Dirichlet boundary condition (e.g., a zero or an multiple Debye–Hückel potential function).[33] The natural Neumann boundary condition (10) also characterizes an important feature of the membrane environment—no charge enters from any side surface of the box domain Ω. Hence, our new mixed boundary value condition of eqs. (10) and (11) is a good boundary condition for ion channel modeling.
Figure 7 maps the electrostatic potential u in colors on a molecular surface (plots A1 and B1) and a cross section defined by x = 0 (plots A2 and B2) to show the influence of membrane surface charges on the electrostatics of hVDAC1. This calculation was carried out for σ = 30 (plots A2 and B2) and σ = 0 (plots A1 and B1), respectively, and the color mapping was set from the blue for all the values of u ≤ −5 to the red for all the values of u ≥ 5. From Figure 7, it can be seen that the membrane surface charge caused the electrostatic potential u to have a significant value change. This suggests that considering the charge effect of membrane is important in the construction of an ion channel model.
Figure 7.
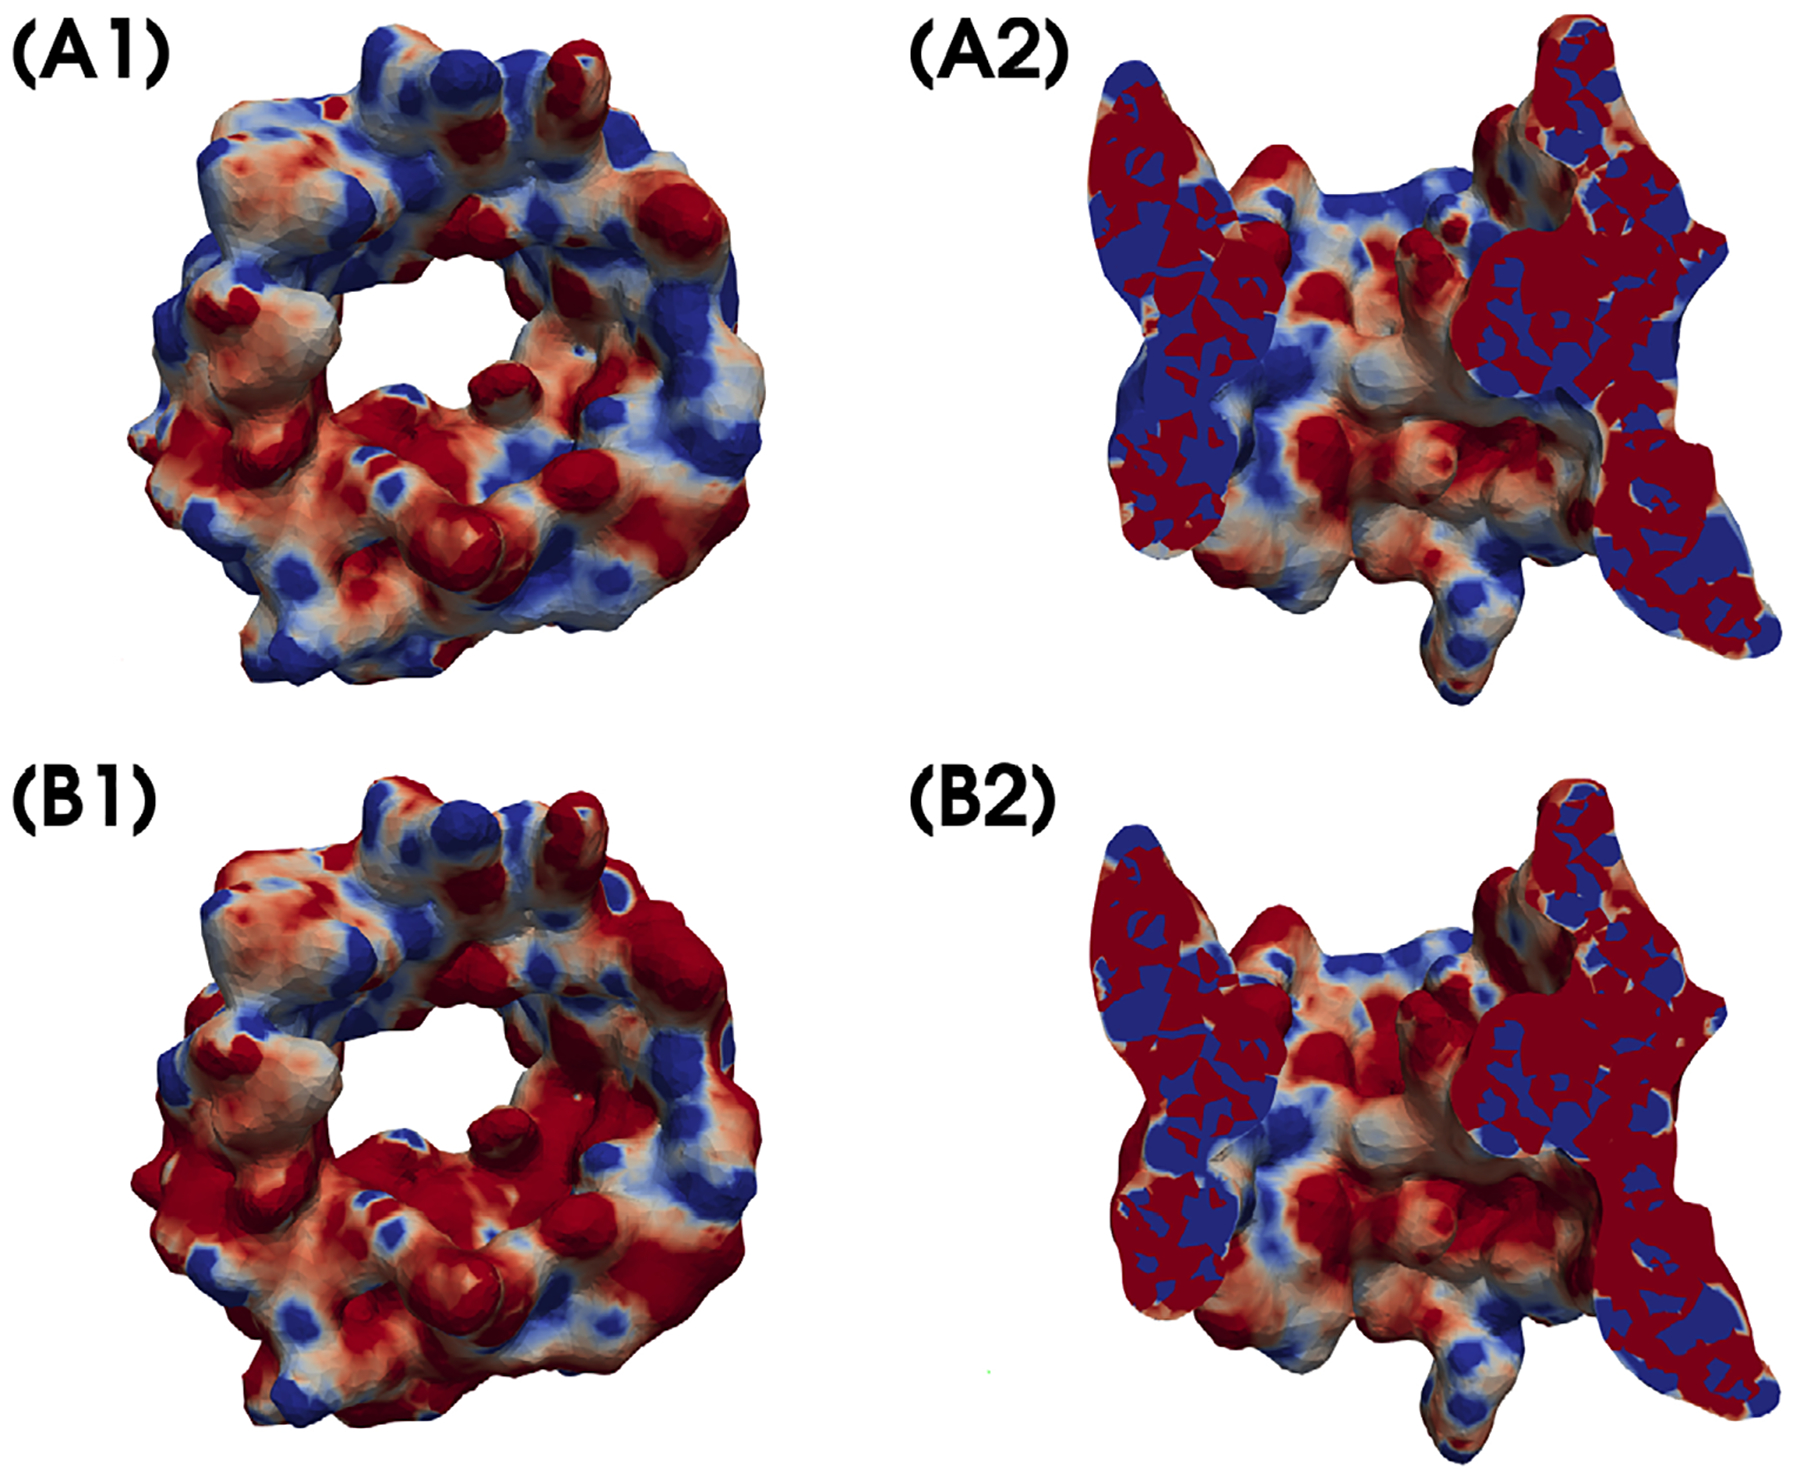
A comparison of the electrostatic potential u by SMPBIC model using σ = 30 μC/cm2 (B1 and B2) with that using σ = 0 (A1 and A2). Here, the values of u are mapped in colors from blue (for u ≤ −5) to red (for u ≥ 5) on a molecular surface (A1 and B1) of hVDAC1 and a cross section defined by x = 0 (A2 and B2) to display the values of u on an inner surface of hVDAC1.
Figure 8 displays the electrostatic potential u and the concentrations of anions Cl− and cations K+ in a color spectrum, with blue as the lowest value and red as the highest value. Here, we marked the membrane and channel protein regions in yellow and green colors, respectively, to let us focus on the values in the solvent region Ds. With this figure, we can clearly interpret how the electrostatics of hVDAC1 induce the anion selectivity property of hVDAC1, from Figure 8, we can see that the channel pore area is colored mostly in red for the electrostatic potential u. As a result, anions Cl− were attracted to the channel pore while most cations K+ were respelled away.
However, it is too prolix to use the color mapping method for visualizing the values of electrostatics and ionic concentrations over a three dimensional domain. Here, we introduce a simple method that allows us to plot the values of electrostatics and ionic concentrations over a volume subdomain in two-dimensional curves along the z-axis direction. Using this method, we construct a cylinder domain by the set
where r and ξ are the positive numbers, which are selected to be large enough such that the cylinder domain covers the channel pore portion. We then partition this cylinder domain into m portions by the partition numbers,
and calculate the points and for the electrostatic potential u and the concentration ci, respectively, by the formulas
| (31) |
where ∥·∥ is a vector norm, and Uj(f) denotes a set of the values of function f coming from the jth portion of the cylinder domain, that is,
Using these points, we can plot two-dimensional curves to visualize the values distributions of electrostatic potential and ionic concentrations within a 3D channel pore volume area along the z-axis. Since they are clear to view, these curves can be valuable in a comparison of the electrostatic potentials and ionic concentrations generated from different numerical tests.
Figure 9 displays the curves plotted by using the above method for the electrostatic potentials and ionic concentrations generated by our SMPBIC model for the hVDAC1 using the three salt solutions and the value of membrane surface charge density σ was set at 0 and 30. Here, we used
| (32) |
From Figure 9, it can be seen that the membrane charges have significant impact on the electrostatic potential and ionic concentrations. With Figure 9, we now can clearly see that there are much more anions than cations in the channel pore. These test results indicate that our SMPBIC model retains well the anion selectivity property of hVDAC1.
Discussion and Conclusions
We have developed a new SMPBIC model, and applied it to the calculation of electrostatic potential, ionic concentrations, and electrostatic solvation free energy for a VDAC 3D molecular structure[42] (hVDAC1; PBD ID 2JK4) on a biological membrane in a solution of up to five ionic species. In comparison to the current ion channel models, our SMPBIC model: (1) accounts for the effect of membrane charges via a membrane surface charge density, (2) adopts a natural Neumann boundary condition on the four side surfaces of a computational box domain to insure that no charges enter the box via these side surfaces, which partially mimics membrane environment, and (3) uses a reduced bulk solvent permittivity constant within the channel pore to reflect the fact that the channel pore has much less water than the bulk water region.
To overcome the theoretical and numerical complexities of our SMPBIC model, we split it into three submodels, referred to as models 1–3, such that the solution of the SMPBIC model is the sum of the solutions of these three submodels. This approach allowed us to avoid the singularity difficulties of our SMPBIC model caused by atomic point charges from an ion channel molecular structure. The solution of model 1 was obtained analytically, whereas models 2 and 3 were solved numerically using efficient finite element algorithms. As an important application of this submodel partitioning approach, we obtained two new formulas for computing the electrostatic solvation free energy by using the two reference states constructed by models 1 and 2 to reflect the influences of membrane charges and ionic solvent charges. Moreover, the numerical results were obtained for a human VDAC1 protein (PDB ID 2JK4) in terms of three salt solutions, each with up to five ionic species, and different membrane surface charge densities. These results demonstrate that our SMPBIC model retains the anion selection property of VDAC and show that the membrane charges have significant impacts on the electrostatic potential and ionic concentrations of a VDAC membrane system. Furthermore, these results demonstrate the importance of considering the membrane charges and ionic solvent charges in the calculation of electrostatic solvation free energy through using our new formulas.
According to a recent review article by Zeth and Zachariae,[47] there are three high-resolution 3D VDAC molecular structures available in the PDB website, which have been identified by NMR spectroscopy and X-ray crystallography.[42,48,49] Two of the structures are for native human VDAC isoform 1 (hVDAC1; PBD ID 2JK4 and 2K4T) and the third one is for a native murine VDAC isoform 1 (mVDAC1; PBD ID 3EMN). All three structures are in their open state conformation (i.e., maximal conducting state with zero membrane potential across the outer mitochondrial membrane, which is the most physiologically plausible condition for VDAC).
The ability of the three available VDAC molecular structures to distinguish between molecules of the same size and charge (e.g., ATP vs nonphysiological molecules of the same size and charge) has not been properly evaluated by any model. Choudhary et al.[50] studied the mechanism of ATP transport through VDAC based on molecular dynamics simulations using the published 3D mVDAC1 structural data.[49] However, their study is not amenable for quantitative understanding of protein electrostatics and simultaneous transport of multiple ionic species of variable ion sizes. Our proposed model is the first to address the continuum modeling of protein electrostatics of an ion channel on a biological membrane that allows the simultaneous transport of multiple ionic species with different ion sizes. We chose the published hVDAC1 structural data (PBD ID: 2JK4) as an application of our SMPBIC model. Based on this structure and open state conditions, our model is able to predict the anion selectivity of hVDAC1 in an ionic solvent containing many anions and cations (Figs. 7–9). However, our proposed model cannot distinguish between two ionic species of the same charge and size (e.g., ATP vs. nonphysiological molecules of the same size and charge) because all the ionic species in the model are treated as spherical bodies with different radii. To overcome this limitation, we need to combine our model with another approach, such as molecular dynamics or Brownian dynamics, which would enable us to account for the structural information of the ionic species (e.g., ATP). Although the hVDAC1 structure was chosen as an application of our model in this study, our model can be easily adapted to any current or future VDAC structures or any other ion channel structure.
References
- [1].Lemasters JJ, Holmuhamedov E, Biochim. Biophys. Acta (BBA) 2006, 1762, 181. [DOI] [PubMed] [Google Scholar]
- [2].Hodge T, Colombini M, J. Membr. Biol 1997, 157, 271. [DOI] [PubMed] [Google Scholar]
- [3].Rostovtseva TK, Bezrukov SM, Biophys. J 1998, 74, 2365. [DOI] [PMC free article] [PubMed] [Google Scholar]
- [4].Rostovtseva T, Colombini M, Biophys. J 1997, 72, 1954. [DOI] [PMC free article] [PubMed] [Google Scholar]
- [5].Colombini M, Biochim. Biophys. Acta (BBA) 2016, 1863, 2498. [DOI] [PubMed] [Google Scholar]
- [6].Colombini M, Biochim. Biophys. Acta (BBA) 2012, 1818, 1457. [DOI] [PMC free article] [PubMed] [Google Scholar]
- [7].Baines CP, Kaiser RA, Sheiko T, Craigen WJ, Molkentin JD, Nat. Cell Biol 2007, 9, 550. [DOI] [PMC free article] [PubMed] [Google Scholar]
- [8].Camara AK, Zhou Y, Tajkhorshid E, Kwok W-M, Front. Physiol 2017, 8, 1. [DOI] [PMC free article] [PubMed] [Google Scholar]
- [9].Das S, Steenbergen C, Murphy E, Biochim. Biophys. Acta (BBA) 2012, 1818, 1451. [DOI] [PMC free article] [PubMed] [Google Scholar]
- [10].McCommis KS, Baines CP, Biochim. Biophys. Acta (BBA) 2012, 1818, 1444. [DOI] [PMC free article] [PubMed] [Google Scholar]
- [11].Rostovtseva TK, Bezrukov SM, Biochim. Biophys. Acta (BBA) 2012, 1818, 1526. [DOI] [PMC free article] [PubMed] [Google Scholar]
- [12].Rostovtseva TK, Tan W, Colombini M, J. Bioenerg. Biomembr 2005, 37, 129. [DOI] [PubMed] [Google Scholar]
- [13].Shoshan-Barmatz V, De S, Meir A, Front. Oncol 2017, 7, 60. [DOI] [PMC free article] [PubMed] [Google Scholar]
- [14].Shoshan-Barmatz V, Ben-Hail D, Mitochondrion 2012, 12, 24. [DOI] [PubMed] [Google Scholar]
- [15].Shoshan-Barmatz V, De Pinto V, Zweckstetter M, Raviv Z, Keinan N, Arbel N, Mol. Aspects Med 2010, 31, 227. [DOI] [PubMed] [Google Scholar]
- [16].Shoshan-Barmatz V, Israelson A, Brdiczka D, Sheu S, Curr. Pharm. Des 2006, 12, 2249. [DOI] [PubMed] [Google Scholar]
- [17].Rocchia W, Alexov E, Honig B, J. Phys. Chem. B 2001, 105, 6507. [Google Scholar]
- [18].Davis ME, Madura JD, Luty BA, McCammon JA, Comput. Phys. Comm 1991, 62, 187. [Google Scholar]
- [19].Baker N, Sept D, Holst M, McCammon JA, IBM J Res. Dev 2001, 45, 427. [Google Scholar]
- [20].Baker NA, Methods Enzymol. 2004, 383, 94. [DOI] [PubMed] [Google Scholar]
- [21].Luo R, David L, Gilson MK, J. Comput. Chem 2002, 23, 1244. [DOI] [PubMed] [Google Scholar]
- [22].Wang C, Wang J, Cai Q, Li Z, Zhao H-K, Luo R, Comput. Theor. Chem 2013, 1024, 34. [DOI] [PMC free article] [PubMed] [Google Scholar]
- [23].Jo S, Vargyas M, Vasko-Szedlar J, Roux B, Im W, Nucl. Acids Res 2008, 36, W270. [DOI] [PMC free article] [PubMed] [Google Scholar]
- [24].Chen D, Chen Z, Chen C, Geng W, Wei G, J. Comput. Chem 2011, 32, 756. [DOI] [PMC free article] [PubMed] [Google Scholar]
- [25].Xie D, J. Comput. Phys 2014, 275, 294. [Google Scholar]
- [26].Jiang Y, Xie Y, Ying J, Xie D, Yu Z, Mol. Based Math. Biol 2015, 3, 179. [Google Scholar]
- [27].Lakshminarayanaiah N, Murayama K, J. Membr. Biol 1975, 23, 279. [DOI] [PubMed] [Google Scholar]
- [28].Heimburg T, Physical Properties of Biological Membranes. In Bohr G, Henrik, Eds. Handbook of Molecular Biophysics, Weinheim: Wiley-VCH, 2009, p. 593–616. [Google Scholar]
- [29].Roux B, Biophys. J 1997, 73, 2980. [DOI] [PMC free article] [PubMed] [Google Scholar]
- [30].Roux B, Biophys. J 2008, 95, 4205. [DOI] [PMC free article] [PubMed] [Google Scholar]
- [31].Grabe M, Lecar H, Jan YN, Jan LY, Proc. Natl. Acad. Sci. U. S. A 2004, 101, 17640. [DOI] [PMC free article] [PubMed] [Google Scholar]
- [32].Choudhary OP, Ujwal R, Kowallis W, Coalson R, Abramson J, Grabe M, J. Mol. Biol 2010, 396, 580. [DOI] [PMC free article] [PubMed] [Google Scholar]
- [33].Callenberg KM, Choudhary OP, de Forest GL, Gohara DW, Baker NA, Grabe M, PLoS One 2010, 5, e12722. [DOI] [PMC free article] [PubMed] [Google Scholar]
- [34].Corry B, Kuyucak S, Chung S-H, Biophys. J 2000, 78, 2364. [DOI] [PMC free article] [PubMed] [Google Scholar]
- [35].Maffeo C, Bhattacharya S, Yoo J, Wells D, Aksimentiev A, Chem. Rev 2012, 112, 6250. [DOI] [PMC free article] [PubMed] [Google Scholar]
- [36].Ji N, Liu T, Xu J, Shen L, Lu B, Int. J. Mol. Sci 2018, 19, 695. [DOI] [PMC free article] [PubMed] [Google Scholar]
- [37].Li B, Nonlinearity 2009, 22, 811. [Google Scholar]
- [38].Koehl P, Delarue M, J. Chem. Phys 2010, 132, 064101. [DOI] [PMC free article] [PubMed] [Google Scholar]
- [39].Koehl P, Orland H, Delarue M, Phys. Rev. Lett 2009, 102, 087801. [DOI] [PMC free article] [PubMed] [Google Scholar]
- [40].Koehl P, Poitevin F, Orland H, Delarue M, J. Theor. Comput. Chem 2014, 13, 1440001. [Google Scholar]
- [41].Xie D, Int. J. Numer. Anal. Model 2017, 14, 688. [Google Scholar]
- [42].Bayrhuber M, Meins T, Habeck M, Becker S, Giller K, Villinger S, Vonrhein C, Griesinger C, Zweckstetter M, Zeth K, Proc. Natl. Acad. Sci. U.S.A 2008, 105, 15370. [DOI] [PMC free article] [PubMed] [Google Scholar]
- [43].Xie Y, Ying J, Xie D, J. Comput. Chem 2017, 38, 541. [DOI] [PubMed] [Google Scholar]
- [44].Logg A, Mardal K-A, Wells GN, Eds., Automated Solution of Differential Equations by the Finite Element Method. Vol. 84 of Lecture Notes in Computational Science and Engineering, Berlin Heidelberg: Springer Verlag, 2012. [Google Scholar]
- [45].Chen M, Tu B, Lu B, J. Mol. Graph. Model 2012, 38, 411. [DOI] [PubMed] [Google Scholar]
- [46].Nightingale E Jr.., J. Phys. Chem 1959, 63, 1381. [Google Scholar]
- [47].Zeth K, Zachariae U, Front. Physiol 2018, 9, 108. [DOI] [PMC free article] [PubMed] [Google Scholar]
- [48].Hiller S, Garces RG, Malia TJ, Orekhov VY, Colombini M, Wagner G, Science 2008, 321, 1206. [DOI] [PMC free article] [PubMed] [Google Scholar]
- [49].Ujwal R, Cascio D, Colletier J-P, Faham S, Zhang J, Toro L, Ping P, Abramson J, Proc. Natl. Acad. Sci 2008, 105, 17742. [DOI] [PMC free article] [PubMed] [Google Scholar]
- [50].Choudhary OP, Paz A, Adelman JL, Colletier J-P, Abramson J, Grabe M, Nat. Struct. Mol. Biol 2014, 21, 626. [DOI] [PMC free article] [PubMed] [Google Scholar]


