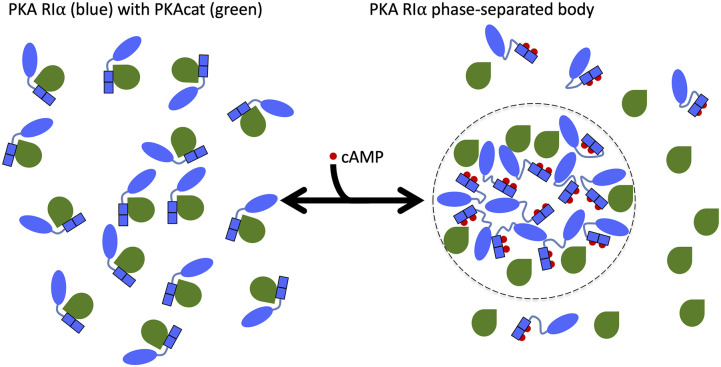
The ubiquitous small molecule cyclic adenosine monophosphate (cAMP) controls a diverse set of cellular processes by binding and regulating several enzymes such as protein kinase A (PKA). The PKA holoenzyme consists of a dimer of regulatory subunits and a pair of catalytic (PKAcat) subunits. Binding of cAMP to PKA regulatory subunits induces the release and activation of PKAcat. This binding event also increases the structural disorder of the type I regulatory subunit RIα.1 As liquid–liquid phase separation (LLPS) is driven, in part, by intrinsic disorder, the more disordered, cAMP-bound form of RIα more readily phase separates, while the more ordered, PKAcat-bound form of RIα resists phase separation2 (Fig. 1). By sequestering many cAMP molecules, RIα phase separation is a crucial driver for compartmentalizing cAMP; disruption of the phase-separated bodies leads to oncogenic effects. As RIα LLPS is intricately regulated by its binding partners, we aimed to explain these complex effects through computational modeling.
FIG. 1.
Illustration of the regulation of PKA RIα phase separation by different binding partners. Binding of two cAMP molecules (red) per RIα subunit (blue) leads to dissociation (and activation) of PKAcat (green). The increased disorder in the RIα linker region [between the N-terminal dimerization and docking (D/D) domain in oval and tandem cAMP-binding domains in rectangle] and the action of the dissociated PKAcat promote the formation of phase-separated bodies (highlighted on the right with a dotted boundary). In contrast, PKAcat in the absence of cAMP suppresses RIα phase separation by binding to and rigidifying RIα (shown on the left). For clarity, only a half of a holoenzyme, consisting of a single PKAcat subunit and a single RIα subunit, is illustrated.
Previously, Ghosh, Mazarakos, and Zhou3 reported a combined experimental and computational study to define three classes of macromolecular regulators: volume-exclusion promoters, weak-attraction suppressors, and strong-attraction promoters. Volume-exclusion regulators promote LLPS by taking up volume in the bulk phase and displacing the protein molecules undergoing LLPS to form liquid droplets. Weak-attraction regulators, on the other hand, suppress LLPS by being weakly attracted to the protein molecules undergoing LLPS and disrupting liquid droplet formation. Strong-attraction regulators (at low concentrations) promote LLPS by forming stronger attraction with the protein molecules undergoing LLPS inside liquid droplets. By comparing in vitro phase diagrams of RIα liquid droplet formation under various conditions shown in Ref. 2 with phase diagrams of the three macromolecular regulators shown in Ref. 3, we can categorize the different macromolecules into one of the three regulator classes. Polyethylene glycol (PEG) 4000, which was used to mimic cellular conditions for RIα in in vitro experiments and was shown to be necessary for liquid droplets to form, can be categorized as a volume-exclusion promoter. On the other hand, PKAcat in the presence of cAMP can be categorized as a strong-attraction promoter, and PKAcat bound to cAMP-free RIα can be categorized as a weak-attraction suppressor for RIα phase separation. Computationally, the phase diagrams in Ref. 3 were obtained on patchy particle models of the same size; it is thus difficult to use them for quantitative modeling of experimental systems.
To characterize the degree of attraction between different protein partners, here we developed a method called fast Fourier transform (FFT)-based Modeling of Atomistic Protein–protein interactions applied to cross second virial coefficient B23 (FMAPB23). FMAPB23 is an extension of FMAPB2,4–7 which calculates the second virial coefficient B2 for all-atom proteins in an implicit solvent. B2 is determined by the interaction energy between two molecules of the same protein, which includes steric, electrostatic, and non-polar components. Specifically, B2 is the integration of the Mayer f-function or e−βU(R,Ω,X) − 1,
| (1) |
where R denotes the relative position vector between the two molecules, Ω denotes three relative rotation angles, such as the Euler angles, X denotes internal degrees of freedom (in flexible molecules), U(R, Ω, X) denotes the intermolecular interaction energy, and . A potential of mean force (PMF) W(R) is obtained by averaging over all but the intermolecular distance R,
| (2) |
where θ and ϕ denote the polar and azimuthal angles of the relative position vector R. Note that from Eq. (1), it is apparent that repulsive interactions [i.e., positive U(R, Ω, X)] will make B2 more positive, whereas attractive interactions [i.e., negative U(R, Ω, X)] will make B2 more negative. The terms of the interaction energy are then expressed as correlation functions and calculated by using FFT. In comparison, B23 is determined by the interaction energy between two different protein molecules. The calculations of B2 and B23 are thus identical, except that the interaction energy is between two of the same kind of molecule for the former but between two different kinds of molecules for the latter. FMAPB2 has a scaling parameter (vs) for non-polar interactions that depends on protein molecular weight M (in kD). We took the geometrical mean of the molecular weights of the two protein molecules as M for calculating vs in FMAPB23.
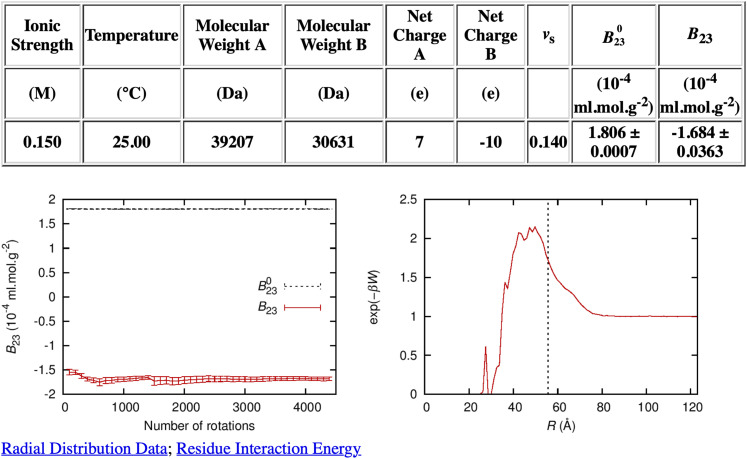
To use FMAPB23 in practice, the program requires as input the ionic strength, temperature, and structure files of the two protein molecules in the PQR format. The PQR files can be converted using PDB2PQR8 from structural files downloaded from the Protein Data Bank (PDB). The atomic partial charges for protein residues are from the PARSE set.9 The output from FMAPB23 is similar to that of FMAPB2, which includes B23, its steric component B230, and the PMF over distance R between the two protein molecules, as shown in Fig. 2. In calculating the steric component B230, the two protein molecules are assumed to only have steric repulsion, corresponding to an infinite interaction energy whenever any atom of one molecule clashes with any atom of the other molecule. As with FMAPB2,7 at low temperatures, B23 can be dominated by a few low energy configurations, potentially leading to significant errors. In addition, a grid spacing around 0.6 Å is necessary for discretization in FFT calculations in order to get converged energies, which limits how large the proteins can be for the available memory of a computer.
FIG. 2.
Output from the FMAPB23 server for PKAcat(Mg2+) (PDB: 6NO7 E) and RIα (PDB: 6NO7 H; with residues up to residue 104 truncated). Along with the calculated results for B230 and B23 presented in a table, the output includes plots of (left panel) the convergence of B23 as a function of the number of rotations of the probe molecule and (right panel) the radial distribution function. The two molecules are labeled as A and B; A is static, whereas B is rotated many times (as specified by “Number of rotations”) to evaluate the integration over Ω. Error bars represent standard deviations among the different rotations. The radial distribution function is the Boltzmann factor of the potential of mean force along the distance R between the two protein molecules. The vertical dashed line in the radial distribution function plot represents the contact distance of two spheres with the same B230 value as the two protein molecules. Links to the raw data for the radial distribution function and the residue interaction energy (“Radial Distribution Data” and “Residue Interaction Energy”) are also created on the output page.
The cross second virial coefficient B23 was calculated for Mg2+-bound PKAcat [denoted as PKAcat(Mg2+)] and cAMP-bound RIα [denoted as RIα(cAMP)]. Five structures for the first molecule were taken from PDB: 6NO7 chains E and G, 3O7L chain B, and 4NTT chains A and B; two structures for the second molecule were taken from 4MX3 chains A and B. The results from the total of ten runs were used to calculate a mean value and a standard error of the mean (see Table I). Note that Mg2+ was taken as an integral part of molecule 1, while cAMP was taken as an integral part of molecule 2. Partial charges for Mg2+ and cAMP were unavailable from the PARSE set. For Mg2+, we assumed a charge of +2 as a crude treatment; partial charges of cAMP were obtained from the R.E.D. Server.10 B23 was also calculated for the PKAcat(Mg2+)-RIα complex and cAMP-free RIα. The structures were from PDB: 6NO7, with chains EF or GH for molecule 1 and chains B, D, F, or H for molecule 2. We assume that PKAcat(Mg2+) is tightly bound to RIα in the absence of cAMP as experimental results indicate, and thus, we treat the entire complex as molecule 1. Finally, for sake of comparison, we calculated B23 for PKAcat(Mg2+) and cAMP-free RIα (see Fig. 2). The structures were the same as for the preceding set of calculations, except that molecule 1 only contained chain E or G. All RIα structures started at residue 105 to ensure a fair comparison across the different molecular pairs; the truncated residues, including the dimerization and docking (D/D) domain and part of the linker region, were not resolved in cAMP-bound RIα structures due to disorder.
TABLE I.
B23 results.
| Molecule no. 1 | Molecule no. 2 | B23/B230 |
|---|---|---|
| PKAcat(Mg2+)-RIα | RIα | −0.321 ± 0.038 |
| PKAcat(Mg2+) | RIα(cAMP) | −1.002 ± 0.029 |
| PKAcat(Mg2+) | RIα | −0.978 ± 0.031 |
To facilitate comparison across different molecular pairs, we normalized B23 by its steric component, B230. The latter is dictated by the molecular size. The mean of B23/B230 and standard error of the mean for each of the three molecular pairs described in the preceding paragraph are listed in Table I. All of the normalized B23 values are negative, with the PKAcat(Mg2+)-RIα complex and cAMP-free RIα pair having the least negative value, whereas the PKAcat(Mg2+) and RIα(cAMP) pair having the most negative value. This contrast matches with the PKAcat(Mg2+)-RIα complex in the absence of cAMP being a weak-attraction suppressor and PKAcat(Mg2+) in the presence of cAMP being a strong-attraction promoter for RIα phase separation. Specific binding with RIα prevents PKAcat(Mg2+) to form strong additional interaction with RIα, thus explaining why the PKAcat(Mg2+)-RIα complex is a weak-attraction suppressor of RIα phase separation. Indeed, as measured by B23/B230, nonspecific interactions of PKAcat(Mg2+) alone with RIα are almost as strong as with RIα(cAMP). Had we not considered the specific binding and hence not used the entire PKAcat(Mg2+)-RIα complex as molecule 1 in calculating B23 with RIα, we would have concluded PKAcat(Mg2+) to be a strong-attraction promoter for RIα LLPS, which would have contradicted with experimental results.
We can gain further insight into the effects of intermolecular interactions on LLPS by calculating the second virial coefficient B2 for each protein molecule using FMAPB2.7 B2 results were obtained for PKAcat(Mg2+) (6NO7 E, 6NO7 G, 3O7L B, 4NTT A, and 4NTT B), cAMP-free RIα (6BYR B, 6BYR D, 6BYS B, 6BYS D, 6BYS F, 6BYS H, 6NO7 B, 6NO7 D, 6NO7 F, and 6NO7 H), RIα(cAMP) (4MX3 A and 4MX3 B), and PKAcat(Mg2+)-RIα complex (6NO7 EF and 6NO7 GH). The mean and standard error of the mean for the normalized B2 value, i.e., B2/B20, calculated from the multiple input structures for each protein are listed in Table II. Several observations can be made by comparing the normalized B2 values against the normalized B23 values. First off, B2/B20 is slightly positive for the PKAcat(Mg2+)-RIα complex, whereas B2/B20 for either of the two subunits and B23/B230 between the subunits are negative. This contrast indicates that residues in the interface of the PKAcat(Mg2+)-RIα complex make major contributions to the self- and cross-attraction of the subunits, thus corroborating the above statement that ``specific binding with RIα prevents PKAcat(Mg2+) to form strong additional interaction with RIα.''. More importantly, it is the relative strengths between self- and cross-interactions that dictate the classification of regulator effects on LLPS.3 We propose that self- and cross-interactions are captured by B2/B20 and B23/B230, respectively. For the phase separation of RIα(cAMP) under regulation by PKAcat(Mg2+), the relevant B2/B20 [for RIα(cAMP)] is −0.480, whereas the relevant B23/B230 [between PKAcat(Mg2+) and RIα(cAMP)] is −1.002. The latter more negative value puts PKAcat(Mg2+) in the category of strong-attraction promoter. In contrast, for the phase separation of RIα under regulation by PKAcat(Mg2+)-RIα, the relevant B2/B20 (for RIα) is −0.467, whereas the relevant B23/B230 [between PKAcat(Mg2+)-RIα and RIα] is −0.321. The latter less negative value puts PKAcat(Mg2+)-RIα in the category of weak-attraction suppressor.
TABLE II.
B2 results.
| Molecule | B2/B20 | ||
|---|---|---|---|
| PKAcat(Mg2+) | −0.583 ± 0.127 | ||
| RIα | −0.467 ± 0.038 | ||
| RIα(cAMP) | −0.480 ± 0.143 | ||
| PKAcat(Mg2+)-RIα | 0.078 ± 0.011 |
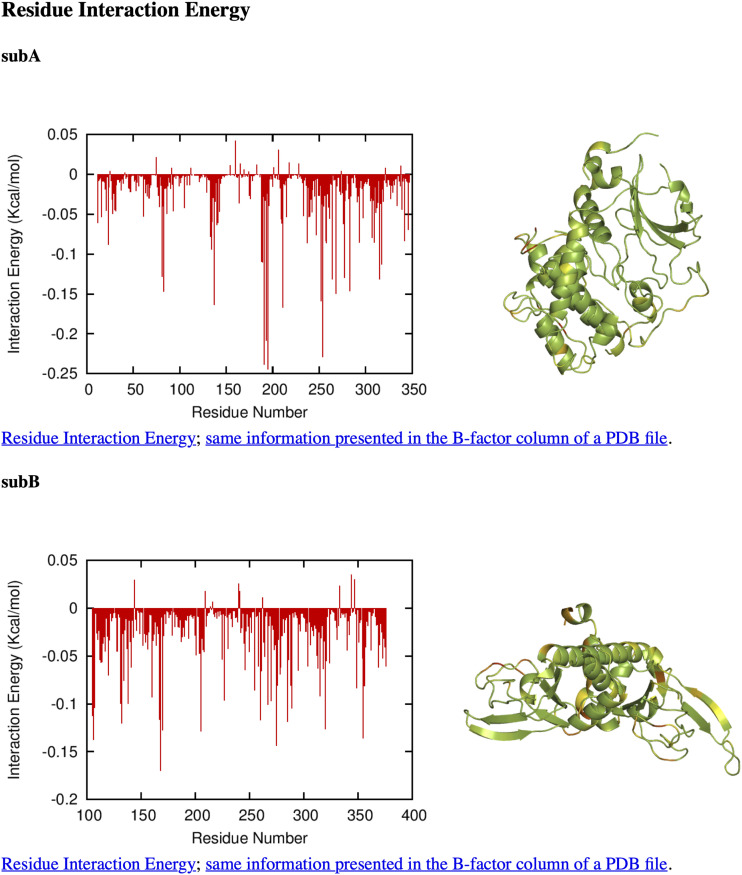
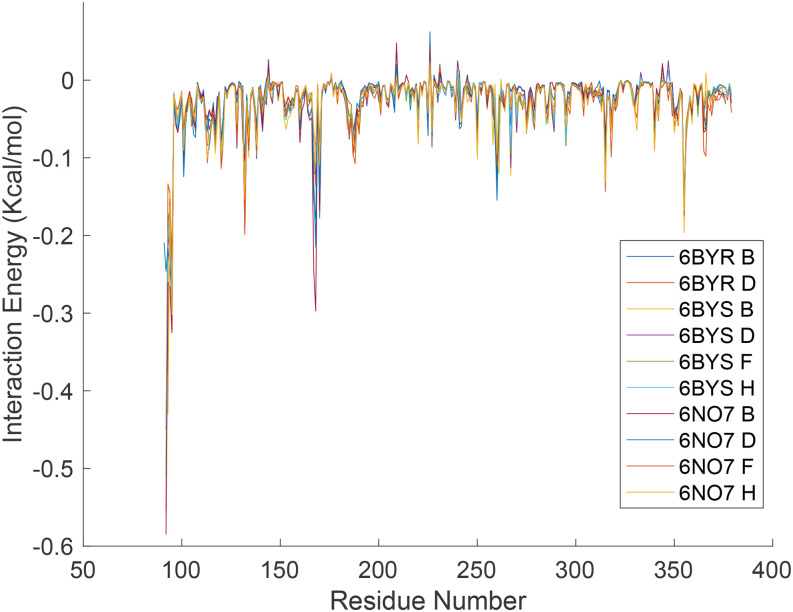
In addition to the final B23, the intermediate results of FMAPB23 can also be used to determine residue-level decomposition of interaction energies. From the billions of intermolecular poses sampled in a typical FMAPB23 calculation, we collected the 1000 configurations with the lowest intermolecular interaction energies. The contributions of individual residues to the interaction energies were then averaged over the 1000 selected poses. The results are illustrated in Fig. 3 for the cross-interaction between PKAcat(Mg2+) and cAMP-free RIα. Confirming the foregoing conclusion that residues in the interface of the PKAcat(Mg2+)-RIα complex make major contributions to the cross attraction of the subunits, four of the top five PKAcat(Mg2+) contributors (Lys192, Arg194, Trp196, and Lys213) and three of the top five RIα contributors (Glu168, Tyr205, and Arg355) are interface residues. The residue-level contributions to the self-interaction energy of cAMP-free RIα are shown in Fig. 4. This time, all of the experimentally resolved residues in cAMP-free RIα are used (6BYR B, 6BYR D, 6BYS B, 6BYS D, 6BYS F, 6BYS H, 6NO7 B, 6NO7 D, 6NO7 F, and 6NO7 H), including the linker residues before residue 105. Note that disorder-prone residues in the linker region make the greatest contributions to the RIα self-interaction energy, even more than the other interface residues (Lys132, Glu168, Trp260, and Arg355). This linker region was indeed found to be important for RIα LLPS.2
FIG. 3.
Residue interaction energy output from FMAPB23 for PKAcat(Mg2+) (6NO7 E; subA) and cAMP-free RIα (6NO7 H with residues truncated up to residue 104; subB). The results are plotted as a bar graph and also displayed on a structure, with green, yellow, and red showing small, medium, and large contributions, respectively. Links to the raw data (“Residue Interaction Energy” and “same information presented in the B-factor column of a PDB file”) are also created on the output page.
FIG. 4.
Residue-level decomposition of the self-interaction energy for PKA RIα. The legend indicates the PDB files used as input.
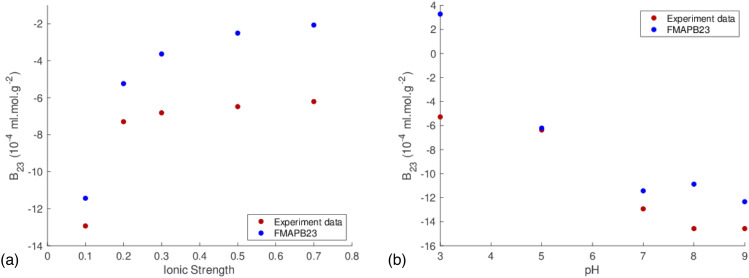
Finally, B23 calculated by FMAPB23 can be directly compared against experimental measurements. The calculated results for the bovine serum albumin (BSA)–lysozyme pair at different ionic strengths and at different pHs are shown in Figs. 5(a) and 5(b), respectively, along with the corresponding experimental data.11 Although the calculated and experimental values do not match up exactly, the trends do match up quite well. These results showcase the utility of the FMAPB23 program to study protein–protein nonspecific interactions. Importantly, our results suggest that interaction energies between RIα and PKAcat, in the presence and absence of cAMP, can explain the unique properties of RIα LLPS. Overall, this study demonstrates how computational modeling can give insight into complex protein assemblies, such as phase-separated protein droplets.
FIG. 5.
Calculated B23 values by FMAPB23 vs experimental data for the BSA–lysozyme system. (a) B23 values at different ionic strengths (NaCl concentrations in M), 25 °C, and pH 7.0. (b) B23 values at different pHs, 25 °C, and 0.1 M NaCl concentration.
FMAPB23 is available as a web server at http://pipe.rcc.fsu.edu/fmapb23, and FMAPB2 is available as a web server at http://pipe.rcc.fsu.edu/fmapb2.
S.-H.A. and S.Q. contributed equally to this work.
Acknowledgments
This work was supported by National Institutes Grant Nos. GM31749 (to J.A.M.) and GM118091 (to H.-X.Z.). The computation was performed on the clusters at the Research Computing Center of Florida State University.
DATA AVAILABILITY
The data that support the findings of this study are available from the corresponding author upon reasonable request.
REFERENCES
- 1.Kim C., Xuong N.-H., and Taylor S. S., “Crystal structure of a complex between the catalytic and regulatory (RIα) subunits of PKA,” Science 307, 690–696 (2005). 10.1126/science.1104607 [DOI] [PubMed] [Google Scholar]
- 2.Zhang J. Z., Lu T.-W., Stolerman L. M., Tenner B., Yang J. R., Zhang J.-F., Falcke M., Rangamani P., Taylor S. S., Mehta S. et al. , “Phase separation of a PKA regulatory subunit controls cAMP compartmentation and oncogenic signaling,” Cell 182, 1531–1544 (2020). 10.1016/j.cell.2020.07.043 [DOI] [PMC free article] [PubMed] [Google Scholar]
- 3.Ghosh A., Mazarakos K., and Zhou H.-X., “Three archetypical classes of macromolecular regulators of protein liquid–liquid phase separation,” Proc. Natl. Acad. Sci. U. S. A. 116, 19474–19483 (2019). 10.1073/pnas.1907849116 [DOI] [PMC free article] [PubMed] [Google Scholar]
- 4.Qin S. and Zhou H.-X., “FFT-based method for modeling protein folding and binding under crowding: Benchmarking on ellipsoidal and all-atom crowders,” J. Chem. Theory Comput. 9, 4633–4643 (2013). 10.1021/ct4005195 [DOI] [PMC free article] [PubMed] [Google Scholar]
- 5.Qin S. and Zhou H.-X., “Further development of the FFT-based method for atomistic modeling of protein folding and binding under crowding: Optimization of accuracy and speed,” J. Chem. Theory Comput. 10, 2824–2835 (2014). 10.1021/ct5001878 [DOI] [PMC free article] [PubMed] [Google Scholar]
- 6.Qin S. and Zhou H.-X., “Fast method for computing chemical potentials and liquid–liquid phase equilibria of macromolecular solutions,” J. Phys. Chem. B 120, 8164–8174 (2016). 10.1021/acs.jpcb.6b01607 [DOI] [PMC free article] [PubMed] [Google Scholar]
- 7.Qin S. and Zhou H.-X., “Calculation of second virial coefficients of atomistic proteins using fast Fourier transform,” J. Phys. Chem. B 123, 8203–8215 (2019). 10.1021/acs.jpcb.9b06808 [DOI] [PMC free article] [PubMed] [Google Scholar]
- 8.Dolinsky T. J., Nielsen J. E., McCammon J. A., and Baker N. A., “PDB2PQR: An automated pipeline for the setup of Poisson–Boltzmann electrostatics calculations,” Nucleic Acids Res. 32, W665–W667 (2004). 10.1093/nar/gkh381 [DOI] [PMC free article] [PubMed] [Google Scholar]
- 9.Sitkoff D., Sharp K. A., and Honig B., “Accurate calculation of hydration free energies using macroscopic solvent models,” J. Phys. Chem. 98, 1978–1988 (1994). 10.1021/j100058a043 [DOI] [Google Scholar]
- 10.Vanquelef E., Simon S., Marquant G., Garcia E., Klimerak G., Delepine J. C., Cieplak P., and Dupradeau F.-Y., “R.E.D. Server: A web service for deriving RESP and ESP charges and building force field libraries for new molecules and molecular fragments,” Nucleic Acids Res. 39, W511–W517 (2011). 10.1093/nar/gkr288 [DOI] [PMC free article] [PubMed] [Google Scholar]
- 11.Choi S. H. and Bae Y. C., “Osmotic cross second virial coefficient (B23) of unfavorable proteins: Modified Lennard-Jones potential,” Macromol. Res. 17, 763–769 (2009). 10.1007/bf03218612 [DOI] [Google Scholar]
Associated Data
This section collects any data citations, data availability statements, or supplementary materials included in this article.
Data Availability Statement
The data that support the findings of this study are available from the corresponding author upon reasonable request.


