Abstract
Multiple source apportionment approaches were employed to investigate PAH sources which contribute to small craft harbor (SCH) sediments in Nova Scotia (NS), Canada. A total of 580 sediment samples were analyzed using PAH diagnostic ratios, Unmix Optimum receptor modeling, and by assessment of the composition of the PAH profile. PAH diagnostic ratios suggest PAHs are primarily of pyrogenic (thermal) origin, while UnmixO modeling identifies four individual sources which best describe surficial sediments and suggests contributions from both pyrogenic and petrogenic origins. These include coal combustion, automobile exhaust, and biomass incineration. PAH profile assessment determined an overwhelming contribution of high molecular weight PAHs, which exhibited a strong correlation with total PAH concentrations.
Keywords: Polycyclic aromatic hydrocarbons (PAHs), Small craft harbor (SCH) sediments, Source apportionment, Multivariate Receptor Modeling, Unmix Optimum, PAH diagnostic ratios
Graphical Abstract
1. Introduction
Polycyclic aromatic hydrocarbons (PAHs) are pollutants observed in aquatic, terrestrial, and atmospheric environments around the world. PAHs are considered priority pollutants as they demonstrate carcinogenic and mutagenic properties and have shown to have subsequent adverse effects on organisms in a wide range of studies (Fang et al., 2012; Stout et al., 2015). PAHs enter the environment from a variety of different sources including pyrogenic, petrogenic, and natural sources (Lima et al., 2005; Jiang et al., 2009). Pyrogenic PAH sources are characterized by high temperature combustion and/or pyrolysis of fossil fuels or organic matter, which release PAHs into the atmosphere through exhaust and soot (Masood et al., 2016). PAHs released from high temperature processes tend to be of high molecular weight and have increased persistence in the environment (4–6 aromatic rings) (Smith et al., 2009; Mostert et al., 2010). PAHs of petrogenic origin are formed from petroleum (crude and refined) and occur due to direct inputs from accidental spills, petroleum combustion, discharges, terrestrial run off, and by natural petroleum seeps (Masood et al., 2016). Petrogenic PAHs (produced by lower temperature processes) tend to be of lower molecular weight (2–3 aromatic rings) (Mostert et al., 2010). Forest fires, diagenesis, and natural petroleum seeps can also contribute PAHs to the environment, and are classified as natural sources (Wang et al., 2007; Mahanty et al., 2011). PAHs primarily enter the environment by initial release into the atmosphere from incomplete combustion processes and then subsequently enter soil, sediments, and water bodies from various processes including fluvial, overland, nonpoint, groundwater, and other hydrogeological processes (Stout & Emsbo-Mattingly, 2008). The anthropogenic reliance and historical use of fossil fuels has contributed to PAHs in the environment globally (Stout et al., 2004; Zemo, 2009). From an ecological risk perspective, petrogenic PAHs may be more readily bioavailable in aquatic environments as compared to pyrogenic PAHs (Thorsen et al., 2004). Pyrogenic PAHs are often less bioavailable given their ability to settle more rapidly into sediment and sorb to sediment particles (Koelmans et al., 2006; Chen & Chen, 2011).
Source apportionment of PAHs in the environment has been well studied over the last 40 years (Tobiszewski & Namieśnik, 2012; Nádudvari et al., 2018). PAH sources which most readily contribute to sediments include coal tar, and/or wood, coal, or petroleum combustion sources (Abdel-Shafy & Mansour, 2016). As such, understanding specific contributing PAH sources to sediments is of importance for environmental management. However, the assessment of sedimentary PAH sources presents challenges for typical source apportionment approaches. PAHs often undergo physical or chemical changes (Neff et al., 2005) from their emission (source) to sediment (receptor) which can cause discrepancies between comparison of observed and known PAH profiles (Norris & Henry, 2019). Furthermore, sediment data is often formed by few samples, spanning varying temporal periods. This may average contaminant concentrations over time, further increasing the potential for discrepancies between observed and known PAH source profiles (Uchimiya & Masunaga, 2007; Uchimiya et al., 2007; Norris & Henry, 2019). A new receptor model, Unmix Optimum (UnmixO), developed by the US EPA, demonstrates increased applicability for addressing PAHs in sediment as compared to other source apportionment modelling tools by accounting for the above challenges (Norris & Henry, 2019). Many methodologies exist that can be applied in sediment PAH source apportionment estimations, which are often applied concurrently to strengthen source estimations by means of corroborative evidence (Stout & Graan, 2010).
To date, a spatially summarized analysis of PAH source apportionment has yet to be completed for surficial sediments in Nova Scotia (NS). Harbor managers of NS SCHs have little insight to sources impacting sediments, which may have associated environmental or financial liabilities. Therefore, this study aims to characterize PAH sources from sediments collected from 31 NS SCHs between 2001–2017, by implementing multiple lines of evidence. The three lines of evidence used in support of this investigation include: PAH diagnostic ratios, UnmixO receptor modeling, and PAH compositional analysis. This study aims to provide harbor decision makers in NS with information that supports the maintenance and prioritization of SCH sites, particularly in regard to source control of contaminants. Similarly, this study builds on earlier PAH characterization completed at these SCHs (Davis et al., 2018).
2. Materials and Methods
2.1. Study area
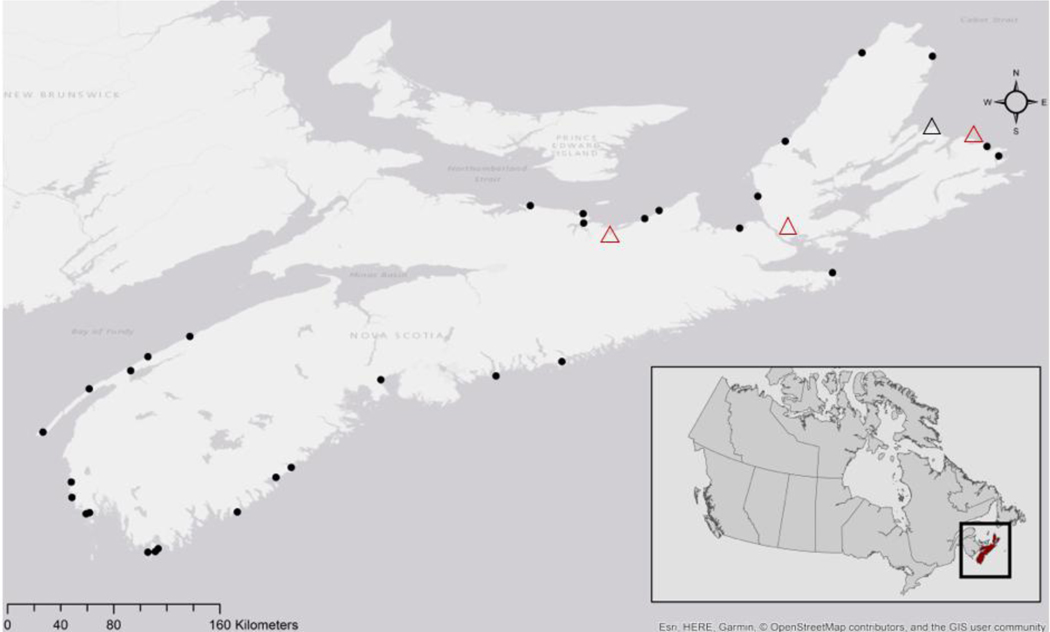
Sediments assessed in this study were retrieved from 31 SCHs across the coastal province of NS, Canada. The 31 SCHs were distributed across the gulf (n=9), eastern (n=6), and southwestern (n=16) management regions in NS, as defined by the Department of Fisheries and Oceans (DFO). The spatial distribution of these SCHs is outlined in Fig 1.
Fig. 1.
Spatial distribution of selected 31 small craft harbor sites across Nova Scotia, Canada. Harbors are represented as black dots, and triangles represent the approximate locations of four Nova Scotia Power coal and/or pet coke power generation stations. The black triangle represents Point Aconi, the only thermal power generating station that uses pet coke, while all other stations use coal (red) [Adapted from Davis et al. (2018)].
2.2. Sediment data
PAH information was assessed by secondary analysis of sediment data for 31 individual SCHs in NS, Canada. The 16 PAH compounds assessed as part of this study are species classified as priority pollutants by the United States Environmental Protection Agency (US EPA, 2014). Sediment data was kindly provided by the Canadian federal government (Department of Fisheries and Oceans Small Craft Harbour Branch (DFO SCH) and Public Services and Procurement Canada (PSPC)) and encompassed federally mandated sediment sampling reports between 2001–2017. Surficial sediment sampling (0–10 cm) was primarily conducted as part of the federal Marine Sediment Sampling Program prior to dredging activities at all sites. The term “sediment” will refer to those collected at the depth of 0–10cm throughout this study. The 31 SCHs were sampled at varying intervals during the temporal period. Most samples included surficial sediments and all samples were analyzed by Standards Council of Canada accredited commercial laboratories. SCHs in this study (n=31) are classified as core fishing harbors by DFO SCH. Further details regarding SCH selection, geographical location of specific SCHs, and the physicochemical characteristics of sediments analyzed is described in previous work by Davis et al. (2018).
2.3. PAH diagnostic ratios
PAH diagnostic ratios are a common source apportionment approach to PAHs, and PAH isomeric pairs (e.g., PAH species with the same atomic structure; fluoranthene and pyrene) as these pairs are expected to weather similarly in the environment (Tobiszewski & Namieśnik, 2012; Wise et al., 2015).
Diagnostic ratios seek to distinguish between pyrogenic and petrogenic sources of PAHs, but their application can be limited in further distinguishing between specific pyrogenic or petrogenic sources because of the potential for overlap among ratios (Stout et al., 2004; Galarneau, 2008). Caution should be applied in using diagnostic ratios because of the similarities observed between sources, especially those which are pyrogenic (Galarneau, 2008). The use of diagnostic ratios to estimating PAH sources has been debated in the literature and faces criticism (see Zhang et al., 2005; Galarneau, 2008; Katsoyiannis et al., 2011; Katsoyiannis & Breivik, 2014). Specifically, the concepts of PAH integrity in the environment, inadequacy of ratio estimations to known sources, spatial influence on ratio accuracy, PAH transport effects, PAH source mixing in the environment, and PAH source variability in the environment, all represent topics of concern. Despite this, ratios are widely used and applied in various environments for source apportionment estimations of PAHs (Dickhut et al., 2000; Yunker et al., 2002; Tobiszewski & Namieśnik; 2012). As such, diagnostic ratios are carefully and critically applied in this study alongside two other lines of evidence to support source apportionment estimations that rely on both qualitative and quantitative lines of evidence. Only sediment samples which demonstrated detectable concentrations of PAH species were included in ratio applications.
The following diagnostic ratios were applied and interpreted by transitional values, i.e. values which indicate possible sources, from the greater literature:
Mass 178: Anthracene/(Anthracene + Phenanthrene)
Mass 202: Fluoranthene/(Fluoranthene + Pyrene)
Mass 228: Benzo[a]anthracene/(Benzo[a]anthracene + Chrysene)
Mass 276: Indeno[1,2,3-cd] pyrene/(Indeno[1,2,3-cd] pyrene + Benzo[g,h,i] perylene)
∑LMW/∑HMW PAHs
2.4. Unmix modeling
Unmix is a multivariate receptor model developed by the US EPA that determines source apportionment of contaminants by factor analysis. Specifically, Unmix uses principal component analysis (PCA) to reduce the dimensions of the data and identify factors (sources) which best fit the data (Henry, 2003; Watson et al., 2008). Unmix looks for all possible edges produced from the data and uses the identification of an edge (hyperplane) to suggest a contribution from factors identified from the model algorithm (Henry, 1997, 2003; Watson et al., 2008). Unmix can be used without previous understanding of specific sources impacting the data (Larsen & Baker, 2003).
2.4.1. Unmix Optimum modeling
Unmix Optimum (UnmixO) is an advanced, new application of Unmix. UnmixO seeks to identify sources by using constrained non-linear optimization algorithms to refine the area (or volume) formed by vertices (factors).
UnmixO was applied in this study as it demonstrates increased applicability for NS sediment data by specifically accounting for a dataset with few high values and many values below detection, and by not requiring known source PAH profiles for analysis. These benefits were amplified during an exercise in which UnmixO was compared to Positive Matrix Factorization (PMF) and Principal Component Analysis (PCA) with the current sediment dataset. The results of this comparison are as follows:
PMF results did not show a sharper contrast between sources. UnmixO fit high PAH values better than PMF, which is important as few data contain high PAH values. The UnmixO solution is developed primarily on the higher points which minimizes the impact of having a large number of values below detection in a dataset, which occurs in the applied dataset.
The UnmixO Chi-sum calculation includes uncertainty while USGS has found the PMF uncertainties are high and cannot be used in the Chi-Sum calculation. This is an important consideration in comparing observed profiles to known source profiles.
Factor analysis (PCA with varimax rotation) identified only 3 factors with interpretable loadings compared the 4 sources identified by UnmixO. UnmixO results were reported in this paper since the factor scores have significant negative values and the estimates for PCA/MLR are semi-quantitative (Mar et al., 2005).
UnmixO was applied to NS SCH sediment data by use of an optimized interior point algorithm (Norris & Henry, 2019). A loose tolerance level (constraint level 1.1) was used and an error level of 15% was used in this model application by a Monte Carlo method (Timmerman et al., 2007).
A total number of 509 observations were used in the model, with 14 individual PAHs included as variables. The 14 species were: acenaphthene (Ace), anthracene (Ant), Benzo[a] anthracene (BaA), benzo[a]pyrene, benzo[b]fluoranthene (BbF), benzo[k]fluoranthene (BkF), benzo[g,h,i]perylene (BghiP), chrysene (Chr), fluoranthene (Flu), fluorene (Fl), indeno[1,2,3-cd] pyrene (IP), phenanthrene (Phe), pyrene (Pyr). 1 and 2- methylnaphthalene (1-MN and 2-MN) and perylene (Per) were excluded from the model due to a high number of missing data points among samples. Acenaphthylene (Acy), dibenz[a,h)]anthracene (DBahA) and naphthalene (Nap) were excluded as they provided outliers that degraded the fit of the model. Further details regarding the UnmixO analysis procedure are detailed in Norris & Henry (2019).
Sources identified by the Unmix Optimum model were further investigated by the following approaches:
Consideration of fractional and percent source composition of individual PAHs within UnmixO sources as compared to the literature (Table 1).
The calculation of the normalized square difference and Chi2 sum of each UnmixO source as a comparison to 22 source profiles from the literature (see Van Metre & Mahler, 2014). A lower calculated Chi2 sum indicates increased similarity/closeness between profiles (Van Metre & Mahler, 2014).
Table 1.
Percentage of total PAH (TPAH) and individual PAH species in each UnmixO factor (source).
| Factor 1 | Factor 2 | Factor 3 | Factor 4 | |||||
|---|---|---|---|---|---|---|---|---|
| Compound(s) | Composition | % | Composition | % | Composition | % | Composition | % |
| TPAH | 1.67 | 1.7 | 2.43 | 2.4 | 0.588 | 0.6 | 0.521 | 0.5 |
| Acenaphthene | 0.00205 | 0.1 | 0.00332 | 0.1 | 0.000661 | 0.1 | 0.0696 | 13.4 |
| Anthracene | 0.0025 | 0.1 | 0.0133 | 0.5 | 0.224 | 38.1 | 0.000479 | 0.1 |
| Benzo[a]anthracene | 0.179 | 10.7 | 0.23 | 9.5 | 0.00141 | 0.2 | 0.00711 | 1.4 |
| Benzo[a]pyrene | 0.247 | 14.8 | 0.0642 | 2.6 | 0.00151 | 0.3 | 0.00581 | 1.1 |
| Benzo[b]fluoranthene | 0.246 | 14.7 | 0.0531 | 2.2 | 0.00895 | 1.5 | 0.0102 | 2.0 |
| Benzo[g,h,i]perylene | 0.128 | 7.7 | 0.00171 | 0.1 | 0.00636 | 1.1 | 0.00508 | 1.0 |
| Benzo[k]fluoranthene | 0.231 | 13.8 | 0.00327 | 0.1 | 0.0237 | 4.0 | 0.00373 | 0.7 |
| Chrysene | 0.342 | 20.5 | 0.139 | 5.7 | 0.0197 | 3.4 | 0.0173 | 3.3 |
| Fluoranthene | 0.00434 | 0.3 | 1.13 | 46.5 | 0.00806 | 1.4 | 0.00124 | 0.2 |
| Fluorene | 0.00312 | 0.2 | 0.0018 | 0.1 | 0.0353 | 6.0 | 0.061 | 11.7 |
| Indeno[1,2,3-cd]pyrene | 0.119 | 7.1 | 0.028 | 1.2 | 0.00361 | 0.6 | 0.000188 | 0.0 |
| Phenanthrene | 0.0109 | 0.7 | 0.0129 | 0.5 | 0.212 | 36.1 | 0.163 | 31.3 |
| Pyrene | 0.0356 | 2.1 | 0.693 | 28.5 | 0.0339 | 5.8 | 0.0282 | 5.4 |
2.5. PAH Profile Composition Assessment
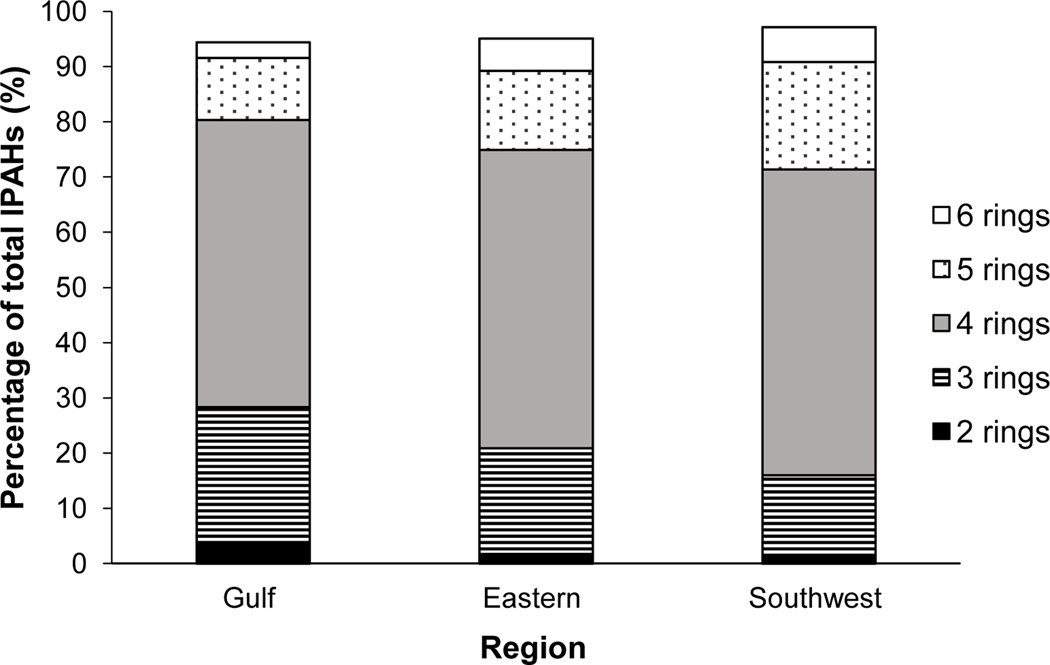
Sediments were assessed by reviewing the proportions of PAHs within samples that are present as part of the entire PAH profile. The PAH profile represents the collective PAHs assessed in NS sediments (19 PAHs typically). Organizing the PAH profile into defining characteristics can support source apportionment estimations as different individual PAHs, or groups of PAHs (e.g., 4-ring PAHs), can indicate emission sources. The number of atomic rings, molecular weight, classification of low molecular weight (LMW) or high molecular weight (HMW), and whether a PAH is deemed to be associated with “combustion” processes are all examples of defining characteristics. The number of atomic rings a PAH possesses, and whether a PAH is associated with combustion source, are the two characteristics assessed in this study.
Samples were summarized within the regions of NS (gulf, eastern, southwest) to determine the distribution of PAHs, as per their number of atomic rings. Raw PAH concentration data was used to calculate the total weight (mg/kg dry weight) of each atomic ring category (2–6 rings). The proportion of PAHs in each atomic ring category were calculated as a percent of the total PAHs present across all samples in the region. US EPA 16 priority PAHs were assessed and categorized.
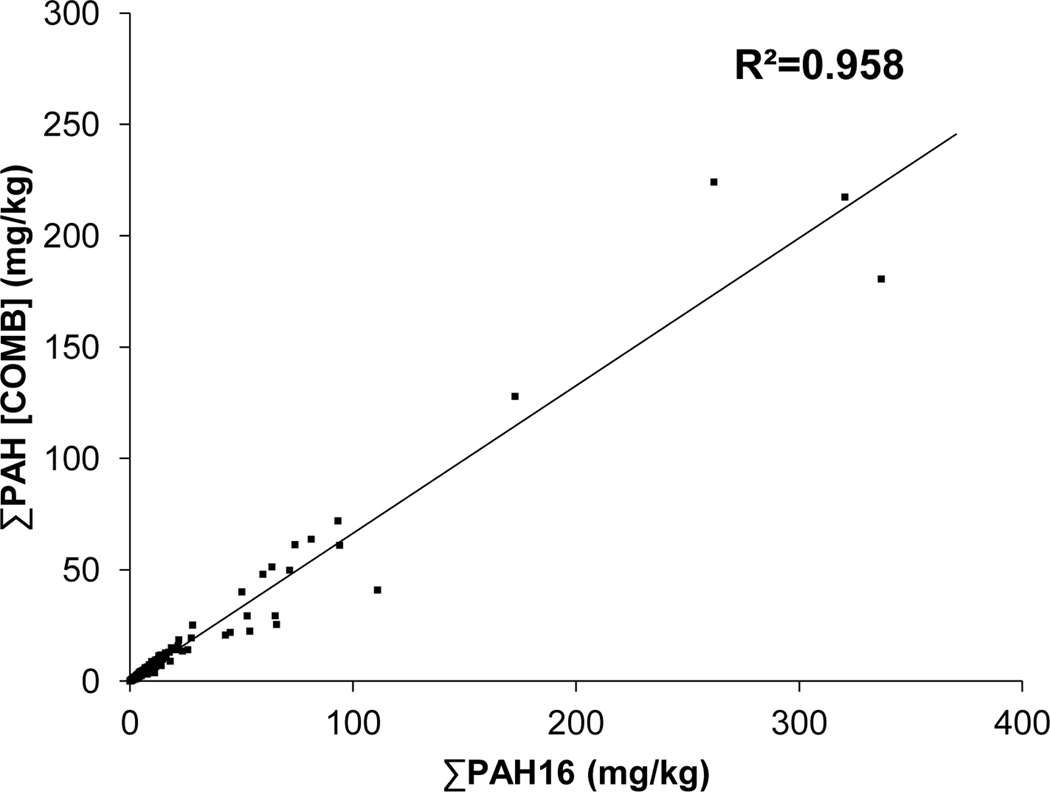
Similarly, the concentration of known combustion PAHs (∑Comb PAHs) was calculated by summing the amount of [Flu, Pyr, BaA, BbF, BkF, BaP, DBahA, BghiP] in all individual samples (across all 31 harbors). To investigate the relationship between ∑Comb PAHs and ∑PAH16, Pearson correlation analysis was conducted in Minitab Statistical Software® (Minitab Inc, State College, PA, 2010). In accompaniment to the above approaches, individual PAHs were assessed through comparison to the greater literature in support of source apportionment.
3. Results and discussion
3.1. Source apportionment using PAH diagnostic ratios
Four PAH diagnostic ratios were applied to distinguish between pyrogenic and petrogenic PAH sources. Ranges used to interpret the calculated mean ratio values for NS SCH sediments were derived from the expansive study completed by Yunker et al. (2002) in the Fraser River region of British Columbia, Canada, and from research completed by Dickhut et al. (2000) in Chesapeake Bay, US.
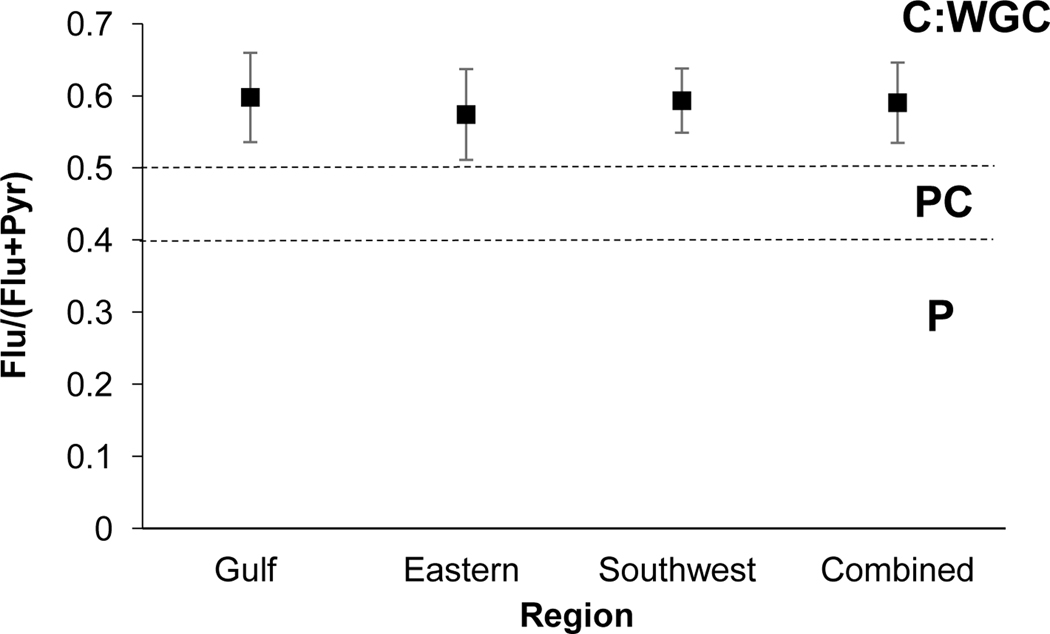
The Flu/(Flu+Pyr) ratio provides insight to petroleum, petroleum combustion, and combustion sources. Ratio values < 0.4 indicate petrogenic sourcing, values between 0.4–0.5 are indicative of petroleum combustion, while values >0.5 suggest wood, grass, and/or coal combustion (Yunker et al., 2002). An overwhelming grass, wood and coal combustion signature was identified as all regions and the combined sediments reflected mean ratio values above the combustion value of 0.5 (Fig 2). Mean ratio values among regions ranged between 0.57–0.59. This range of values aligns closely with the regional ratio values determined by Yunker et al. (2002) in the Fraser River system, which were in the range of 0.53–0.56. Mass 202 PAHs (Flu and Pyr) are common from biomass-focused fire events (Masclet et al., 1995; Jenkins et al., 1996; Oanh et al., 1999; Fine et al., 2001; Schauer et al., 2001). Similarly, both Flu and Pyr are commonly observed from sediments in remote locations and from extracted sediments dated to pre-industrial times (Yunker et al., 1999; 2000).
Fig. 2.
PAH diagnostic ratio plot of Flu/(Flu+ Pyr). Standard deviation of the mean is presented. n=116, 83, 162, and 361 for the Gulf, Eastern, Southwest and Combined regions, respectively. C: Combustion; WGC: Wood, grass, coal; PC: Petroleum Combustion; P: Petroleum.
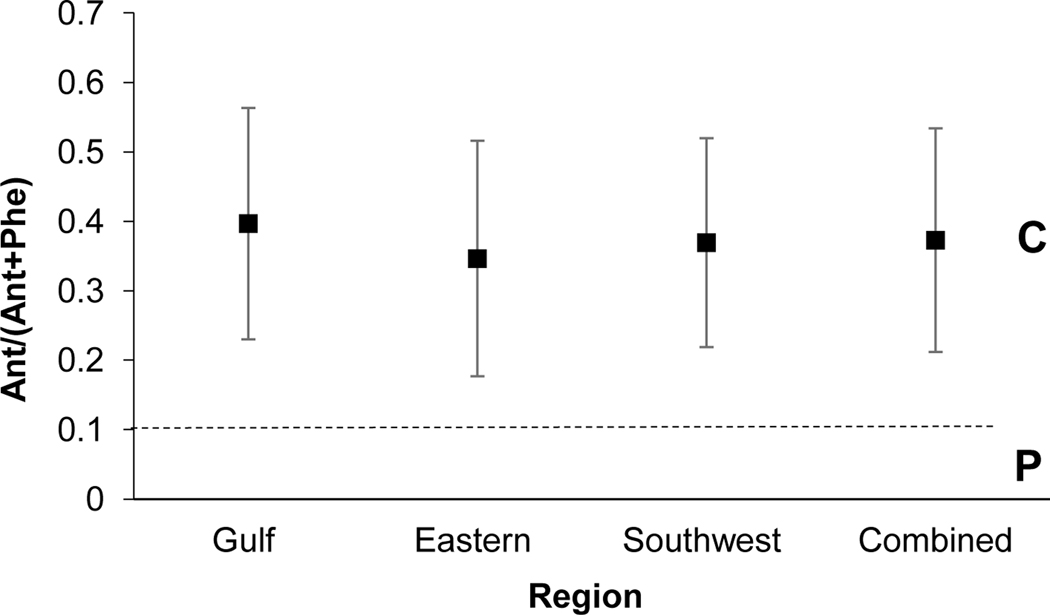
The Ant/(Ant+Phe) ratio distinguishes between petrogenic and combustion sources, as values <0.1 indicate petrogenic and those > 0.1 indicate combustion (Yunker et al., 2002). Values among regions ranged from 0.34 to 0.39 for this ratio, all in agreement of combustion sources (Fig 3). Yunker et al. (2002) suggest that ratio values for Ant/(Ant+Phe) are expected to be higher in urban areas, with remote areas likely to demonstrate values below or close to 0.1. The values presented for NS SCHs exceed those determined by Yunker et al. (2002) for Vancouver Harbor, which reflected ratio values of 0.26 (+/− 0.01), and the Fraser River, which demonstrated values of 0.17 (+/− 0.01). Interestingly, the Flu/(Flu+Pyr) and Ant/(Ant+Phe) ratios appear to be related, as values > 0.4 for Flu/(Flu+Pyr) are often accompanied by values >0.1 for Ant/(Ant+Phe). This relationship is supported by values presented in this study.
Fig. 3.
PAH diagnostic ratio plot of Ant/(Ant+Phe). Standard deviation of the mean is presented. n=116, 83, 162, and 361 for the Gulf, Eastern, Southwest and Combined regions, respectively. C: Combustion; P: Petroleum.
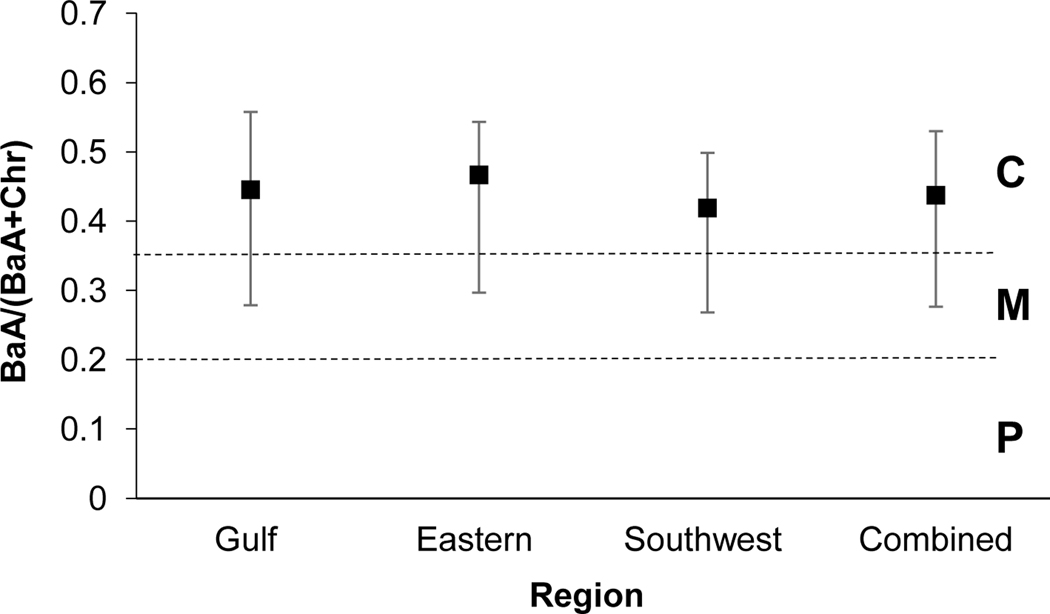
The BaA/(BaA+Chr) ratio provides insight to petrogenic and combustion (pyrogenic) sources and includes a range for mixed sourcing. Values <0.2 indicate petrogenic sourcing, values between 0.2 and 0.35 indicate mixed sourcing, while values >0.35 are indicative of combustion sources (Yunker et al., 2002). Dickhut et al. (2000) indicate that ratio values of 0.53±0.06, 1.11±0.06, and 0.79±0.13 align with automobile emissions, coal/coke, and wood burning processes, respectively. Regions demonstrate values ranging from 0.41–0.46, indicating combustion sources (Yunker et al, 2002). (Fig 4). Values >0.35 for BaA/(BaA+Chr) are often accompanied by values >0.4 for the Flu/(Flu+Pyr) ratio for urban locations, which is currently reflected in this study (Yunker et al., 2002). In comparison to Dickhut et al. (2000) ratios, values align closely with automobile emissions. An evaluation of diagnostic ratios by Katsoyiannis and Breivik (2014) determined that the BaA/(BaA+Chr) ratio is the most robust ratio as compared to all other ratios (which include single PAHs) applied in this study, as this ratio is not greatly impacted by travel distance from emission source to receptor.
Fig. 4.
PAH diagnostic ratio plot of BaA/(BaA + Chr). Standard deviation of the mean is presented. n=127, 86, 189, and 402 for the Gulf, Eastern, Southwest and Combined regions, respectively. C: Combustion; M: Mixed Sources; P: Petroleum.
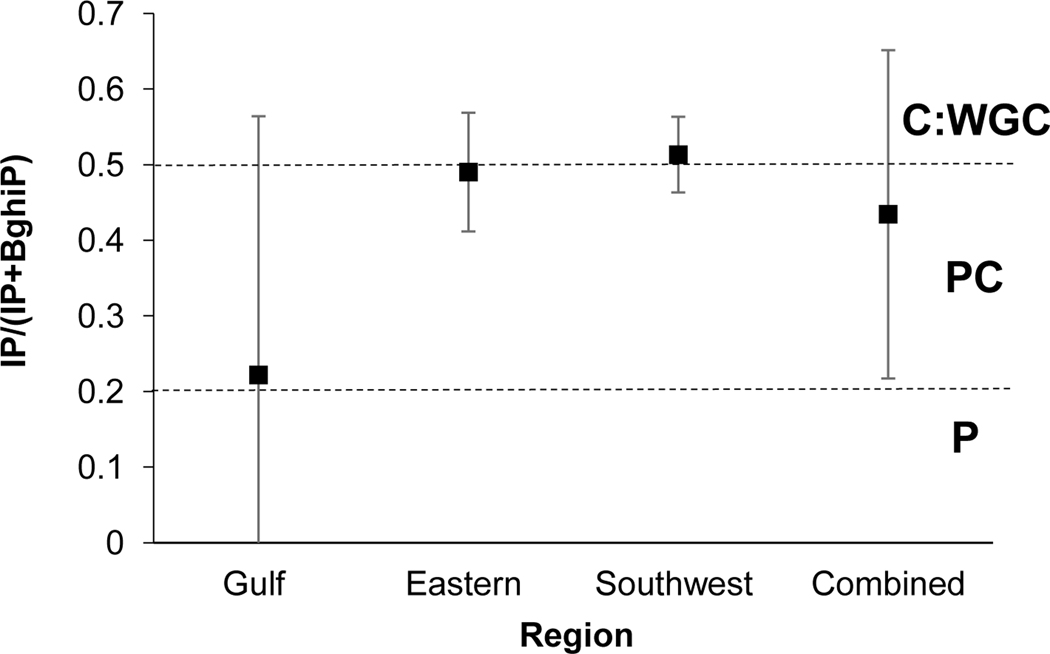
The IP/(IP+BghiP) ratio provides insight to petroleum, petroleum combustion, and combustion sources. Values <0.2 indicate petroleum, values between 0.2 and 0.5 indicate petroleum combustion, and values >0.5 indicate wood, grass, and/or coal combustion (Yunker et al., 2002). Dickhut et al. (2000) propose values of 0.33±0.06, 1.09±0.03, and 0.28±0.05 for automobile emissions, coal/coke, and wood burning processes, respectively. This ratio demonstrates the greatest variability among regions and values range from 0.22–0.51 (Fig 5). All regions, excluding the Southwest, demonstrate values in the petroleum combustion range, while the Southwest region presents a value that indicates wood, grass and/or coal combustion (Yunker et al., 2002). In comparison to values presented by Dickhut et al. (2000), the Gulf aligns closely with wood burning processes, while the remaining regions align closely with automobile emissions.
Fig. 5.
PAH diagnostic ratio plot of IP/(IP+BghiP). Standard deviation of the mean is presented. n=78, 79, 154, and 311 for the Gulf, Eastern, Southwest and Combined regions, respectively. C: Combustion; WGC: Wood, grass, coal; PC: Petroleum Combustion; P: Petroleum.
Similar diagnostic ratios to those reported in this study have been applied to sediments across other harbor sites in NS over the last 20 years. Surficial sediments of Halifax Harbor (1999) were assessed by diagnostic ratios, which suggested that combustion PAH sources were the greatest contributors (Hellou et al., 2002). Sediments of the Bay of Fundy were recently assessed by both Flu/(Flu+Pyr) and IP/(IP+BghiP) ratios, both of which indicated that samples were from mixed combustion processes from biomass and fossil/solid fuels (Yang et al., 2018). Multiple stations within Sydney Harbor, NS, sediments have been assessed by diagnostic ratios and suggest a strong coal combustion signature (Walker et al., 2015). Multiple PAH diagnostic ratios, including BaA/(BaA+Chr), have indicated a strong coal combustion and coal handling signature of sediments and soils gathered in and around the Sydney Tar Pond (STP) area in Sydney, Nova Scotia (MacAskill et al., 2016). Ratio analyses by Walker et al. (2017) further support the influence of coal combustion as a dominating PAH emission source in Sydney. This site is of particular importance given that seven of the 31 selected SCHs are within 200km from Sydney. Sydney was historically home to a large steel facility and coking operation that produced and emitted vast amounts of contaminants into the surrounding environment, including PAHs (Smith et al., 2009; Walker et al., 2013a; 2013b; MacAskill et al., 2016).
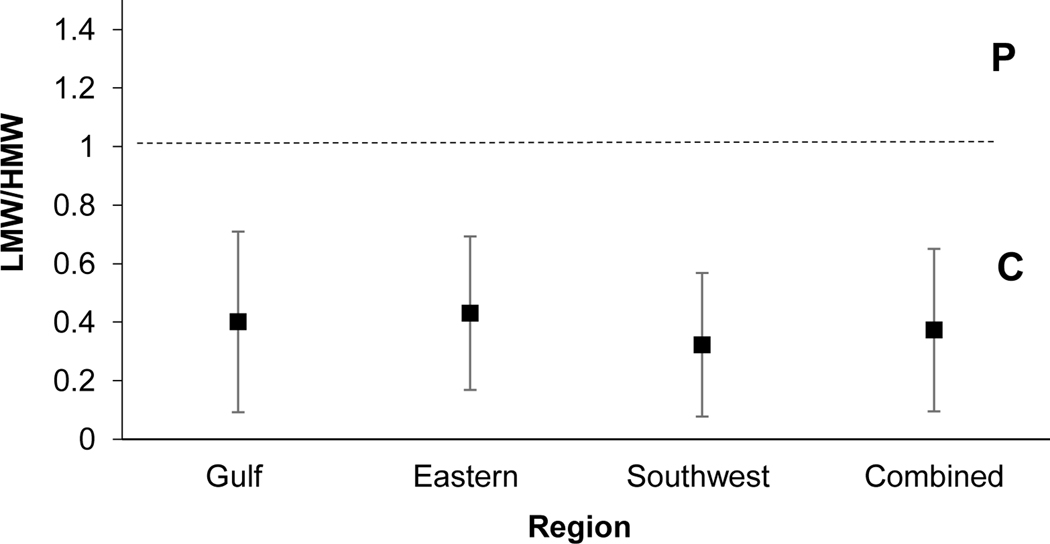
The ratio of LMW to HMW PAHs aims to distinguish between petrogenic and pyrogenic sources. Values < 1 suggest pyrogenic sources, while a value >1 suggests petrogenic sources (Hwang & Foster, 2006; Zhang et al., 2008). Regions demonstrated values which ranged from 0.32–0.43, suggesting pyrogenic sources may be most impactful in NS SCH sediments (Fig 6).
Fig. 6.
PAH diagnostic ratio plot of LMW to HMW PAHs. Standard deviation of the mean is presented. Samples used were n= 224, 108, 248, and 580 for the Gulf, Eastern, Southwest and Combined regions, respectively. P: Petrogenic, C: Combustion (Pyrogenic)
3.2. Source apportionment using Unmix
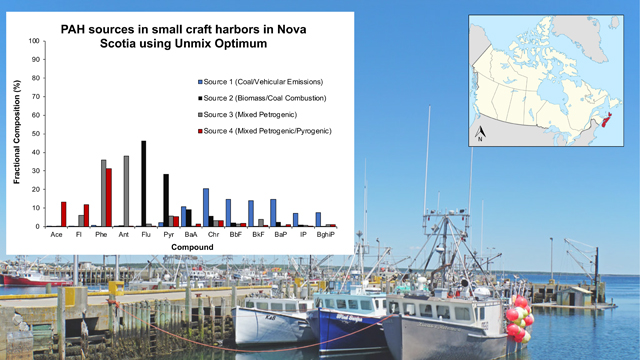
UnmixO identified four factors (sources) which best describe PAHs in NS sediments (Table 1). Factor 1 and Factor 2 contribute 32 and 47%, respectively, to the total PAHs among samples, while Factors 3 and 4 contribute to a much lesser extent at 11 and 10%, respectively.
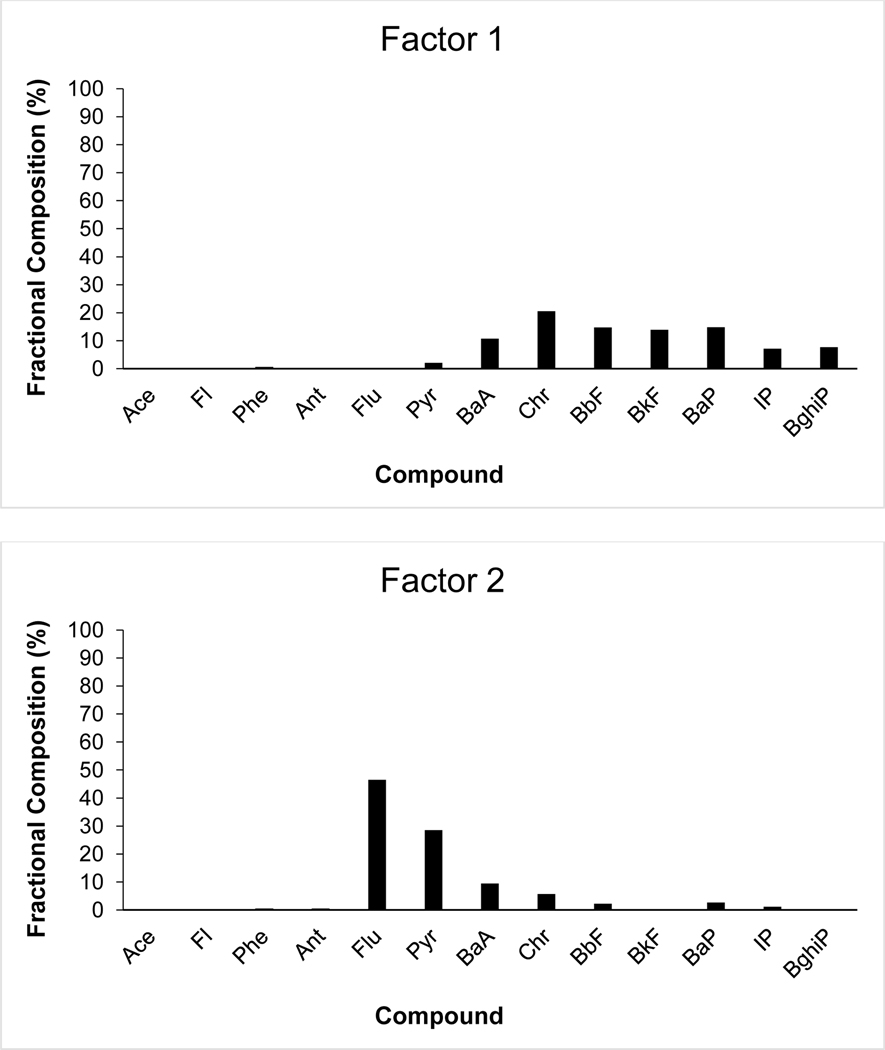
Factor 1 is characterized by high loadings of HMW PAHs, including Chr, BbF, BkF, BaP, IP and BghiP (Fig 7a). Normalized squae difference (Chi2 sum calculations) indicate a closeness to profiles from the greater literature, and a lower calculated value indicates similarity between profiles (Van Metre & Mahler, 2014). Coke oven emissions (Chi2 sum=155.76), coal tar sealant profiles (174.07, 281.23, 329.83), traffic tunnel air (374.80), and gasoline vehicle particulate emissions (418.71) profiles demonstrated the lowest Chi2 sum calculation when compared to Factor 1. The large proportion of IP, BghiP, and BbF and BkF suggest vehicular emissions of gas and diesel (Duval & Friedlander, 1981). Similarly, Chr, BaP, BaA are compounds which suggest coal combustion (Larsen & Baker, 2003; Sofowote et al., 2008). Factor 1 is estimated to be a mixed source of coal combustion and vehicular emissions (both diesel and gasoline).
Fig. 7a-d:
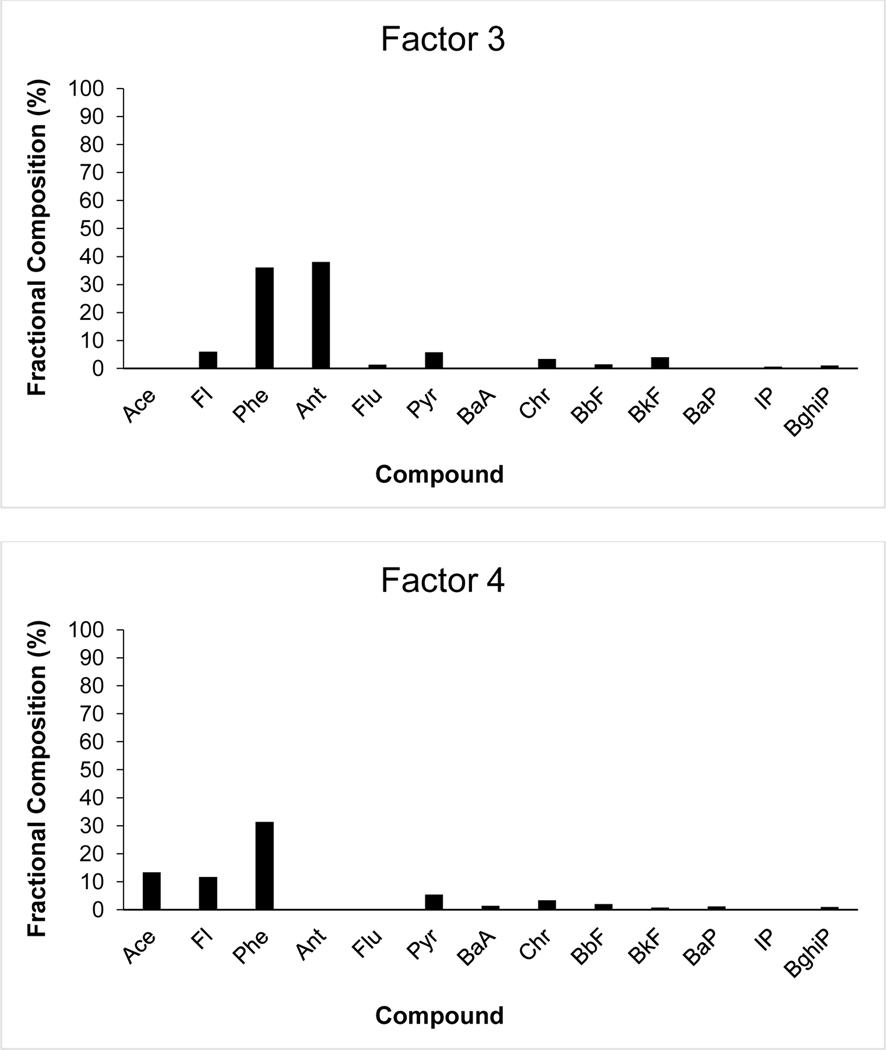
Fractional composition of 14 individual PAH species in a) UnmixO Factor 1; b) UnmixO Factor 2; c) UnmixO Factor 3; d) UnmixO Factor 4.
Factor 2 is characterized by high loadings of Flu and Pyr and to a lesser extent, BaA and Chr (Fig 7b). Similar to Factor 1, Factor 2 is dominated by HMW PAHs. Normalized square difference (Chi2 sum calculations) indicate a closeness to pine-wood soot particles from the greater literature (389.25). The four-ring PAHs which dominate factor 2 are often produced by the burning of biomass, coal combustion, or industrial/residential incineration processes (Simoneit et al., 2005, Ravindra et al., 2006a). The dominating PAHs of this factor [Flu, Pyr, BaA and Chr] are considered tracer species for coal combustion processes as well (Duval & Friedlander, 1981). Factor 2 is estimated to be a biomass/coal combustion source.
Factor 3 is characterized by high loadings of Phe and Ant and is dominated by higher loadings of LMW PAHs (Fig 7c). Normalized square difference (Chi2 sum calculations) indicate a closeness to many of the 22 literature profiles, as the calculated values remain close to another. Residential heating (141.72), used motor oil profiles (147.83 and 164.22), and coal tar (169.44) are the most closely related profiles. Phe and Ant, which present the highest loadings in this Factor, can be indicators of biomass burning, coal combustion, and coke production (Duval & Friedlander, 1981, Harrison et al., 1996). Factor 3 is estimated to be a mixed petrogenic-dominated source (i.e. motor/hydraulic oil)
Factor four is characterized by high loadings of Phe, Ace, and Fl and is dominated by higher loadings of LMW PAHs (Fig 7d). Normalized square difference (Chi2 sum calculations) indicate a particular closeness to 15 of the 22 literature profiles, as the calculated values remain close to one another. Diesel particles (109.78), residential heating (147.75), diesel vehicle particulate emissions (153.71), and coal tar (203.54) indicate the greatest similarity to factor 4. Diesel boat engines show that Phe and Fl are commonly emitted in elevated concentrations (as compared to other PAHs) in both particulate and gaseous form from engine exhaust (Lin et al., 2006; Hsieh et al., 2009). Fl and Phe, two of the highest loadings, are present within coal (Achten & Hoffman, 2009). Similarly, Phe supports biomass burning, coal combustion, and coke production sources (Duval & Friedlander, 1981, Harrison et al., 1996; Wang et al., 2013). Factor 4 is estimated to be a mixed source of petrogenic and pyrogenic origins.
3.3. Source apportionment by PAH Profile Composition Assessment
Fig. 8 shows the distribution of 2–6 ring PAH species among samples in the Gulf, Eastern, and Southwest regions of NS. The distribution of PAHs in each category (%) is very similar among regions. HMW PAHs (4–6 ring) dominate samples, while LMW PAHs (2 or 3 ring) form a smaller proportion. This distribution aligns with the ratio presented in Fig. 6 (LMW/HMW PAHs), that reflects the larger proportion of HMW PAHs, as compared to LMW PAHs. The abundance of HMW PAHs is an indication that combustion processes are likely the dominating source of PAHs as these processes often produce HMW PAHs (Mosert et al., 2010). There is increased likelihood of HMW PAHs directly entering aquatic environments through deposition, as compared to LMW PAHs (McCready et al., 2000). In aquatic environments, HMW PAHs are more likely to maintain their integrity, because of the carbonaceous matter they associate with (soot, black carbon, char) can provide protection from degradation (Achten & Hoffman; 2009; Tobiszewski & Namieśnik; 2012; Yunker et al., 2011). This relationship supports the increased accumulation of HMW PAHs in sediments, and their persistence in aquatic environments (Koelmans et al., 2006; Yunker et al., 2014).
Fig. 8.
Compositional assessment of PAHs in sediments of NS SCHs by the number of atomic rings. US EPA Priority 16 PAHs were included within the atomic ring categories, while 1 and 2-methylnapthalene (1-MN and 2-MN) and perylene (pery) excluded. Concentrations of these compounds (1-MN, 2-MN and pery) were included to calculate the total PAH value and subsequently form the remaining percentage for each region.
The dominance of HMW PAHs in surficial sediments within Atlantic Canada, especially the dominance of fluoranthene and pyrene, has been observed. Previous studies of sediments along the Bay of Fundy (of which 5 of the current study 31 SCHs reside) have supported these findings (Hellou et al., 2005; Yang et al., 2018). Similarly, surficial sediments of the Halifax Harbor demonstrate the same trend (Hellou et al., 2002). Previous work by Davis et al., (2018) indicate that this holds true for the 31 NS SCHs of this current study, as fluoranthene and pyrene (both HMW) are the top two dominating PAHs among samples, followed by phenanthrene.
The relationship between typical combustion PAHs [∑Comb] and the ∑PAH16 value among samples is represented in Fig. 9. PAHs which are typically produced from combustion processes include: Flu, Pyr, BaA, BbF, BkF, BaP, DBahA, BghiP, and IP (Prahl & Carpenter, 1983). All compounds are HMW and contain between 4 and 6-rings. Pearson correlation analysis indicated a strong positive relationship between ∑Comb and ∑PAH16 (r2= 0.958, n=580). This relationship is best interpreted as the dominance of combustion derived PAHs as part of the total PAH profile among sediment samples. Davis et al. (2018) have identified that many of the combustion associated PAHs above are present in NS SCH sediments in the greatest concentrations, particularly Flu and Pyr. As such, one would expect to see a positively correlated relationship between combustion PAHs (which are HMW) and total PAHs of a sample as these compounds are expected to form the greatest proportion.
Fig. 9.
Correlation analysis between ∑COMB PAHs and ∑PAH16 in SCH sediments in NS. ∑COMB PAHs is the sum of [Flu, Pyr, BaA, BbF, BkF, BaP, DBahA, BghiP], while ∑PAH16 encompasses the 16 PAHs listed as US EPA priority pollutants. Coefficient of determination (R2) is presented (n=580).
PAH profile compositional assessment in other sediments in Atlantic Canadian harbors have further suggested the dominance of PAH combustion sources. Molecular abundance and carbon isotope assessment of PAHs in sediments within St. John’s Harbor in Newfoundland, Canada, had previously indicated that the majority of PAHs present were of combustion origins, with vehicular emissions suggested as the dominating source (O’Malley et al., 1996). Similarly, sediments assessed in the Bay of Fundy showed a greater abundance of 3–6 ring PAHs, as compared to 2–3 ring PAHs, suggesting that they were likely the product of combustion sources (Yang et al., 2018).
3.4. Source estimation using multiple lines of evidence
The multiple lines of evidence employed to investigate source apportionment strongly indicate that NS sediments are dominated by combustion (pyrogenic) PAH compounds, with petrogenic PAHs contributing at a much smaller extent (Table 2).
Table 2.
Summary of key findings from three lines of evidence used in support of PAH source apportionment in NS SCH sediments.
| Approach | Details | Key Finding (s) | Estimated Source |
|---|---|---|---|
| Diagnostic Ratio | Fluoranthene/(Fluoranthene + Pyrene) | All regions present values >0.5 | Wood/grass/coal combustion (Yunker et al., 2002) |
| Anthracene/(Anthracene + Phenanthrene) | All regions present values >0.1 | Combustion (Yunker et al., 2002) | |
| Benzo[a]anthracene/(Benzo[a]anthracene + Chrysene) | All regions present values >0.35 | Combustion (Yunker et al., 2002) | |
| Indeno[1,2,3-cd] pyrene/(Indeno [1,2,3cd] pyrene + Benzo[g,h,i]perylene). | Gulf, Eastern and Combined present values between 0.2–0.5, while Southwest region is >0.5 | 0.2–0.5 indicates petroleum combustion, while >0.5 supports wood/grass/coal combustion (Yunker et al., 2002) | |
| LMW PAHs/HMW PAHs | HMW PAHs dominate NS SCHs, all regions demonstrate a ratio value of <1. | Combustion (Hwang and Foster, 2006; Zhang et al., 2008) | |
| Unmix Optimum Receptor Modeling | Unmix Optimum identified four sources which best fit NS SCH data. | Source 1 presents high loadings of including BaP, BkF, BbF, BaA. Source 1 contributes 32% to total PAHs. | Coal combustion/vehicle emissions |
| Source 2 presents high loadings of Flu and Pyr. Source 2 contributes 47% to total PAHs. | Coal/biomass combustion | ||
| Source 3 presents high loadings of Phe and Ant. Source 3 contributes 11% to total PAHs. | Mixed petrogenic source | ||
| Source 4 presents high loadings of Phe, Ace, and Fl. Source 4 contributes 10% to total PAHs. | Mixed source of petrogenic and pyrogenic origins. | ||
| Compositional Analysis | Assessment (%) of 2–6 ring PAHs across Gulf, Eastern, and Southwest regions. | 4-ring PAHs compose over 50% of all PAHs among regions. HMW PAHs (4–6 rings) form the greatest proportion among all regions. |
The abundance of HMW PAHs suggests combustion origin (McCready et al., 2000) |
| Correlation analysis of PAHs [∑Comb] and ∑PAH16 | Strong positive relationship between ∑Comb and ∑PAH16 (r2= 0.958) | Combustion derived PAHs dominate the total PAH profile |
Coal combustion has been identified as a dominant source of PAHs in NS sediments. In NS, the majority of coal combustion processes were historically centralized to the Cape Breton region due to the large steel facility that operated for nearly a decade (Ferrara et al., 2007; MacAskill et al., 2016). Currently, NS has four coal and/or petroleum coke (pet coke) powered plants responsible for part of the province’s power generation (Fig. 1). The plants are located in Lingan, Point Aconi, Point Tupper, and Trenton (NS Power, 2017). Point Aconi is the only thermal power generating plant in NS which uses pet coke, while the other three plants operate using coal. Previous studies in Canada have indicated that PAH concentrations decrease with increasing distance from known sites which contribute pet-coke dust (Xu, 2018). Therefore, it could be expected that PAHs that are the product of coal or pet coke combustion processes may reside in harbors in close proximity to these sites. With this information in mind, it can be inferred that PAHs in the atmosphere across NS are likely mobile, yet the distance in which they may be transported is reliant on other factors (wind, emission sources). Future studies could incorporate these variables into source apportionment investigations to elucidate greater resolution of potential sources of PAHs in sediments.
Biomass incineration and vehicular emissions also demonstrate strength as PAH emission sources contributing to NS SCH sediments. Biomass incineration may contribute given that burning (incineration) of biomass is very common in NS. Residential burning of wood through stoves or furnaces is a favorable option for Nova Scotians because it is cost-effective and may reduce heating bills (Efficiency Nova Scotia, 2018). Similarly, Natural Resources Canada Office of Energy Efficiency in 2009 indicated that residents of NS drive the furthest distances in their vehicles as compared to all other provinces in Canada. The geography of the province is expected to contribute to this statistic, as alternative transportation options are limited in many regions of the province, the average household has at least one vehicle, and that the city of Halifax is home to more than 40% (431,479 residents as of 2017) of the province’s population (NRCAN, 2009). Therefore, the increased usage of vehicles by NS residents may be a contributing factor of vehicular emission PAHs.
Regular boat traffic by fishing vessels at SCH sites may be a contributor of ‘vehicular emission’ PAHs, of which are emitted from a diesel engine. UnmixO source 4 demonstrates high loadings of compounds (Fl, Phe) which are known to be contributed into harbor environments by diesel boat engines, yet it is well understood that naphthalene (Nap) is the PAH compound which may be considered the strongest indicator of this emission source as it is emitted in concentrations which are far greater than Fl or Phe. Unfortunately, Nap was excluded from the Unmix model which makes diesel boat engine emissions difficult to estimate. However, assessed Nap concentrations among SCHs were relatively low in comparison to Fl and Phe, and of all assessed PAHs, Nap demonstrated the lowest number of exceedances when compared to sediment quality guidelines (Davis et al., 2018). As UnmixO Factor 4 contributes only 10% to the total PAHs among samples, this suggests that the potential impact of diesel engine emissions from SCH vessels may be minimal.
The PAH sources identified through the lines of evidence indicate that PAHs in SCH sediments are not likely the product of harbor-specific activities at SCHs (fishing vessel traffic, fuel, spills). For federal custodians of SCHs, this is an indication that both environmental and financial liabilities are reduced as PAHs do not appear to be the product of on-site point sources, of which they may be responsible to control and manage. PAH sources impacting sediments appear to be a product of various terrestrial combustion activities, which are difficult to define and subsequently control. To compound this issue, temporal delineation of PAH contamination in SCH sediments is not easily defined. As all sediments assessed were surficial sediment samples, from SCHs which undergo routine dredging, the ability to make inference to historical and/or ongoing PAH sources is extremely difficult. To address this challenge, the use of sediment cores in the future would provide valuable insight to further evaluate PAH sources in SCH sediments and delineate contamination over time.
4. Conclusion
This study investigated source apportionment of PAHs in NS sediments across 31 SCHs, by employing three lines of evidence. The three lines of evidence support the notion that NS sediments are most impacted by combustion sources, likely attributed to historical and current coal combustion processes in the province and further supported by residential incineration of wood products and vehicular usage by Nova Scotian residents. Petrogenic sources appear to impact NS sediments, yet to a much lesser extent, an indication that harbor-specific activities by users (i.e., boat traffic, fuel spills) are not likely large contributors of PAHs to SCH sediments. Therefore, results indicate that the environmental and/or financial liability of PAHs in SCH sediments may be reduced for federal harbor custodians as PAH sources are not well defined.
The findings of this study suggest that NS aligns with global trends in that pyrogenic PAHs tend to dominate sediments and that the origin of these PAHs is greatly influenced by various anthropogenic combustion activities. Pyrogenic PAHs within NS SCH sediment may demonstrate increased physic-chemical stability (given an increased molecular weight), thereby potentially reducing the ecological impact PAHs may have on aquatic ecosystems. Furthermore, the understanding that pyrogenic PAHs (and their inherent characteristics in the marine environment) most greatly impact NS sediments is important as certain managerial activities at SCHs may affect the risk in which they may pose (i.e., dredging, remedial activities). The effects of long-range transport and/or localized emissions of PAHs in NS and temporal delineation of PAH contamination requires further scrutiny and analysis and would ultimately help to support a more robust understanding of PAH transport and emission sources in the localized NS context and beyond. This study has also acknowledged the utility of newly developed UnmixO modeling for evaluating PAH sources in historical sediment data with few high values, and many values falling below detection; previous versions of Unmix struggled with this type of data.
Highlights.
Sediment was assessed for source apportionment of polycyclic aromatic hydrocarbons
Multiple lines of evidence investigated PAH sources from NS harbor sediments
US EPA Unmix Optimum modeling was applied to reveal potential PAH sources
PAHs produced from pyrogenic processes appear as the dominating source
Results suggest terrestrial activities greatly contribute PAHs to sediment
Acknowledgements:
This study was made possible by data kindly supplied by DFO-SCH and PSPC. Funding was provided by the province of Nova Scotia (NS Graduate Scholarship), the School for Resource and Environmental Studies, Dalhousie University, and NSERC Discovery Grant RGPIN-2018-04119 to T.R.W. The views expressed in this article are those of the authors and do not necessarily represent the views or policies of the U.S. Environmental Protection Agency.
References:
- Abdel-Shafy HI & Mansour MS, 2016. A review on polycyclic aromatic hydrocarbons: source, environmental impact, effect on human health and remediation. Egyptian Journal of Petroleum, 25(1), 107–123. [Google Scholar]
- Achten C, & Hofmann T. (2009). Native polycyclic aromatic hydrocarbons (PAH) in coals – A hardly recognized source of environmental contamination. Science of the Total Environment, 407(8), 2461–2473. [DOI] [PubMed] [Google Scholar]
- Chen C-W, & Chen C-F (2011). Distribution, origin, and potential toxicological significance of polycyclic aromatic hydrocarbons (PAHs) in sediments of Kaohsiung Harbor, Taiwan. Marine Pollution Bulletin, 63 (5–12), 417–423. [DOI] [PubMed] [Google Scholar]
- Davis E, Walker TR, Adams M, & Willis R. (2018). Characterization of polycyclic aromatic hydrocarbons (PAHs) in small craft harbour (SCH) sediments in Nova Scotia, Canada. Marine Pollution Bulletin, 137, 285–294. [DOI] [PubMed] [Google Scholar]
- Dickhut RM, Canuel EA, Gustafson KE, Liu K, Arzayus KM, Walker SE, Edgecombe G, Gaylor MO, & MacDonald EH (2000). Automotive sources of carcinogenic polycyclic aromatic hydrocarbons associated with particulate matter in the Chesapeake Bay region. Environmental Science & Technology, 34(21), 4635–4640. [Google Scholar]
- Duval MM, & Friedlander SK (1981). Source resolution of polycyclic aromatic hydrocarbons in the Los Angeles atmosphere Application of a CMB with First Order Decay; U.S. EPA Report EPA-600/2–81-161; U.S. Government Printing Office: Washington, DC, 1981. [Google Scholar]
- Efficiency Nova Scotia. (2018). Space Heating and Cooling. Retrieved from https://www.efficiencyns.ca/product-area/space-heating-and-cooling/
- Fang M, Lee C, Jiang J, Ko F, & Baker J. (2012). Diffusive exchange of PAHs across the air-water interface of the Kaohsiung Harbor lagoon, Taiwan. Journal of Environmental Management, 110, 179. [DOI] [PubMed] [Google Scholar]
- Fang G, Wu Y, Chen M, Ho T, Huang S, & Rau J. (2004). Polycyclic aromatic hydrocarbons study in Taichung, Taiwan, during 2002–2003. Atmospheric Environment, 38(21), 3385–3391. [Google Scholar]
- Ferrara I, McComb S, & Missios P. (2007). Local Willingness-to-Pay Estimates for the Remediation of the Sydney Tar Ponds in Nova Scotia. Canadian Public Policy / Analyse De Politiques, 33(4), 441–458. [Google Scholar]
- Fine PM, Cass GR, & Simoneit BR (2001). Chemical characterization of fine particle emissions from fireplace combustion of woods grown in the northeastern United States. Environmental Science & Technology, 35, 2665–2675. [DOI] [PubMed] [Google Scholar]
- Galarneau E. (2008). Source specificity and atmospheric processing of airborne PAHs: implications for source apportionment. Atmospheric Environment, 42(35), 8139–8149. [Google Scholar]
- Harrison R, Smith D, & Luhana L. (1996). Source apportionment of atmospheric polycyclic aromatic hydrocarbons collected from an urban location in Birmingham, U.K. Environmental Science & Technology, 30(3), 825–832. [Google Scholar]
- Hellou J, Haya K, Steller S, & Burridge L. (2005). Presence and distribution of PAHs, PCBs and DDE in feed and sediments under salmon aquaculture cages in the Bay of Fundy, New Brunswick, Canada. Aquatic Conservation: Marine & Freshwater Ecosystems, 15(4), 349–365. [Google Scholar]
- Hellou J, Steller S, Zitko V, Leonard J, King T, Milligan TG, & Yeats P. (2002). Distribution of PACs in surficial sediments and bioavailability to mussels, Mytilus edulis of Halifax Harbour. Marine Environmental Research, 53(4), 357–379. [DOI] [PubMed] [Google Scholar]
- Henry RC (1997). History and Fundamentals of multivariate air quality receptor models. Chemometrics & Intelligent Laboratory Systems, 37, 37–42. [Google Scholar]
- Henry RC (2003). Multivariate receptor modeling by N-dimensional edge detection. Chemometrics & Intelligent Laboratory Systems, 65(2), 179–189. [Google Scholar]
- Hsieh L, Shih S, Lin S, Yang T, Wu T, & Hung C. (2009). Emissions in the exhaust of fishing boats after adding viscous agents into fuel oils. Science of the Total Environment, 408(2), 233–241. [DOI] [PubMed] [Google Scholar]
- Hwang HM, & Foster GD (2006). Characterization of polycyclic aromatic hydrocarbons in urban stormwater runoff flowing into the tidal Anacostia River, Washington, DC, USA. Environmental Pollution, 140(3), 416–426. [DOI] [PubMed] [Google Scholar]
- Jiang J, Lee C, Fang M, & Liu JT (2009). Polycyclic aromatic hydrocarbons in coastal sediments of southwest Taiwan: An appraisal of diagnostic ratios in source recognition. Marine Pollution Bulletin, 58(5), 752–760. [DOI] [PubMed] [Google Scholar]
- Jenkins BM, Jones AD, Turn SQ, & Williams RB (1996). Emission factors for polycyclic aromatic hydrocarbons from biomass burning. Environmental Science & Technology, 30, 2462–2469. [Google Scholar]
- Katsoyiannis A, Sweetman AJ, & Jones KC (2011). PAH molecular diagnostic ratios applied to atmospheric sources: a critical evaluation using two decades of source inventory and air concentration data from the UK. Environmental Science & Technology, 45, 8897–8906. [DOI] [PubMed] [Google Scholar]
- Katsoyiannis A, & Breivik K. (2014). Model-based evaluation of the use of polycyclic aromatic hydrocarbons molecular diagnostic ratios as a source identification tool. Environmental Pollution, 184, 488–494. [DOI] [PubMed] [Google Scholar]
- Koelmans AA, Jonker MT, Cornelissen G, Bucheli TD, Van Noort PC, & Gustafsson Ö. (2006). Black carbon: the reverse of its dark side. Chemosphere, 63(3), 365–377. [DOI] [PubMed] [Google Scholar]
- Larsen RK, & Baker JE (2003). Source Apportionment of Polycyclic Aromatic Hydrocarbons in the Urban Atmosphere: A Comparison of Three Methods. Environmental Science & Technology, 37(9), 1873–1881. [DOI] [PubMed] [Google Scholar]
- Lima ALC, Farrington JW, & Reddy CM (2005). Combustion-derived polycyclic aromatic hydrocarbons in the environment—a review. Environmental Forensics, 6(2), 109–131. [Google Scholar]
- Lin Y, Lee W, Li H, Chen C, Fang G, & Tsai P. (2006). Impact of using fishing boat fuel with high poly aromatic content on the emission of polycyclic aromatic hydrocarbons from the diesel engine. Atmospheric Environment, 40(9), 1601–1609. [Google Scholar]
- MacAskill ND, Walker TR, Oakes K, & Walsh M. (2016). Forensic assessment of polycyclic aromatic hydrocarbons at the former Sydney tar ponds and surrounding environment using fingerprint techniques. Environmental Pollution, 212, 166–177. [DOI] [PubMed] [Google Scholar]
- Mahanty B, Pakshirajan K, & Dasu VV (2011). Understanding the complexity and strategic evolution in PAH remediation research. Critical Reviews in Environmental Science & Technology, 41(19), 1697–1746. [Google Scholar]
- Mar TF, Ito K, Koenig JQ, Larson TV, Eatough DJ, Henry RC, Kim E, Laden F, Lall R, Neas L, Stölzel M, Hopke PK & Thurston GD (2005). PM Source Apportionment and Health Effects: 1. Intercomparison of Source Apportionment Results. Journal of Exposure Analysis and Environmental Epidemiology, 16, 275–286. [DOI] [PubMed] [Google Scholar]
- Masclet P, Cachier H, Liousse C, & Wortham H. (1995). Emissions of polycyclic aromatic hydrocarbons by savanna fires. Atmospheric Chemistry, 22, 41–54. [Google Scholar]
- Masood N, Zakaria MP, Halimoon N, Aris AZ, Magam SM, Kannan N, Mustafa S, Ali MM, Keshavarzifard M, Vaezzadeh V, & Alkhadher SAA (2016). Anthropogenic waste indicators (AWIs), particularly PAHs and LABs, in Malaysian sediments: Application of aquatic environment for identifying anthropogenic pollution. Marine Pollution Bulletin, 102(1), 160–175. [DOI] [PubMed] [Google Scholar]
- McCready S, Slee DJ, Birch GF, & Taylor SE (2000). The distribution of polycyclic aromatic hydrocarbons in surficial sediments of Sydney Harbour, Australia. Marine Pollution Bulletin, 40(11), 999–1006. [Google Scholar]
- Minitab 18 Statistical Software (2010). [Computer software]. State College, PA: Minitab, Inc. (www.minitab.com). [Google Scholar]
- Mostert MMR, Ayoko GA, & Kokot S. (2010). Application of chemometrics to analysis of soil pollutants. Trends in Analytical Chemistry, 29(5), 430–445. [Google Scholar]
- Nádudvari A, Fabiańska MJ, Marynowski L, Kozielska B, Konieczyński J, Smołka-Danielowska D, & Ćmiel S. (2018). Distribution of coal and coal combustion related organic pollutants in the environment of the Upper Silesian Industrial Region. Science of the Total Environment, 628-629, 1462–1488. [DOI] [PubMed] [Google Scholar]
- Natural Resources Canada (NRCAN) (2009). Canadian Vehicle Survey: 2009 Summary Report. Retrieved from http://oee.nrcan.gc.ca/publications/statistics/cvs09/pdf/cvs09.pdf
- Neff JM, Stout SA, & Gunster DG (2005). Ecological risk assessment of polycyclic aromatic hydrocarbons in sediments: identifying sources and ecological hazard. Integrated Environmental Assessment and Management, 1(1), 22–33. [DOI] [PubMed] [Google Scholar]
- Norris G, & Henry R. (2019). Unmix Optimum analysis of PAH sediment sources. Science of the Total Environment, 673, 831–838. [DOI] [PMC free article] [PubMed] [Google Scholar]
- Nova Scotia Power. (2017). Coal and Pet Coke Facilities. Retrieved from: https://www.nspower.ca/en/home/about-us/how-we-make-electricity/thermal-electricity/coal-https://www.nspower.ca/en/home/about-us/how-we-make-electricity/thermal-electricity/coal-facilities.aspxfacilities.aspx
- Oanh NTK, Reutergardh LB, & Dung NT (1999). Emission of polycyclic aromatic hydrocarbons and particulate matter from domestic combustion of selected fuels. Environmental Science & Technology, 33, 2703–2709. [Google Scholar]
- O’Malley V, Abrajano T, & Hellou J. (1996). Stable carbon isotopic apportionment of individual polycyclic hydrocarbons in St. John’s harbour, Newfoundland. Environmental Science & Technology, 30(2), 634–639. [Google Scholar]
- Prahl FG, & Carpenter R. (1983). Polycyclic aromatic hydrocarbon (PAH)-phase associations in Washington coastal sediment. Geochimica et Cosmochimica Acta, 47(6), 1013–1023. [Google Scholar]
- Ravindra K, Bencs L, Wauters E, De Hoog J, Deutsch F, Roekens E, Bleux N, Berghmans P, & Van Grieken R. (2006a). Seasonal and site-specific variation in vapour and aerosol phase PAHs over Flanders (Belgium) and their relation with anthropogenic activities. Atmospheric Environment, 40(4), 771–785. [Google Scholar]
- Ravindra K, Wauters E, Tyagi S, Mor S, & Grieken R. (2006b). Assessment of Air Quality After the Implementation of Compressed Natural Gas (CNG) as Fuel in Public Transport in Delhi, India. Environmental Monitoring and Assessment, 115(1), 405–417. [DOI] [PubMed] [Google Scholar]
- Ravindra K, Sokhi R, & Van Grieken R. (2008). Atmospheric polycyclic aromatic hydrocarbons: Source attribution, emission factors and regulation. Atmospheric Environment, 42(13), 2895–2921. [Google Scholar]
- Schauer JJ, Kleeman MJ, Cass GR, & Simoneit BR (2001). Measurement of emissions from air pollution sources. 3. C1-C29 organic compounds from fireplace combustion of wood. Environmental Science & Technology, 35,1716–1728. [DOI] [PubMed] [Google Scholar]
- Simoneit B, Medeiros P, & Didyk B. (2005). Combustion products of plastics as indicators for refuse burning in the atmosphere. Environmental Science & Technology, 39(18), 6961–70. [DOI] [PubMed] [Google Scholar]
- Smith JN, Lee K, Gobeil C, & Macdonald RW (2009). Natural rates of sediment containment of PAH, PCB and metal inventories in Sydney Harbour, Nova Scotia. Science of the Total Environment, 407(17), 4858–4869. [DOI] [PubMed] [Google Scholar]
- Sofowote UM, McCarry BE, & Marvin CH (2008). Source apportionment of PAH in Hamilton Harbour suspended sediments:comparison of two factor analysis methods. Environmental Science & Technology, 42(16), 6007–6014. [DOI] [PubMed] [Google Scholar]
- Stout SA, Uhler AD, & Emsbo-Mattingly SD (2004). Comparative evaluation of background anthropogenic hydrocarbons in surficial sediments from nine urban waterways. Environmental Science & Technology, 38(11), 2987–2994. [DOI] [PubMed] [Google Scholar]
- Stout SA, & Emsbo-Mattingly SD (2008). Concentration and character of PAHs and other hydrocarbons in coals of varying rank – implications for environmental studies of soils and sediments containing particulate coal. Organic Geochemistry, 39, 801–819. [Google Scholar]
- Stout S, & Graan T. (2010). Quantitative source apportionment of PAHs in sediments of Little Menomonee River, Wisconsin: Weathered creosote versus urban. Environmental Science & Technology, 44(8), 2932–2939. [DOI] [PubMed] [Google Scholar]
- Stout SA, Emsbo-Mattingly SD, Douglas GS, Uhler AD, & McCarthy KJ (2015). Beyond 16 priority pollutant PAHs: A review of PACs used in environmental forensic chemistry. Polycyclic Aromatic Compounds, 35(2–4), 285–315. [Google Scholar]
- Thorsen WA, Cope WG, & Shea D. (2004). Bioavailability of PAHs: Effects of soot carbon and PAH source. Environmental Science & Technology, 38(7), 2029–2037. [DOI] [PubMed] [Google Scholar]
- Timmerman M, Kiers H, & Smilde A. (2007). Estimating confidence intervals for principal component loadings: A comparison between the bootstrap and asymptotic results. British Journal of Mathematical & Statistical Psychology, 60(2), 295–314. [DOI] [PubMed] [Google Scholar]
- Tobiszewski M, & Namieśnik J. (2012). PAH diagnostic ratios for the identification of pollution emission sources. Environmental Pollution, 162, 110–119. [DOI] [PubMed] [Google Scholar]
- Uchimiya M. & Masunaga S. (2007). Time trends in sources and dechlorination pathways of dioxins in agrochemically contaminated sediments. Environmental Science & Technology, 41, 2703–2710. [DOI] [PubMed] [Google Scholar]
- Uchimiya M, Arai M. & Masunaga S. (2007). Fingerprinting localized dioxin contamination: Ichihara Anchorage case. Environmental Science & Technology,41, 3864–3870. [DOI] [PubMed] [Google Scholar]
- US EPA (United States Environmental Protection Agency). (2014). EPA Appendix A to 40 CFR, Part 423–126 Priority Pollutants. Retrieved from http://water.epa.gov/scitech/methods/cwa/pollutants.cfm
- Van Metre P, & Mahler B. (2014). PAH concentrations in lake sediment decline following ban on coal-tar-based pavement sealants in Austin, Texas. Environmental Science & Technology, 48(13), 7222–7228. [DOI] [PubMed] [Google Scholar]
- Walker TR, MacAskill D, Rushton T, Thalheimer AH, & Weaver P. (2013a). Monitoring effects of remediation on natural sediment recovery in Sydney Harbour, Nova Scotia. Environmental Monitoring & Assessment, 185(10), 8089–8107. [DOI] [PubMed] [Google Scholar]
- Walker TR, MacAskill D, & Weaver P. (2013b). Environmental recovery in Sydney Harbour, Nova Scotia: Evidence of natural and anthropogenic sediment capping. Marine Pollution Bulletin, 74(1), 446–452. [DOI] [PubMed] [Google Scholar]
- Walker TR, Gray T, Willis R, Maclean B, McMillan S, Leroy M, Appleton R, Wambolt N, & Smith M. (2015). Ecological Risk Assessment of sediments in Sydney Harbour, Nova Scotia. Soil & Sediment Contamination, 24, 471–493. [Google Scholar]
- Walker TR, MacAskill N, Thalheimer A, & Zhao L. (2017). Contaminant mass flux and forensic assessment of polycyclic aromatic hydrocarbons: Tools to inform remediation decision making at a contaminated site in Canada. Remediation Journal, 27(4), 9–17. [Google Scholar]
- Watson J, Antony Chen L, Chow J, Doraiswamy P, & Lowenthal D. (2008). Source Apportionment: Findings from the U.S. Supersites Program. Journal of the Air & Waste Management Association, 58(2), 265–288. [DOI] [PubMed] [Google Scholar]
- Wang Z, Chen J, Yang P, Qiao X, & Tian F. (2007). Polycyclic aromatic hydrocarbons in Dalian soils: Distribution and toxicity assessment. Journal of Environmental Monitoring, 9(2), 199–204. [DOI] [PubMed] [Google Scholar]
- Wang X, Miao Y, Zhang Y, Li Y, Wu M, & Yu G. (2013). Polycyclic Aromatic Hydrocarbons (PAHs) in Urban Soils of the Megacity Shanghai: Occurrence, Source Apportionment and Potential Human Health Risk. Science of the Total Environment, 447, 80–9. [DOI] [PubMed] [Google Scholar]
- Wise S, Sander L, & Schantz M. (2015). Analytical Methods for Determination of Polycyclic Aromatic Hydrocarbons (PAHs) — A Historical Perspective on the 16 U.S. EPA Priority Pollutant PAHs. Polycyclic Aromatic Compounds, 35(2–4), 1–61. [Google Scholar]
- Xu G. (2018). Atmospheric Benzo[a]pyrene and vanadium evidence for the presence of petroleum coke dust in the Athabasca Oil Sands Region, Alberta, Canada. Journal of Cleaner Production, 171, 592–599. [Google Scholar]
- Yang Z, Shah K, Crevier C, Laforest S, Lambert P, Hollebone BP, Yang C, Brown CE, Landriault M, & Goldthorp M. (2018). Occurrence, source and ecological assessment of petroleum related hydrocarbons in intertidal marine sediments of the Bay of Fundy, New Brunswick, Canada. Marine Pollution Bulletin, 133, 799–807. [DOI] [PubMed] [Google Scholar]
- Yunker MB, Macdonald RW, Vingarzan R, Mitchell RH, Goyette D, & Sylvestre S. (2002). PAHs in the Fraser River basin: a critical appraisal of PAH ratios as indicators of PAH source and composition. Organic Geochemistry, 33(4), 489–515. [Google Scholar]
- Yunker MB, Macdonald RW, Goyette D, Paton DW, Fowler BR, Sullivan D, & Boyd J. (1999). Natural and anthropogenic inputs of hydrocarbons to the Strait of Georgia. Science of the Total Environment, 225, 181–209. [DOI] [PubMed] [Google Scholar]
- Yunker MB, Macdonald RW, Brewer R, Sylvestre S, Tuominen T, Sekela M, Mitchell RH, Paton DW, Fowler BR, Gray C, Goyette D, & Sullivan D. (2000). Assessment of Natural and Anthropogenic Hydrocarbon Inputs Using PAHs as Tracers. The Fraser River Basin and Strait of Georgia (1987–1997). Aquatic and Atmospheric Sciences Division, Environmental Conservation Branch, Pacific and Yukon Region, Environment Canada, Vancouver, BC: 128 pp. [Google Scholar]
- Yunker M, Macdonald R, Snowdon L, & Fowler B. (2011). Alkane and PAH biomarkers as tracers of terrigenous organic carbon in Arctic Ocean sediments. Organic Geochemistry, 42(9), 1109–1146. [Google Scholar]
- Yunker M, Mclaughlin F, Fowler M, & Fowler B. (2014). Source apportionment of the hydrocarbon background in sediment cores from Hecate Strait, a pristine sea on the west coast of British Columbia, Canada. Organic Geochemistry, 76, 235–258 [Google Scholar]
- Zemo DA (2009). Use of parent polycyclic aromatic hydrocarbon (PAH) proportions to attribute PAH sources in sediments: a case study from the Pacific Northwest. Environmental Forensics, 10(3), 229–239. [Google Scholar]
- Zhang W, Zhang S, Wan C, Yue D, Ye Y, & Wang X. (2008). Source diagnostics of polycyclic aromatic hydrocarbons in urban road runoff, dust, rain and canopy throughfall. Environmental Pollution, 153(3), 594–601. [DOI] [PubMed] [Google Scholar]
- Zhang XL, Tao S, Liu WX, Yang Y, Zuo Q, & Liu SZ (2005). Source diagnostics of polycyclic aromatic hydrocarbons based on species ratios: a multimedia approach. Environmental Science & Technology, 39(23), 9109–9114. [DOI] [PubMed] [Google Scholar]


