Abstract
Ongoing efforts to improve diversity in science, technology, engineering, and mathematics (STEM) primarily manifest as attempts to recruit more women and individuals from historically marginalized groups. Yet, these efforts fail to repair the specific, systemic issues within academic communities that hinder diverse individuals from persisting and thriving in STEM. Here, we present the results of a quantitative, multiyear effort to make the academic climate of an R1 STEM department more inclusive. We use a student-led, department-specific, faculty-supported initiative to assess and improve the climate of the Department of Chemistry at the University of California, Berkeley, as a case study. Our results provide quantitative evidence that community discussions grounded in our own data, alongside cooperative community efforts to address the issues present in those data, are effective methods for driving positive change. Longitudinal assessment of our academic climate from 2018 to 2020 via annual department-wide surveys indicates that these interventions have succeeded in shifting the perception of our academic climate. This study confirms the positive outcomes of having a practical, sustainable, and data-driven framework for affecting change within a graduate community.
Introduction
While the number of women in science, technology, engineering, and mathematics (STEM) fields has increased relative to men since 1993, they continue to be underrepresented at all career stages in nearly every STEM field.1−3 Moreover, individuals who identify as Black, Hispanic, American Indian, Alaskan Native, Native Hawaiian, and Pacific Islander make up just 7.6% of researchers at all levels of doctorate-granting research universities and are systematically disadvantaged within STEM.4 These numbers further decline at the most senior levels of academia and industry.3−6
There is growing evidence that systemic patterns of bias, discrimination, and inequity discourage women and members of other historically marginalized groups from entering or persisting in STEM.7−11 For example, archaic stereotypes suggesting that women have less innate scientific ability, and implying that whiteness is correlated more strongly with ability than any other race, have cemented gender and racial/ethnic disparities as natural outcomes.12−14 The resulting, persistent culture heavily influences perceptions of who can and cannot thrive in STEM7,15−24 and creates structural barriers that can impede the success of women and gender, racial, and ethnic minorities—for example, by making the doctoral experience socially isolating, research groups inhospitable, and mentoring interactions less than satisfactory.7,25−31
Many institutions have begun efforts to address these issues broadly by using a top–down administrative approach. Doing so, however, can fail to identify and address department-specific concerns, which exist because every academic community has a unique climate and historical narrative.3 Thus, department-level efforts that seek to create equitable and welcoming academic environments are essential to combat the factors that negatively impact diversity, equity, and inclusion within a community.3,26,32−34 Furthermore, while many institutions do administer surveys to assess organizational climate, such data collection is typically not repeated regularly, rigorous quantitative analyses of these data are seldom performed, and the data are infrequently used directly to drive institutional change.
Theoretical Framework
A change framework has grounded the goals of a graduate student-led, stakeholder supported, grassroots initiative to shift the academic climate of the University of California, Berkeley Department of Chemistry in a positive direction. This framework requires: (1) making longitudinal data collection an institutional priority, to diagnose specific problems within a department’s academic climate;33 (2) empowering committed administrative and graduate student leadership for the collaborative design and implementation of targeted, evidence-based interventions; (3) institutionalizing the developed interventions so they can persist through institutional or leadership disruptions (e.g. COVID-19 pandemic); and (4) soliciting regular feedback via annual data collection, to monitor the department climate and determine whether the interventions are effective.3 The application of this theory of change has successfully enabled us to address the following research questions:
-
1.
Can longitudinal changes in academic climate be quantified?
-
2.
Have perceptions of academic climate improved as data-driven interventions have been implemented?
To the best of our knowledge, no other large-scale, coordinated, longitudinal efforts to improve a STEM department climate exist. Thus, the approach we use, and the results presented herein, expand the scope of foundational knowledge and existing methods for improving academic culture in a quantitative way.
Results
Since 2018, graduate students in the Department of Chemistry at the University of California, Berkeley, have been leading efforts to assess the issues that affect diversity, equity, and inclusion within their department using the change process approach. The first of these efforts is an annual department academic climate survey—designed to obtain data indicative of the department sentiment on key issues affecting inclusion, diversity, and well-being among graduate students, postdoctoral researchers, and faculty—which has been administered every spring since 2018.33 The main themes of the core climate survey questions are presented in Table 1. The full survey can be found in the Supporting Information (SI).
Table 1. Climate Survey Question Themesa.
| Academic Climate Survey Themes |
|---|
| Advisor interactions: research (graduate student/postdoctoral researcher survey) |
| Advisor interactions: nonresearch (graduate student/postdoctoral researcher survey) |
| Non-advisor faculty interactions: research (graduate student/postdoctoral researcher survey) |
| Non-advisor faculty interactions: nonresearch (graduate student/postdoctoral researcher survey) |
| Advisee interactions (faculty survey) |
| Peer and community interactions (both graduate student/postdoctoral researcher and faculty surveys) |
| Inclusion of URGs (both graduate student/postdoctoral researcher and faculty surveys) |
| Did you notice interventions since 2018? (both graduate student/postdoctoral researcher and faculty surveys) |
| Open-ended feedback (both graduate student/postdoctoral researcher and faculty surveys) |
| Demographic questions (both graduate student/postdoctoral researcher and faculty surveys) |
Themes specific to either the graduate student/postdoctoral researcher survey or the faculty survey are noted.
The total response rates were 43.1% (2018),33 35.7% (2019), and 39.4% (2020). Graduate student and postdoctoral researcher respondent demographics have been representative of the department population across all 3 years of data (full breakdown in Tables S1–S3), as ∼40% of graduate student and postdoctoral researcher respondents identify as female, and ∼40% of the graduate student researchers in the UC Berkeley Department of Chemistry are female. We note that ∼55% of respondents identified as belonging to underrepresented groups (URGs) across all three climate surveys. While this number is high, our definition of URGs is broad—it includes, but is not limited to, individuals who identify as female; are from underrepresented racial, religious, ethnic, sexual orientation, and international groups; have a disability(ies) (defined as a physical or mental impairment that substantially limits one or more major life activities); and have low socio-economic status.4 Given the underrepresentation of women and racial/ethnic minority scholars in STEM, the term URG was used to enable a general comparison of URG and majority respondent populations, while still maintaining a balanced representation of study participants. Racial/ethnic minority respondent responses are not analyzed separately due to concerns about compromised confidentiality from low total numbers of these students and faculty in the department. It is important to note that we did not collect demographic information from faculty members, as the low numbers of female and minority faculty in the department may compromise respondent confidentiality.
Each year after the climate survey closes, the areas of concern most frequently highlighted by department members in survey responses are compiled and used to ground open, active discussion among community members at the annual ‘Chemistry Department Information and Brainstorming Session’ (cDIBS) forum.33 cDIBS occurs every spring and has been a critical aspect of our academic climate initiative because it encourages community members to collaboratively generate practical solutions to the issues that are revealed in our department’s own data.26,33 cDIBS is attended by a range of stakeholders (graduate students, faculty, postdocs, and staff), which enables rapid implementation and institutionalization of the new initiatives and interventions that result from this event every year (more details in the SI and Figure S1).
Interventions
Since 2018, the following evidence-based interventions have been designed and implemented to directly combat disparities and increase inclusivity within the Department of Chemistry academic community:
-
1.
Discussions of mental health, cultural adaptation, and student identity are included throughout new graduate student orientation.
-
2.
The graduate student handbook has been updated to include a comprehensive overview of the departmental policies and resources for students who do not pass their qualifying exam or decide to leave the program, to reduce the stigmas that surround those options.
-
3.
We have institutionalized systematic methods by which to incorporate student feedback in the Junior and Senior faculty hiring processes: graduate student search committees are created; these committee members attend the faculty candidate seminars and interview each candidate about their research, mentorship, diversity, service, and teaching; the student committee’s feedback is then compiled and given to the faculty hiring committee. Anecdotal feedback suggests that student involvement in the hiring processes promotes trust among students and faculty.
-
4.
We redesigned the sexual violence and sexual harassment (SVSH) training for new graduate students. As of Fall 2019, all College of Chemistry incoming graduate students attend a peer-led, in-person SVSH prevention workshop during their new student orientation. The workshop includes a small group work component, in which attendees discuss real SVSH scenarios that have happened on the University of California, Berkeley campus. These scenarios are restructured in conjunction with the PATH to Care Center. Within their small groups, workshop attendees assess the problem in each scenario, discuss the underlying structural issues that led to those situations, and brainstorm strategies to resolve the issue. These small group discussions are led by older, trained graduate student facilitators. The practical component of this training structure provides new graduate students with applicable knowledge for responding to SVSH scenarios.
-
5.
We established the Diversity and Inclusion Focus Group (DIFG) series as an intervention to provide a recurring (monthly) space for the Department of Chemistry faculty, graduate students, staff, and postdoctoral researchers to discuss issues within their academic culture. The structure of DIFG is intended to help teach our graduate community about systemic inequities within academia, help shift social norms, and positively influence their confidence when engaging with peers, mentors, and mentees in difficult topics of conversation. The discussion topics are grounded in evidence from the scientific literature and also stem from areas of concern identified by our community in the results of the annual climate survey as necessary for promoting a more diverse and inclusive academic culture. Past DIFG topics include: sexism and racism in science, LGBTQ+ community inclusion, unconscious bias in hiring and letters of recommendation, the ramifications of sexual assault and harassment, mental health, managing work–life balance, and more. The full list of topics is on the CGLC website.35 Since Fall 2019, we have been assessing the impact of DIFGs to obtain a qualitative understanding of their efficacy (SI and Figures S2a–i).
-
6.
Graduate students, alongside the College of Chemistry administration, host an annual crowdfunding campaign to raise awareness of and money for these new initiatives.
While we recognize that many factors can contribute to improved perceptions of the academic climate, these interventions were specifically implemented between the 2018 and 2020 climate surveys. Thus, we speculate that these interventions largely contributed to the resulting, overall positive change in community perceptions of the Berkeley Chemistry academic climate.
Longitudinal Analysis of Academic Climate
Annual department climate survey data have been critical to measuring cultural shifts within the graduate student, postdoc, and faculty communities. Longitudinal analyses were performed on the response distributions from each core survey question, to understand specific shifts in perception of the academic climate from 2018 to 2020. Encouragingly, there were no negative shifts in the data from any survey questions since 2018. Data that revealed a statistically significant increase in perceptions of a given dimension of the academic climate are discussed below. Tables S4 and S5 include the complete dataset of changes in department members’ perception of the Berkeley Chemistry academic climate, from 2018 to 2020.
Equity and Inclusion
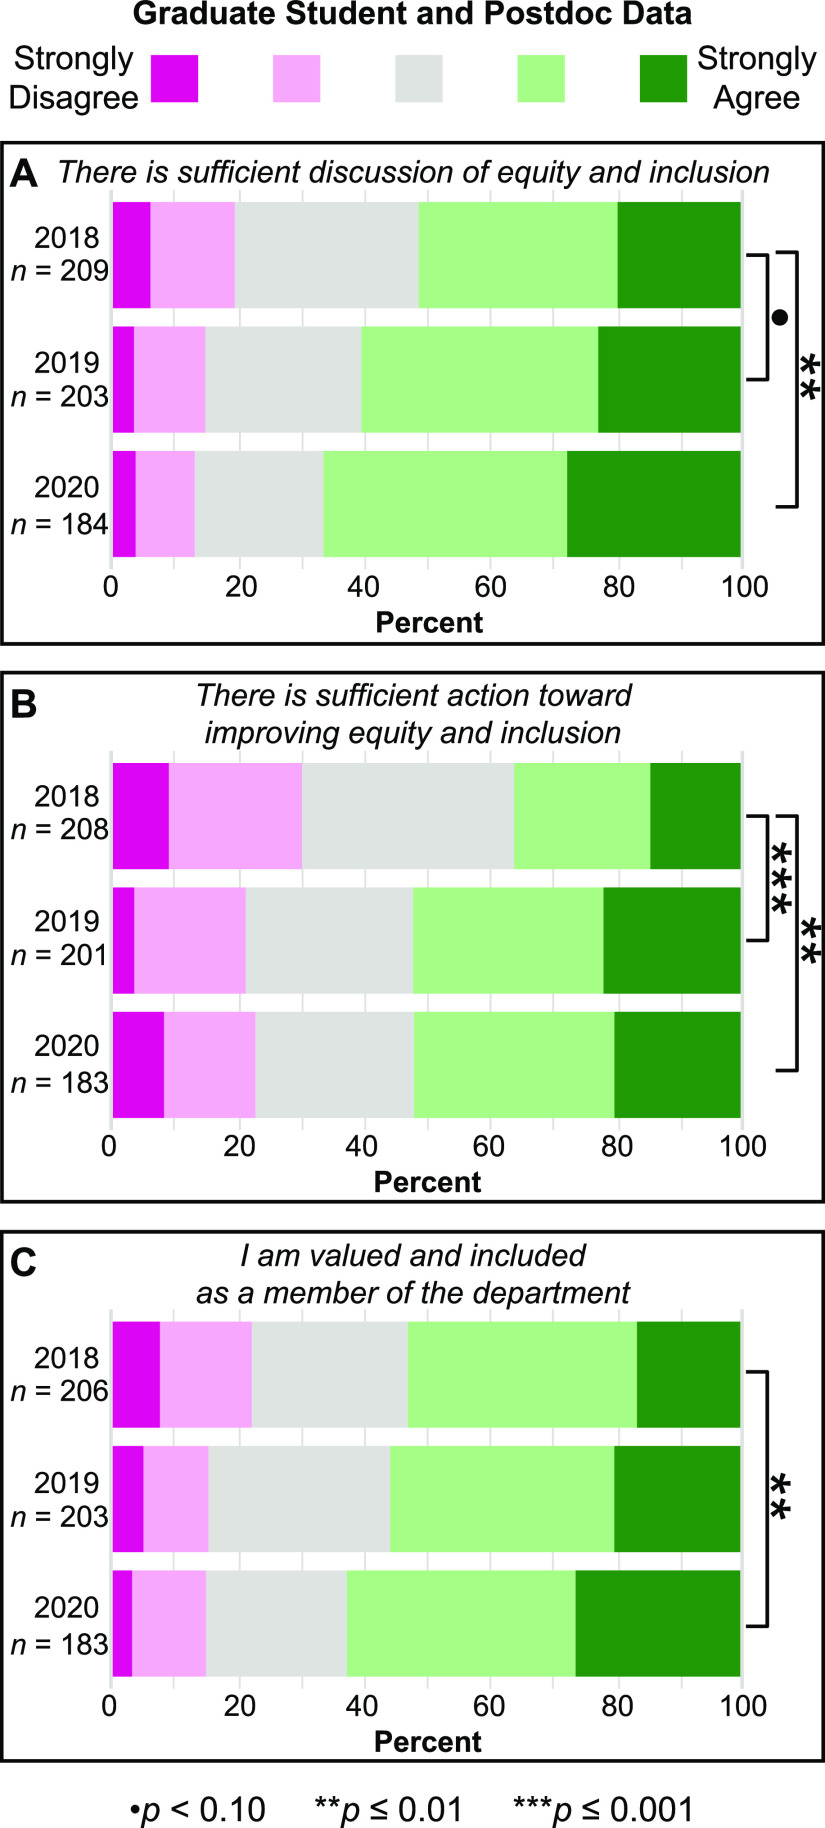
We report a significant increase from 2018 to 2020 in graduate student and postdoctoral researcher perceptions of there being sufficient discussion of equity and inclusion issues (p ≤ 0.01; Figure 1A) and action toward improving equity and inclusion (p ≤ 0.01; Figure 1B). The data also indicate a significant increase in respondent perceptions of feeling valued and included as a member of the department from 2018 to 2020 (p ≤ 0.01; Figure 1C).
Figure 1.
Significant increase in graduate student and postdoctoral researcher perceptions of equity, inclusion, and their sense of value from 2018 to 2020. The entire distribution of responses for three ‘peer and community interactions’ questions, specifically regarding the amount of (A) discussion of equity and inclusion, (B) action toward improving equity and inclusion, and (C) perceptions of feeling valued and included as a member of the department.
These data were further analyzed to determine whether any differences in perception exist between those who identify as belonging to a URG or not across survey years. The results suggest persistent differences in perceptions of inclusion between respondents that belong to URGs and their majority counterparts (Figure 2). This is also true with respect to the department’s overall tolerance of exclusionary behavior and harassment (Figure 2). In 2020, for example, non-URG respondents felt generally more valued and included than respondents belonging to URGs (p ≤ 0.05). Interestingly, not all of these perception gaps existed among 2018 and 2019 respondents. The significant perception gaps between URGs and their majority counterparts in 2018 and 2019 are shown in Figure 2 as well. Data from 2018 and 2019 questions that did not indicate statistically significant differences between URG and non-URG respondents are omitted.
Figure 2.
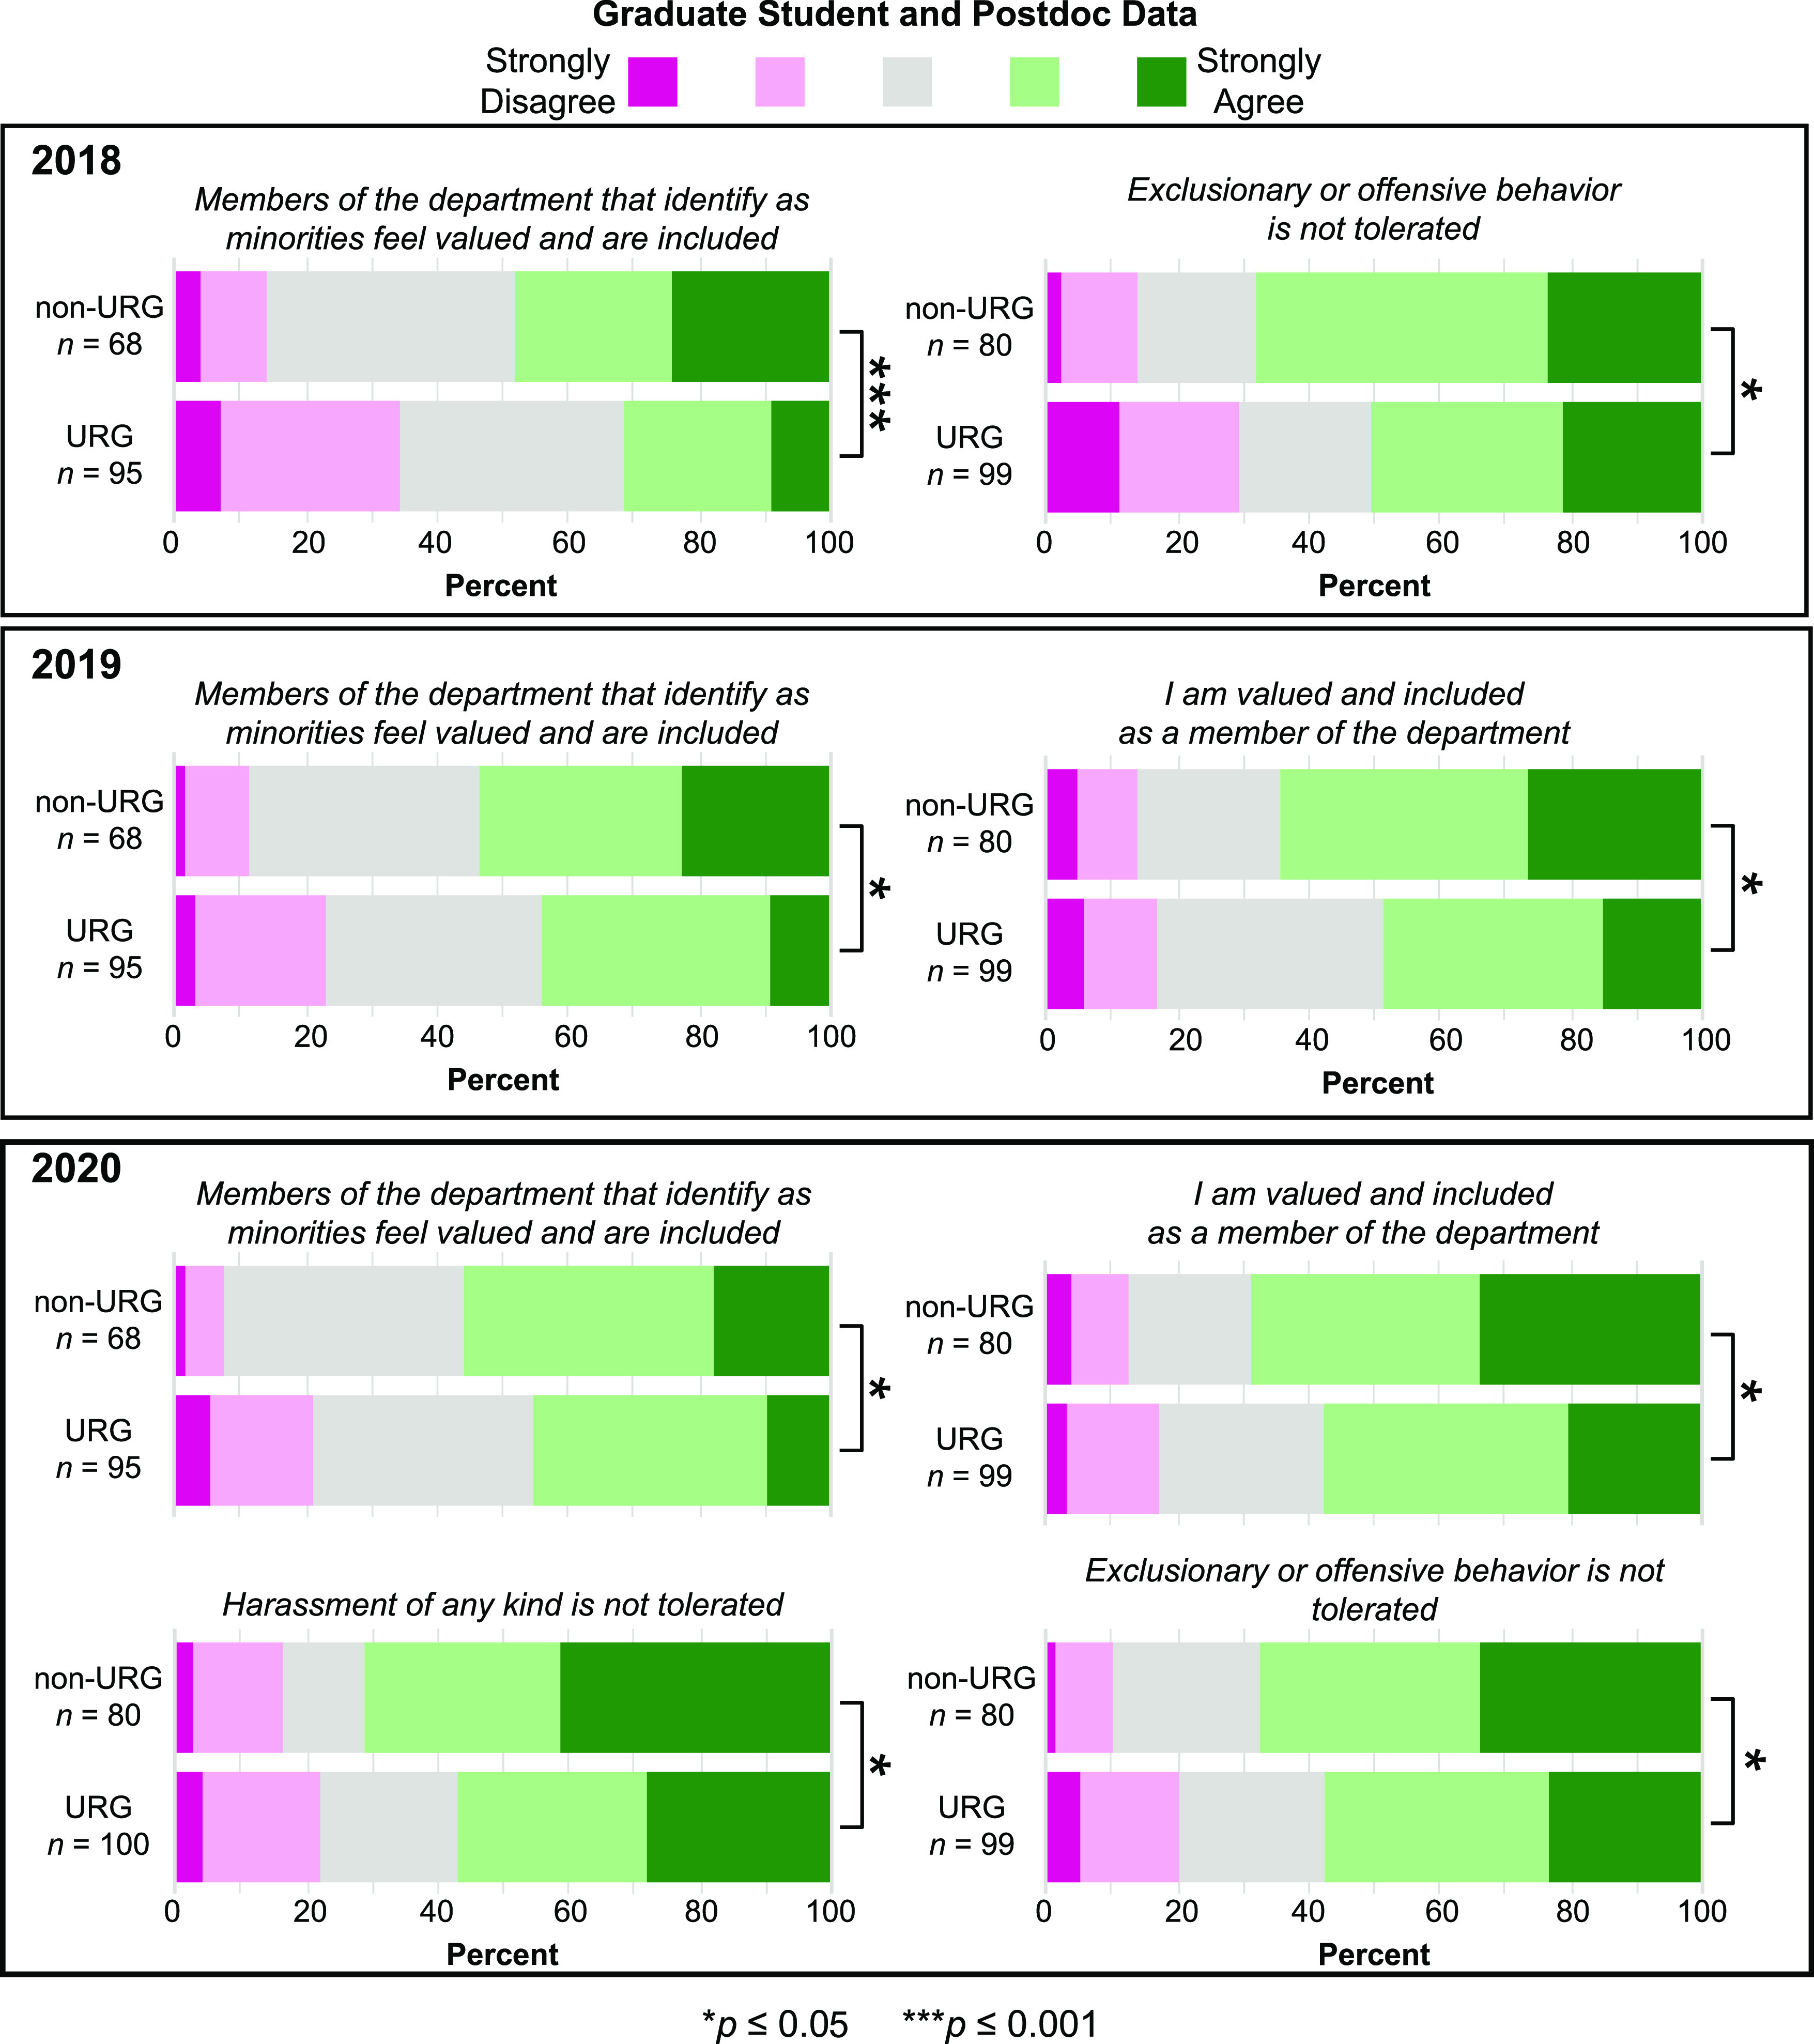
Perception gaps between URG and non-URG respondents. The entire distribution of responses from 2018 (top panel), 2019 (middle panel), and 2020 (bottom panel) climate survey data regarding ‘peer and community interaction’ questions, disaggregated based on URG-identity. Note that “URG” includes both female-identifying and racial/ethnic minority individuals, as the low total numbers of racial/ethnic minority members of the department may compromise confidentiality.
The data also indicate that faculty perceptions of mutual respect, cooperation, and collaboration with their colleagues improved significantly since 2018 (p ≤ 0.05; Table S5). Perceptions that faculty from URGs are treated the same as all other faculty members during the tenure process also increased significantly (p ≤ 0.01; Table S5).
Mentorship and Mental Health
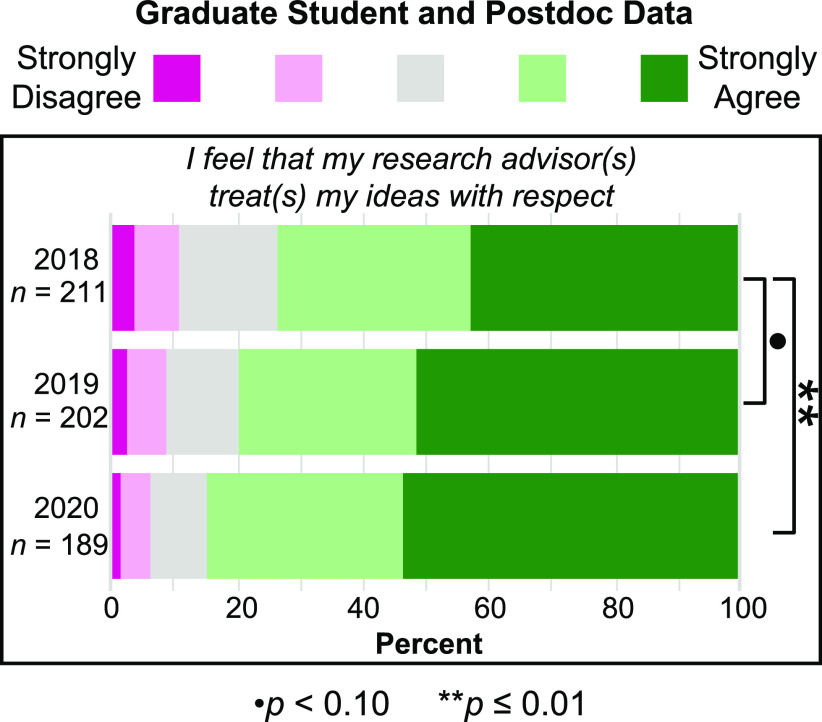
Graduate student and postdoctoral researcher respondents were asked about the research-, career-, and mental health-related support they receive from chemistry faculty. Encouragingly, faculty were generally rated highly in their ability to provide research-related support across all three years of data. There was an increase in mentee perceptions of having a research advisor who treats their ideas with respect (2018–2019, p < 0.10; 2018–2020, p ≤ 0.01; Figure 3). All other mentoring interaction questions showed no statistically significant changes from 2018 to 2020.
Figure 3.
Significant increase since 2018 in graduate student and postdoctoral researcher perceptions of mentors treating their ideas with respect. The entire distributions of responses from each year are compared for this ‘mentor interactions’ question.
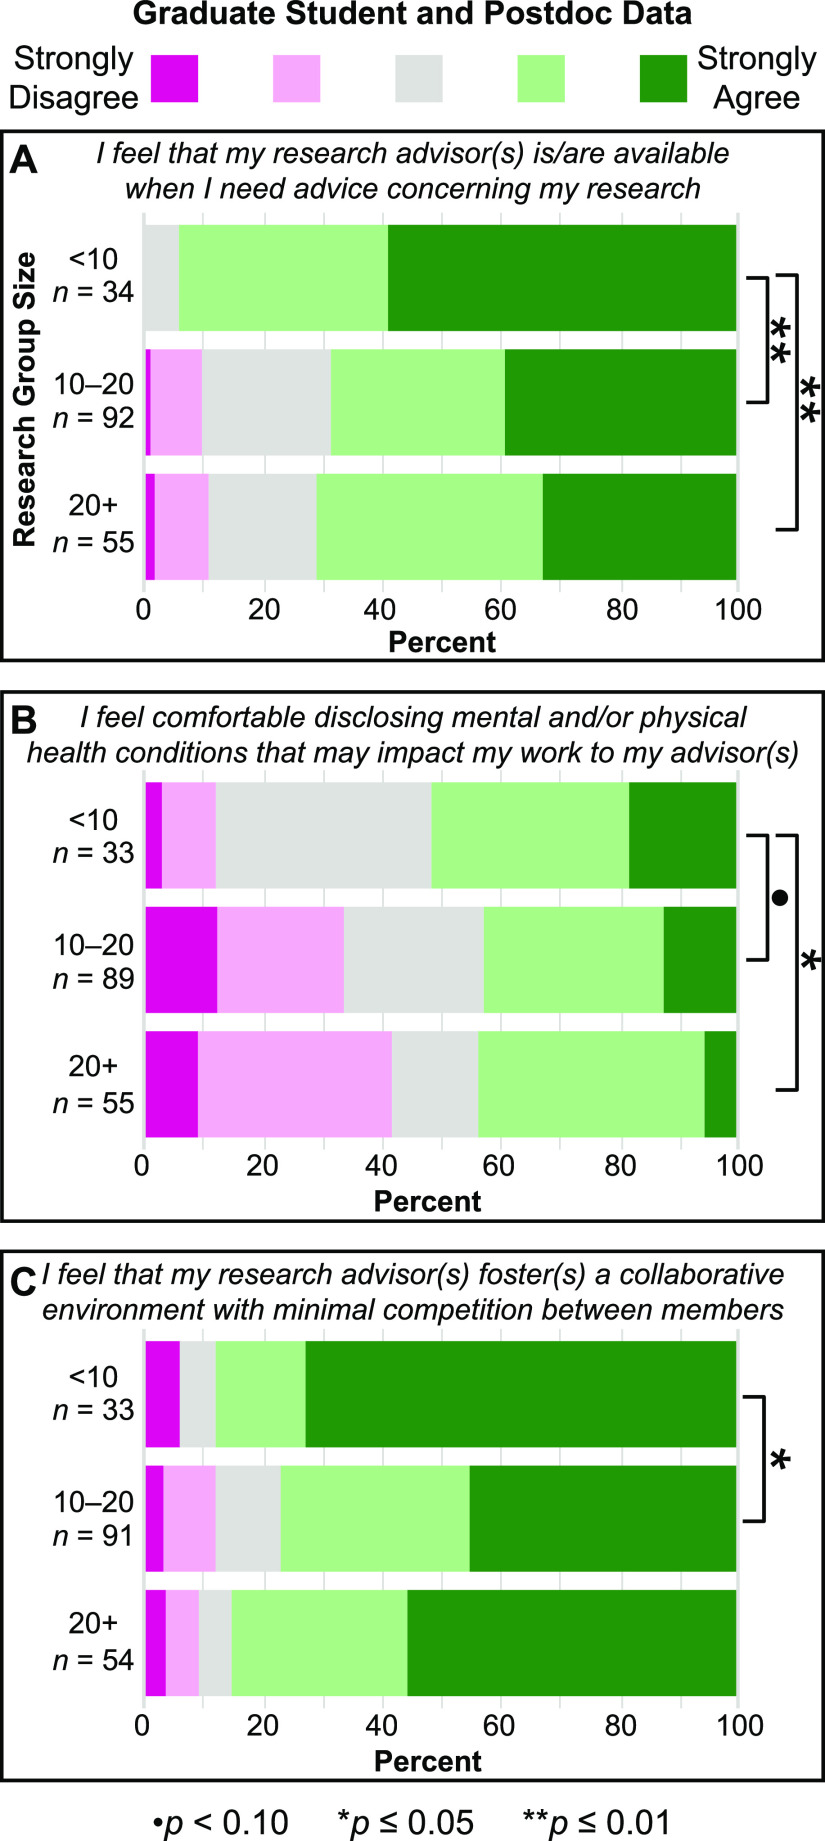
In the 2020 survey, graduate student and postdocs were asked to indicate their research group size (<10: small, 10–20: medium, and 20+: large). Analysis of survey data based on the group size suggested that mentees in small groups agree more strongly than those in medium and large groups that their research advisor(s) are available when they need research advice, and that they feel comfortable disclosing mental and/or physical health conditions to their research advisor(s). Members of small groups agree more strongly than those of medium groups that faculty members foster a more collaborative environment with minimal competition among group members (Figure 4). To the best of our knowledge, the influence of the group size on perceived mentorship and support has not yet been explored in the literature.
Figure 4.
Significant differences in graduate student and postdoctoral researcher perceptions of mentoring interactions, based on the research group size. The entire distribution of responses from 2020 climate survey data regarding (A) advisor availability, (B) level of comfort when disclosing mental and/or physical health conditions to (an) advisor(s), and (C) collaborative environment, disaggregated by the research group size (<10: small, 10–20: medium, and 20+: large).
Department Resources
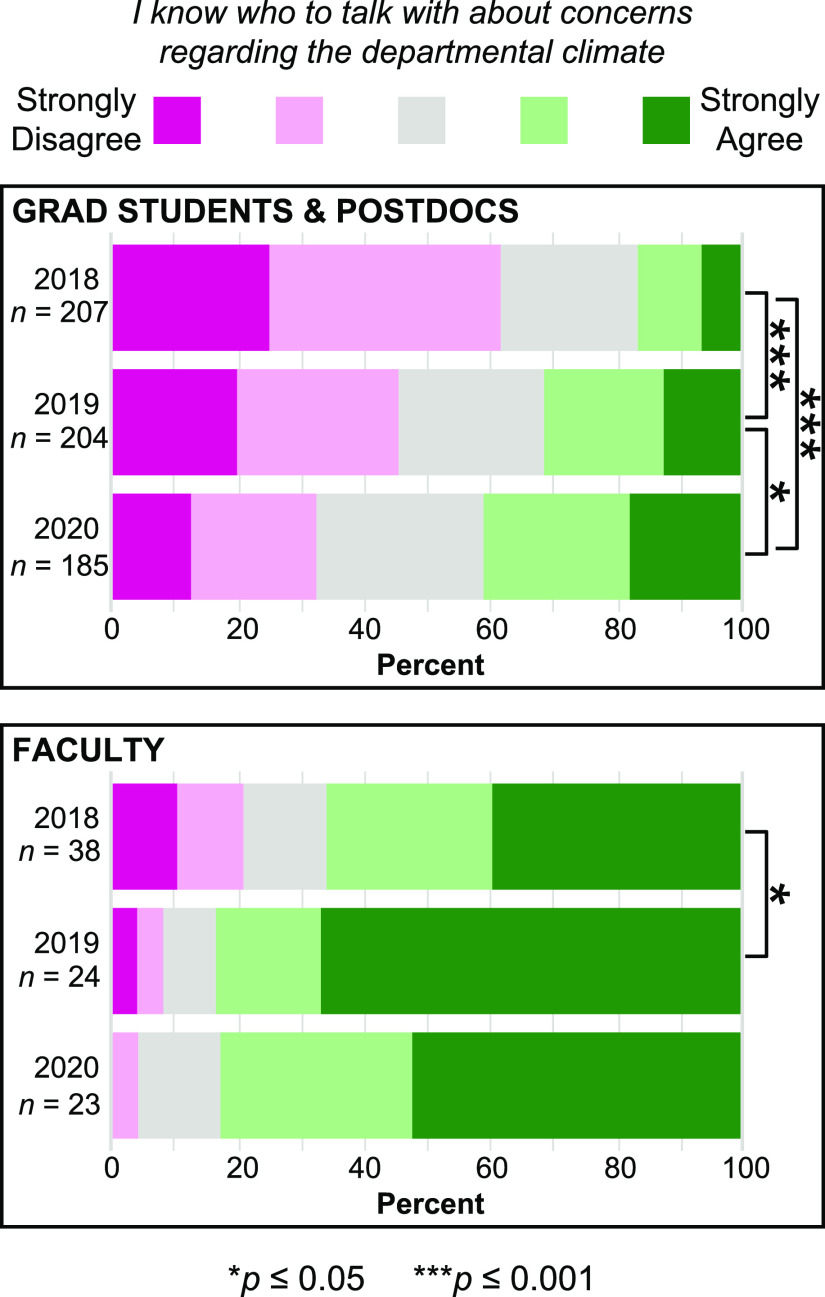
All department members indicated increased knowledge of whom to approach regarding concerns about department climate since 2018 (Figure 5). This knowledge continued to increase significantly for graduate students and postdoctoral researchers from 2019 to 2020.
Figure 5.
Significant increase in all department members’ knowledge of whom to contact regarding department climate concerns from 2018 to 2020. The entire distribution of graduate student and postdoctoral researcher responses (top panel) and faculty responses (bottom panel) for each year of climate survey data.
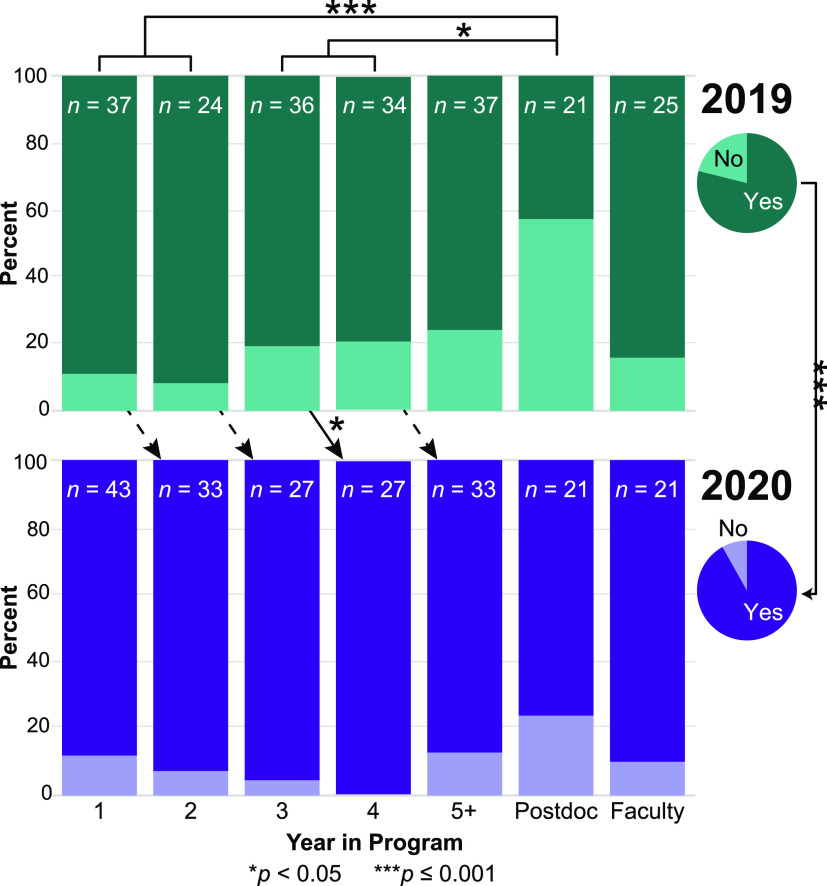
Finally, in the 2019 and 2020 surveys, respondents were asked whether they had noticed the changes implemented (‘Interventions’ section) by the department since 2018 (Figure 6). We highlight an increase (+12.9%; p ≤ 0.001) in the percentage of respondents who noticed changes from 2019 (78.9%) to 2020 (91.8%).
Figure 6.
Graduate student, postdoctoral researcher, and faculty responses to “did you notice [the interventions implemented] since 2018?”. There was a statistically significant increase (by 12.9%; p ≤ 0.001) in the overall percentage of respondents who did notice the changes from 2019 to 2020 (significance indicated by the arrow on the right-hand side). The top-left-to-bottom-right diagonal arrows represent respondents from a single cohort (for example, first years in 2019 and second years in 2020).
Note that there are top-left-to-bottom-right diagonal arrows in Figure 6, which correspond to respondents from a single cohort (for example, first years in 2019 and second years in 2020). There is a statistically significant increase in the percentage of fourth-year graduate students who noticed the changes made to the Ph.D. program by 2020 (third years in Spring 2019; p < 0.05). In general, there is a higher percentage of respondents in each cohort who noticed the interventions in 2020 than in 2019. This trend holds across all cohorts surveyed. We also note that the proportion of postdocs who responded yes to this question almost doubled from 2019 to 2020.
Discussion
Annual department climate survey data have supported the collaborative development of a number of department interventions, including the monthly, student-led Diversity and Inclusion Focus Groups (DIFGs), which began in 2018 and have succeeded in building community among attendees and lowering the barrier to engaging in challenging conversations about mental health, sexism, racism, unconscious bias, and more (Figure S2).35 While we recognize that many factors can contribute to improved perceptions of the academic climate, we speculate that these interventions contributed largely. We also believe that periodic, publicized initiatives (e.g., annual cDIBS event, crowdfunding, and the recent Stachl et al. publication33) have been instrumental in displaying the ongoing commitment to equity and inclusion, as well as ensuring transparency with the department community. Multilevel stakeholder participation in these initiatives, combined with a formative assessment approach to maximizing their efficacy,36,37 has been critical for improving our academic climate. These grassroots methods for creating tailored solutions to departmental concerns are poised to improve graduate community climate more nimbly and precisely than top–down administrative approaches.
Data from the past three years indicate that respondents have felt an increase in their overall sense of value and inclusion within the department. Still, it is clear that URG respondents feel these improvements less strongly than their majority counterparts (Figure 2). While it is heartening that there continues to be near-unanimous agreement that representation should improve at all levels within our department (Figure S1), we must continue efforts to improve the academic climate in order to attract and retain individuals of all identities and from all backgrounds. This is particularly important at the faculty level, as our faculty population currently includes just 18% women. Additionally, it is critical to take further action to educate our community about the biases that negatively affect the experiences of members of historically marginalized groups in STEM. One way to do this is to teach mentors (at all levels, but particularly faculty with large research groups) how to make use of inclusive approaches to mentoring (e.g., active listening, cultural awareness and responsiveness, and how to reflect on biases and prejudices that may impact trust between mentors and mentees—especially those with marginalized identities).3 In a previous sense of belonging study, faculty acknowledged that it is most difficult for them to mentor all of their students effectively, suggesting that improved mentor training would significantly benefit both mentors and mentees.26 Mentor training could also contribute positively to faculty perceptions of how prepared they feel directing mentees to mental and physical health resources on campus, which have not changed since 2018 (Tables S4 and S5).
Allocating resources to understand the experiences of members of historically marginalized groups is key to further improving the academic climate, because such experiences do not stand out when data are collected in aggregate in a predominantly white department.3 The small number of racial/ethnic minority members within our academic community necessitates the aggregation of those data with that of female respondents, which limits investigation of the specific needs of members of historically marginalized groups. In the future, qualitative studies will be carried out to better understand the needs of members of historically marginalized groups and help shape policies to improve their experiences.3 Additionally, reimagining faculty recruitment, evaluation, and promotion can also have a profound effect on diversity and inclusion at all levels—specifically because being mentored by faculty with similar identities can elevate mentees from URGs, helping them develop positive self-perceptions about their academic capabilities.38−40
Overall, perceptions of faculty mentorship have improved since 2018, and there was a significant increase in mentee’s feelings that their research advisor(s) provide(s) emotional support when necessary. While mentees still find it considerably easier to discuss research-related topics with their mentors than to solicit non-academic career support or discuss medical/physical health concerns, our data indicate that being in a small group can make these discussions easier. Therefore, we suggest offering more opportunities for mentorship within larger groups, whether through peer-to-peer mentoring or mentee-non-advisor faculty interactions. Finding a way to formalize and improve mentoring at all levels would not only help accommodate the needs and personalities of more mentees, but may also help students feel more comfortable communicating openly with their mentors about research, career goals, and their general well-being. The latter is particularly important for eliminating stigmas surrounding the discussion of mental health, and may help faculty advisors become more supportive in all facets of mentee development.26,41,42
In response to the 2020 climate survey and cDIBS (Chemistry Department Information and Brainstorming Session; during which these longitudinal data were presented and discussed), the COVID-19 pandemic, and the resurgence of the Black Lives Matter movement, the UC Berkeley College of Chemistry has implemented at least four new interventions to continue making significant forward progress toward a more diverse, inclusive, and equitable academic climate and culture. These include the following: (1) appointing an inaugural Associate Dean for Diversity, Equity, and Inclusion, who is already developing a 5-year strategic diversity, equity, inclusion, and belonging plan; (2) hiring its first Chief Diversity, Equity, and Inclusion Officer, who will continue developing and directing programs to engage faculty, staff, and students at all levels in the ongoing diversity, equity, inclusion, and belonging efforts; (3) institutionalizing a “Graduate Diversity Program”, to provide financial, social, and educational support—as well as College-wide recognition—for graduate students who carry out projects to improve diversity, equity, inclusion, and belonging within the College of Chemistry; and (4) ensuring more frequent discourse between community members at all levels and administrative leadership, particularly concerning the impact of COVID-19 on the Ph.D. program and College as a whole. We are excited to continue this grassroots work and make an enduring impact on the Berkeley Chemistry community.
Conclusions
A foundational principle of this work has been recognizing that there is no one-size-fits-all approach to improve academic climate. Every academic unit is different, every community has a different context from which to begin effecting change, and every institution’s mission, member demographics, needs, and resource constraints vary greatly. Thus, we recommend using a readily adaptable change framework and strongly encourage others to adopt strategies suitable for their culture, institutional memory, and community’s personality. Our results also suggest that several years of purposeful actions are necessary for noticeable changes to occur. Thus, academic units must commit to reiterating the change process, in order to successfully address issues that are unique to their community.3
Rather than using top–down administrative efforts to change policy, we rely on a community-driven, holistic approach to diagnose and remedy pressing issues within our academic climate. This systematic cycle of identifying problems, implementing solutions, and tracking change over time, combined with having a consistent, representative survey respondent population, provides a comprehensive approach to using data intentionally and developing evidence-based interventions to make academic communities more inclusive. These community-driven efforts have supported a measurable, positive change in our academic climate since 2018. We envision that these methods can act as a template for any doctorate-granting department to use while working to assess and improve their academic climate.
Methods
Academic Climate Survey Instrument
The academic climate survey used in this study has been modified slightly from the original instrument designed by Stachl et al.33 to assesses the experiences of graduate students, postdoctoral researchers, and faculty within the Department of Chemistry at the University of California, Berkeley.33 Graduate students and postdoctoral researchers took one version of the academic climate survey, and the faculty took a different version. The content of the faculty survey mirrors that of the graduate student and postdoctoral researcher survey but from the perspective of a faculty member. The full survey can be found in the Supporting Information (SI).
Twenty-five questions in the graduate student and postdoctoral researcher survey, and 18 questions in the faculty survey, were measured on a 5-point Likert scale (1 = Strongly Disagree, 5 = Strongly Agree), and six questions were measured on a 3-point Likert scale (1 = Not Important, 2 = Somewhat Important, 3 = Very Important). Twenty-one and 15 of these questions, respectively, were identical across all 3 years of survey data collected to enable a longitudinal comparison of data and changes of the perception of department climate over time. The remaining, non-core survey data were added to the 2020 survey, to assess the publication culture within our department. These data are beyond the scope of this manuscript. All survey items were coded so that a higher score indicates a more positive perception or experience of the academic climate within our community.
Additionally, the following questions were added to the survey in 2019 to gauge whether the administrative changes to the Department of Chemistry that have been implemented since the inception of the academic climate initiative have been noticed by the community:
“Since the 2018 and 2019 climate surveys, the Chemistry Graduate Life Committee (CGLC) and Department of Chemistry administration have worked together to:
Update the first-year handbook
Ensure discussions of mental health were incorporated into Fall orientation
Incorporate graduate student input in the faculty hiring process
Ensure non-alcoholic beverages and snacks in our weekly chemistry social hour (Chem Keg)
Incorporated peer-led sexual violence and sexual harassment training into new student orientation
Established a monthly diversity and inclusion focus group
Did you notice any of these changes?” (yes/no response choices) and “Do you have any feedback regarding the changes listed above?” (open-ended question).
The reliability of our academic climate survey was evaluated using the item response theory43 and has a value of 0.84. This indicates that the items in this survey relate to each other and do provide a reliable measure of academic climate across all 3 years of data collection.44,45 More information is provided in the SI.
Academic Climate Survey Administration
The surveys were fielded using the Qualtrics LLC platform. They were administered confidentially and distributed electronically via email to all graduate students, postdoctoral researchers, and faculty in the UC Berkeley Department of Chemistry using the “individual link” function in Qualtrics during the Spring semester of every academic year. The “anonymize responses” function in Qualtrics was used to retroactively delete all identifying information from survey responses. Additionally, since 2019, a departmental survey “release party” has been hosted—with free coffee, snacks, and sweets—to incentivize survey participation. All other details of the survey administration are the same as those reported by Stachl et al.33 This longitudinal study was authorized by the University of California, Berkeley institutional review board, protocol ID#2019-01-11732. All survey respondents were informed that completion of the surveys is voluntary, and they all completed informed consent.
Longitudinal Data Analysis
The 2018 data used in this study were previously published by Stachl et al.33 “Prefer not to answer” data was omitted from our analysis, and nonbinary gender responses were removed from the gender category because of the low overall number of responses. We note that the term “URG” as used in this paper inclusive of both female-identifying and racial/ethnic minority populations. We did not separate these populations’ data due to concerns about compromising confidentiality from low total numbers of racial/ethnic minority trainees. Additionally, we did not collect demographic information from faculty members, as low overall numbers of faculty in the department may compromise the confidentiality of responses. We also note that 2020 data were collected prior to the mandated shelter-in-place order in California due to the COVID-19 pandemic.
The Kruskal–Wallis H test (nonparametric significance test for ordinal data with 3+ independent variables) was used to carry out longitudinal comparison of data by question, and the Mann Whitney U test (nonparametric significance test for ordinal data with 2 independent variables) was used to compare demographic data for any given question within 1 year’s dataset. In cases where pairwise comparisons are included, the Kruskal–Wallis H test was carried out on the entire dataset; if this analysis indicated that the distributions are not the same for each independent group (p < 0.05), then pairwise comparisons were carried out using the Mann Whitney U Test to determine the significance level between two groups within the dataset. All of these statistical analyses were completed using IBM SPSS Statistics Version 26. In general, changes were considered significant for p ≤ 0.10. Significance values have been adjusted by the Bonferroni correction for multiple tests.
Acknowledgments
This effort would not have been possible without support from the entire Department of Chemistry at UC Berkeley. We would specifically like to thank Dr. Emily Hartman Guthrie for her contributions to this work at the start of our diversity, equity, inclusion, and belonging initiative and for her support since then; all of the members of the Chemistry Graduate Life Committee (CGLC); the cDIBS planning committee and group discussion leaders; and the Diversity and Inclusion Focus Group (DIFG) team and Prof. Karen Draney for providing advice and support. Publication made possible in part by support from the Berkeley Research Impact Initiative (BRII) sponsored by the UC Berkeley Library. C.N.S. was supported by the Ford Foundation predoctoral fellowship program and the National Academies of Sciences, Engineering, and Medicine, the administrative agency for the Ford fellowship program. J.M.G. was supported by the UC Berkeley Chancellor’s Fellowship for Graduate Study, administered through UC Berkeley Graduate Division. This material is based upon work supported by the National Science Foundation under Grant Nos. DGE 1752814 and CHE 1808189. Any opinions, findings, and conclusions or recommendations expressed in this material are those of the author(s) and do not necessarily reflect the views of the National Science Foundation.
Supporting Information Available
The Supporting Information is available free of charge at https://pubs.acs.org/doi/10.1021/acsomega.1c01305.
Full academic climate survey; survey reliability data and analysis; study participant demographic breakdown; details of institutionalized initiatives since 2018; table of changes in perception of academic climate (2018–2020); and details of Diversity and Inclusion Focus Group (DIFG) assessment (PDF)
Anonymized faculty respondent dataset generated and analyzed during this study (XLSX)
Anonymized graduate student and postdoctoral researcher respondent dataset generated and analyzed during this study (XLSX)
Author Present Address
¶ Department of Chemistry, University of California, Berkeley, 497 Tan Hall, Berkeley, California 94720-1460, United States.
Author Contributions
◆ C.N.S., D.D.B., and H.M. contributed equally to this work.
The authors declare no competing financial interest.
Supplementary Material
References
- National Science Foundation. National Center for Science and Engineering Statistics: Scientists and Engineers Statistical Data System Surveys, 2013. https://ncsesdata.nsf.gov/us-workforce/2013/ (accessed March 15, 2020).
- National Science Foundation. National Center for Science and Engineering Statistics: National Survey of College Graduates, 2017. https://nsf.gov/statistics/2020/nsf20300/ (accessed March 15, 2020).
- National Academies of Sciences, Engineering, and Medicine. Promising Practices for Addressing the Underrepresentation of Women in Science, Engineering, and Medicine: Opening Doors; Colwell R.; Bear A.; Helman A., Eds.; The National Academies Press: Washington, DC, 2020. [PubMed] [Google Scholar]
- National Science Foundation. Women, Minorities, and Persons with Disabilities in Science and Engineering, 2017.
- Shen H. Inequality Quantified: Mind the Gender Gap. Nature 2013, 495, 22–24. 10.1038/495022a. [DOI] [PubMed] [Google Scholar]
- Open Chemistry Collaborative in Diversity Equity (OXIDE) Faculty Demographics Data Releases.http://oxide.jhu.edu/2/demographics. Accessed 2021-05-20.
- Moss-Racusin C. A.; Dovidio J. F.; Brescoll V. L.; Graham M. J.; Handelsman J. Science Faculty’s Subtle Gender Biases Favor Male Students. Proc. Natl. Acad. Sci. U.S.A. 2012, 109, 16474–16479. 10.1073/pnas.1211286109. [DOI] [PMC free article] [PubMed] [Google Scholar]
- Finson K. D.; Beaver J. B.; Cramond B. L. Development and Field Test of a Checklist for the Draw-A-Scientist Test. Sch. Sci. Math. 1995, 95, 195–205. 10.1111/j.1949-8594.1995.tb15762.x. [DOI] [Google Scholar]
- Cheryan S.; Master A.; Meltzoff A. N. Cultural Stereotypes as Gatekeepers: Increasing Girls’ Interest in Computer Science and Engineering by Diversifying Stereotypes. Front. Psychol. 2015, 6, 49 10.3389/fpsyg.2015.00049. [DOI] [PMC free article] [PubMed] [Google Scholar]
- Master A.; Cheryan S.; Meltzoff A. N. Computing Whether She Belongs: Stereotypes Undermine Girls’ Interest and Sense of Belonging in Computer Science. J. Educ. Psychol. 2016, 108, 424–437. 10.1037/edu0000061. [DOI] [Google Scholar]
- Cheryan S.; Ziegler S. A.; Montoya A. K.; Jiang L. Why Are Some STEM Fields More Gender Balanced than Others?. Psychol. Bull. 2017, 143, 1–35. 10.1037/bul0000052. [DOI] [PubMed] [Google Scholar]
- Nosek B. A.; Banaji M. R.; Greenwald A. G. Harvesting Implicit Group Attitudes and Beliefs from a Demonstration Web Site. Group Dyn. 2002, 6, 101–115. 10.1037/1089-2699.6.1.101. [DOI] [Google Scholar]
- Gaertner S. L.; McLaughlin J. P. Racial Stereotypes: Associations and Ascriptions of Positive and Negative Characteristics. Soc. Psychol. Q. 1983, 46, 23–30. 10.2307/3033657. [DOI] [Google Scholar]
- Dovidio J. F.; Evans N.; Tyler R. B. Racial Stereotypes: The Contents of Their Cognitive Representations. J. Exp. Soc. Psychol. 1986, 22, 22–37. 10.1016/0022-1031(86)90039-9. [DOI] [Google Scholar]
- Chanderbhan-Forde S.; Heppner R. S.; Borman K. M. “The Doors Are Open” but They Don’t Come in: Cultural Capital and the Pathway to Engineering Degrees for Women. J. Women Minor. Sci. Eng. 2012, 18, 179–198. 10.1615/JWomenMinorScienEng.2012004190. [DOI] [Google Scholar]
- Kulis S.; Sicotte D.; Collins S. More than a Pipeline Problem: Labor Supply Constraints and Gender Stratification across Academic Science Disciplines. Res. Higher Educ. 2002, 43, 657–691. 10.1023/A:1020988531713. [DOI] [Google Scholar]
- Clancy K. B. H.; Lee K. M. N.; Rodgers E. M.; Richey C. Double Jeopardy in Astronomy and Planetary Science: Women of Color Face Greater Risks of Gendered and Racial Harassment. J. Geophys. Res.: Planets 2017, 122, 1610–1623. 10.1002/2017JE005256. [DOI] [Google Scholar]
- National Academies of Sciences, Engineering, and Medicine. Sexual Harassment of Women: Climate, Culture, and Consequences in Academic Sciences, Engineering, and Medicine; Johnson P. A.; Widnall S. E.; Benya F. F., Eds.; The National Academies Press: Washington, DC, 2018. [PubMed] [Google Scholar]
- Aycock L. M.; Hazari Z.; Brewe E.; Clancy K. B. H.; Hodapp T.; Goertzen R. M. Sexual Harassment Reported by Undergraduate Female Physicists. Phys. Rev. Phys. Educ. Res. 2019, 15, 010121 10.1103/PhysRevPhysEducRes.15.010121. [DOI] [Google Scholar]
- Tran N.; Hayes R. B.; Ho I. K.; Crawford S. L.; Chen J.; Ockene J. K.; Bond M.; Rayman P.; Dean B.; Smith S.; Thorndyke L.; Frankin P.; Plummer D.; Pbert L. Perceived Subtle Gender Bias Index: Development and Validation for Use in Academia. Psychol. Women Q. 2019, 43, 509–525. 10.1177/0361684319877199. [DOI] [Google Scholar]
- Greene J.; Stockard J.; Lewis P.; Richmond G. Is the Academic Climate Chilly? The Views of Women Academic Chemists. J. Chem. Educ. 2010, 87, 381–385. 10.1021/ed800042z. [DOI] [Google Scholar]
- Bronstein P.; Farnsworth L. Gender Differences in Faculty Experiences of Interpersonal Climate and Processes for Advancement. Res. Higher Educ. 1998, 39, 557–585. 10.1023/A:1018701722855. [DOI] [Google Scholar]
- Settles I. H.; Cortina L. M.; Malley J.; Stewart A. J. The Climate for Women in Academic Science: The Good, the Bad, and the Changeable. Psychol. Women Q. 2006, 30, 47–58. 10.1111/j.1471-6402.2006.00261.x. [DOI] [Google Scholar]
- Milkman K. L.; Akinola M.; Chugh D. What Happens before? A Field Experiment Exploring How Pay and Representation Differentially Shape Bias on the Pathway into Organizations. J. Appl. Psychol. 2015, 100, 1678–1712. 10.1037/apl0000022. [DOI] [PubMed] [Google Scholar]
- Newsome J. L.The Chemistry PhD: The Impact on Women’s Retention; UK Resource Centre for Women in SET and the Royal Society of Chemistry: London, 2008. [Google Scholar]
- Stachl C. N.; Baranger A. M. Sense of Belonging within the Graduate Community of a Research-Focused STEM Department: Quantitative Assessment Using a Visual Narrative and Item Response Theory. PLoS One 2020, 15, e0233431 10.1371/journal.pone.0233431. [DOI] [PMC free article] [PubMed] [Google Scholar]
- Eaton A. A.; Saunders J. F.; Jacobson R. K.; West K. How Gender and Race Stereotypes Impact the Advancement of Scholars in STEM: Professors’ Biased Evaluations of Physics and Biology Post-Doctoral Candidates. Sex Roles 2020, 82, 127–141. 10.1007/s11199-019-01052-w. [DOI] [Google Scholar]
- Urry M. Science and Gender: Scientists Must Work Harder on Equality. Nature 2015, 528, 471–473. 10.1038/528471a. [DOI] [PubMed] [Google Scholar]
- Grogan K. E. How the Entire Scientific Community Can Confront Gender Bias in the Workplace. Nat. Ecol. Evol. 2019, 3, 3–6. 10.1038/s41559-018-0747-4. [DOI] [PubMed] [Google Scholar]
- Alper J. The Pipeline Is Leaking Women All the Way Along. Science 1993, 260, 409–411. 10.1126/science.260.5106.409. [DOI] [PubMed] [Google Scholar]
- Bejerano A. R.; Bartosh T. M. Learning Masculinity: Unmasking the Hidden Curriculum in Science, Technology, Engineering, and Mathematics Courses. J. Women Minor. Sci. Eng. 2015, 21, 107–124. 10.1615/JWomenMinorScienEng.2015011359. [DOI] [Google Scholar]
- National Academies of Sciences, Engineering, and Medicine. Graduate STEM Education for the 21st Century; Leshner A.; Scherer L., Eds.; The National Academies Press: Washington, DC, 2018. [Google Scholar]
- Stachl C. N.; Hartman E. C.; Wemmer D. E.; Francis M. B. Grassroots Efforts To Quantify and Improve the Academic Climate of an R1 STEM Department: Using Evidence-Based Discussions To Foster Community. J. Chem. Educ. 2019, 96, 2149–2157. 10.1021/acs.jchemed.9b00163. [DOI] [PMC free article] [PubMed] [Google Scholar]
- Puritty C.; Strickland L. R.; Alia E.; Blonder B.; Klein E.; Kohl M. T.; McGee E.; Quintana M.; Ridley R. E.; Tellman B.; Gerber L. R. Without Inclusion, Diversity Initiatives May Not Be Enough. Science 2017, 357, 1101–1102. 10.1126/science.aai9054. [DOI] [PubMed] [Google Scholar]
- Chemistry Graduate Life Committee. Diversity & Inclusion Focus Groups (DIFG). https://cglc.cchem.berkeley.edu/dewi/difg/ (accessed Dec 21, 2019).
- Coffey J. E.; Hammer D.; Levin D. M.; Grant T. The Missing Disciplinary Substance of Formative Assessment. J. Res. Sci. Teach. 2011, 48, 1109–1136. 10.1002/tea.20440. [DOI] [Google Scholar]
- van den Heuvel-Panhuizen M. The Role of Context in Assessment Problems in Mathematics. Learn. Math. 2005, 25, 2–9. [Google Scholar]
- Jimenez M. F.; Laverty T. M.; Bombaci S. P.; Wilkins K.; Bennett D. E.; Pejchar L. Underrepresented Faculty Play a Disproportionate Role in Advancing Diversity and Inclusion. Nat. Ecol. Evol. 2019, 3, 1030–1033. 10.1038/s41559-019-0911-5. [DOI] [PubMed] [Google Scholar]
- Santos S. J.; Reigadas E. T. Latinos in Higher Education: An Evaluation of a University Faculty Mentoring Program. J. Hispanic Higher Educ. 2002, 1, 40–50. 10.1177/1538192702001001004. [DOI] [Google Scholar]
- Mireles-Rios R.; Garcia N. M. What Would Your Ideal Graduate Mentoring Program Look like?: Latina/o Student Success in Higher Education. J. Latinos Educ. 2019, 18, 376–386. 10.1080/15348431.2018.1447937. [DOI] [Google Scholar]
- The Graduate Assembly. Graduate Student Happiness & Well-Being Report; University of California: Berkeley, 2014.
- Evans T. M.; Bira L.; Gastelum J. B.; Weiss L. T.; Vanderford N. L. Evidence for a Mental Health Crisis in Graduate Education. Nat. Biotechnol. 2018, 36, 282–284. 10.1038/nbt.4089. [DOI] [PubMed] [Google Scholar]
- Wilson M.Constructing Measures: An Item Response Modeling Approach; Lawrence Erlbaum Associates Publishers: New Jersey, 2005. [Google Scholar]
- Bond T. G.; Fox C. M.. Applying the Rasch Model, 2nd ed.; Psychology Press: New York, 2007. [Google Scholar]
- Wright B.; Masters G.. Rating Scale Analysis; MESA Press: Illinois, 1982. [Google Scholar]
Associated Data
This section collects any data citations, data availability statements, or supplementary materials included in this article.


