Abstract
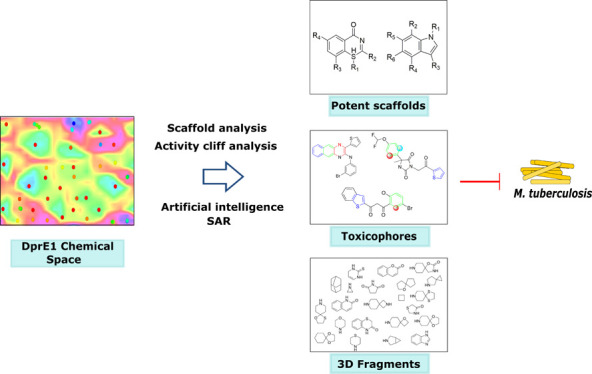
Tuberculosis (TB), entrained by Mycobacterium tuberculosis, continues to be an enfeebling disease, killing nearly 1.5 million people in 2019, with 2 billion people worldwide affected by latent TB. The multidrug-resistant and totally drug-resistant emerging strains further exacerbate the TB infection. The cell wall of bacteria provides critical virulence components such as cell surface proteins, regulators, signal transduction proteins, and toxins. The cell wall biosynthesis pathway of Mycobacterium tuberculosis is exhaustively studied to discover novel drug targets. Decaprenylphosphoryl-β-d-ribose-2′-epimerase (DprE1) is an important enzyme involved in the arabinogalactan biosynthetic pathway of Mycobacterium tuberculosis cell wall and is essential for both latent and persistent bacterial infection. We analyzed all known ∼1300 DprE1 inhibitors to gain deep insights into the chemogenomic space of DprE1-ligand complexes. Physicochemical descriptors of the DprE1 inhibitors showed a marked lipophilic character forming a cluster distinct from the existing TB drugs, as revealed by the principal component analysis. Similarity analysis using Murcko scaffolds and rubber band scaling revealed scarce representation of the chemical space. Further, Murcko scaffold analysis uncovered favorable and unfavorable scaffolds, where benzo and pyridine-based core scaffolds exhibit the highest biological activity, as evidenced by their MIC and IC50 values. Automatic SAR and R-group decomposition analysis resulted in the identification of substructures responsible for the inhibitory activity of the DprE1 enzyme. Further, with activity cliff analysis, we observed prominent discontinuity in the SAR of DprE1 inhibitors, where even simple structural modification in the chemical scaffold resulted in significant potency difference, presumably due to the binding orientation and interaction in the active site. Thiophene, 6-membered aromatic rings, and unsubstituted benzene ring-based toxicophores were identified in the DprE1 chemical space using an artificial intelligence approach based on inductive logic programming. This paper, hence, ushers in new insights for the design and development of potent covalent and non-covalent DprE1 inhibitors and guides hit and lead optimization for the development of non-hazardous small molecule therapeutics for Mycobacterium tuberculosis.
Introduction
Mycobacterium tuberculosis (M. tuberculosis)-entrained tuberculosis (TB) infection is the primary reason for death globally as a result of a single contagious pathogen.1 As reported by the recent WHO Global tuberculosis report (2019), TB resulted in approximately 1.5 million deaths in 2018. The prolonged duration of therapy and the dearth of novel inhibitors with sufficient efficacy have incited the incipience of multidrug-resistant (MDR) and extensive drug-resistant (XDR) TB.2 The concordant cases of drug-resistant tuberculosis and the fatal co-infection3 with human immunodeficiency virus (HIV) further worsen the situation that demands the design and discovery of a new chemical matter with innovative mechanisms of action.
The lipid and carbohydrate-rich unique M. tuberculosis cell wall have many efflux pumps that provide a permeability barrier to many drugs,4 thus conferring multidrug resistance and attributes to the success of M. tuberculosis as a common pathogen. The main structural components of the M. tuberculosis cell wall are the mycolic acids, arabinogalactan polysaccharide, and peptidoglycan layer. The arabinogalactan biopolymers are the basic building blocks required for M. tuberculosis cell wall synthesis.5 As shown previously, Rv3790/Rv3791 (DprE1-DprE2) proteins form an epimerase complex.6 The DprE1 enzyme catalyzes the conversion of the substrate decaprenyl-phospho-β-d-ribose (DPR) to intermediate decaprenyl-phospho-β-2′-keto-d-ribose (DPX). The enzyme DprE2 then catalyzes DPX to product decaprenyl-phospho-β-d-arabinose (DPA). The DPA formed is used exclusively as an activated d-arabinofuranosyl (Araf) substrate for the biosynthesis of arabinogalactan biopolymer of the M. tuberculosis cell wall,7 hence making DprE1 and DprE2 critical proteins for the survival of M. tuberculosis.
Furthermore, there is no alternate pathway of DPX synthesis, as evidenced by the DprE1 knockouts that induce cellular disruption and bacterial death.8 DprE1 knockout studies demonstrate that DprE1 is critical for M. tuberculosis growth and survival; as a consequence, this makes it a suitable drug target. Currently, there are more than 15 chemical classes of DprE1 inhibitors with both covalent and non-covalent binding mechanisms of action. Covalent inhibitors bind to the DprE1 protein irreversibly, forming a covalent adduct with Cys387. Though covalent inhibitors demonstrate efficacy, several non-covalent DprE1 inhibitors have also been described.9 The inhibitors of DprE1 include diverse chemical scaffolds such as azaindoles, aminoquinolones, benzothiazinones, benzothiazoles, dinitrobenzamides, nitrobenzamides, pyrazolopyridines, quinoxalines, triazoles, and thiadiazoles.10 Currently, benzothiazinone derivatives BTZ-043 and PBTZ169 with high efficacy against M. tuberculosis are undergoing phase 2 clinical trials11 followed by a promising non-covalent inhibitor, azaindole TBA-7371, beginning clinical trials.12 These chemical interventions and the vulnerability of DprE113 demonstrate the essentiality of DprE1 and the potentiality for developing small molecule therapeutics for targeting DprE1. Phenotypic and high-throughput screening, molecular docking studies, ligand-protein co-crystallography, protein–ligand interactions, and optimization processes unfolded the majority of potential scaffolds to target DprE1. Thus, there is a need to use chemoinformatics, scaffold analysis, and available structural information to guide scaffold optimization, quantitative structure–activity relationships, and to enhance the pharmacodynamics properties of DprE1 inhibitors. The current study involves the use of detailed chemoinformatics analysis of small molecules to define the chemogenomic space of molecules targeting DprE1. The study entails determining physicochemical characteristics, probing the chemical and biological features, structural similarity analysis of ligands, scaffold and fragment-based analysis, activity cliffs analysis, and dissecting the automatic structure–activity relationships. Further, we employed a machine learning-based tool, DCA (DMax Chemistry Assistant),14 to determine the possible toxicophores in the DprE1 chemical space by using Kazius’ Ames mutagenicity dataset as the mutagenicity model. This chemical space analysis will proffer new insights into the rational design and development of covalent and non-covalent non-hazardous small molecule inhibitors against DprE1.
Results and Discussion
Physicochemical Properties
To assess the pharmaceutical descriptors of compounds active against DprE1, we performed principal component analysis (PCA) based on 10 physicochemical properties on the MIC value dataset and 13 properties on the IC50 value dataset (Figure S1). The three-dimensional PCA plot is a visual representation of the property space generated from the database. Table S1 summarizes the loading value of each property of the MIC value dataset. The highest loading value in the first PC is by lipophilicity (cLogP), and the second PC is primarily by the number of hydrogen acceptors. At the same time, the number of hydrogen donors and drug-likeness were the main contributors for the third PC.
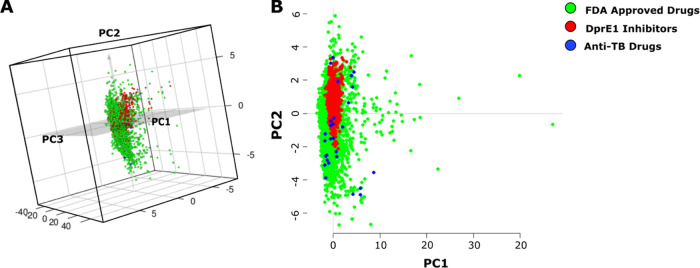
Table S2 summarizes the highest loading values for the IC50 dataset, where lipophilicity-corrected ligand efficiency (LELP) and cLogP contribute mainly to the first PC. The number of hydrogen acceptors was the main contributor for the second PCs, while drug-likeness was the main contributor for the third PCs. The predominant contribution of the LELP among the physicochemical properties implies that the IC50 dataset molecules are notably hydrophobic, and therefore, there is a need for ligand efficiency optimization to enhance the affinity and reduce lipophilicity.15 Furthermore, we performed principal component analysis for comparative assessment of structural and physicochemical properties, namely, molecular weight, lipophilicity, aqueous solubility, number of hydrogen acceptors and donors, total surface area, polar surface area, relative polar surface area, drug-likeness, and rotatable bonds of DprE1 inhibitors (N = 1292), FDA-approved drugs16 (N = 2309), and anti-tuberculosis drugs17 (N = 30). The first three principal components (PCs) capture 86.40% of covariance. Thus, the entire physicochemical property space of DprE1 inhibitors can be represented by these three PCs as a three-dimensional PCA plot (Figure 1). As summarized in Table S3, PC1 is primarily contributed by the number of hydrogen bond acceptors and polar surface area (PSA). PC2 has the highest loadings by lipophilicity, followed by aqueous solubility and relative PSA. As observed in the two-dimensional PCA plot, the existing TB drugs are widely distributed in physicochemical space, majorly along the PC2 axis, with respect to the FDA-approved drugs, which suggests that entirely diverse chemical scaffolds show potency against M. tuberculosis. Additionally, antibacterial molecules are known to be distinctively more polar with increased total polar surface area and lower lipophilicity.18 Further, DprE1 inhibitors form a distinct cluster along the PC3 axis, implying differences in the molecular property space as compared to the approved drugs. For instance, DprE1 inhibitors show a strong hydrophobic character with average cLogP = 2.54 ± 1.48. The introduction of rational downstream chemical modifications to the scaffolds for desired changes in structural and physicochemical properties requires the chemoinformatic knowledge of DprE1 inhibitors’ chemical space as described below.
Figure 1.
(A) PCA-based three-dimensional and (B) two-dimensional property space scatter plot of FDA-approved drugs (green spheres), DprE1 inhibitors (red spheres), and anti-TB drugs (blue spheres) based on 10 2D descriptors.
Scaffold Analysis
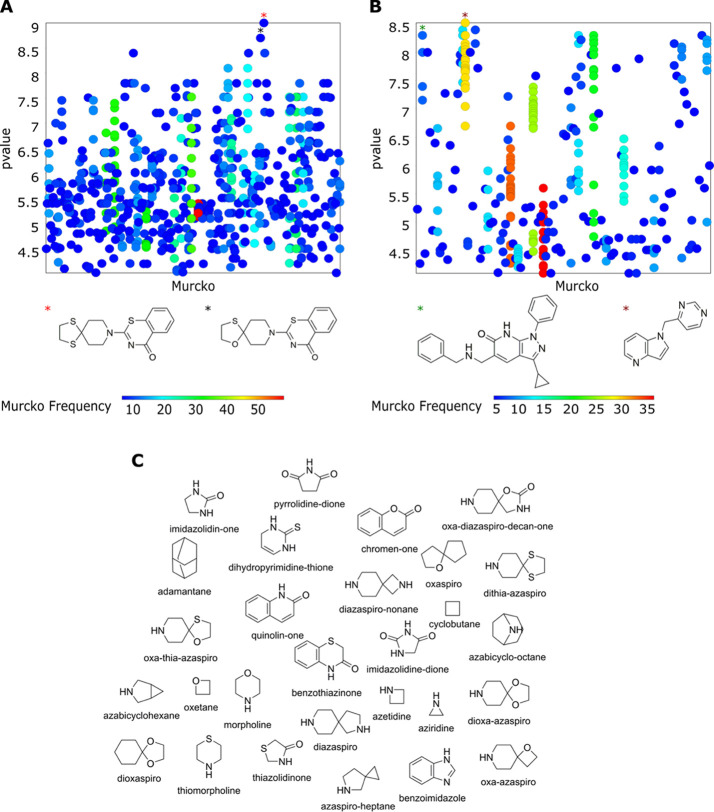
The scaffold analysis decomposes the molecule into a framework (often referred to as the Murcko) and side chains. The Murcko scaffold organized the scaffold diversity of 956 known structures of the MIC dataset into 345 distinct scaffolds and the 336 known structures from the IC50 dataset into 117 distinct scaffolds. Figure 2A,B represents the scaffolds and their corresponding frequencies. Murcko scaffold analysis revealed scaffolds with the highest frequencies to be 53 and 33 among the MIC and IC50 datasets, respectively. Subsequently, the Murcko skeleton scaffold was created, which further generated 183 skeleton scaffolds for MIC and 68 for IC50 datasets. The skeleton scaffold analysis revealed scaffolds with the highest frequency of 135 and 44 among the MIC and the IC50 datasets, respectively. The scaffold diversity is calculated as the proportion of the number of scaffolds to the total number of molecules.19 The diversity analysis of Murcko, Skeleton, and Singleton scaffolds20 of both datasets implies a scant representation of chemical space (Table 1).
Figure 2.
Murcko scaffold structures vs p value scatter plot. (A) MIC value dataset. (B) IC50 value dataset. The frequency of Murcko scaffolds is color-coded, with red representing the highest frequency and blue the lowest frequency. The corresponding scaffolds with the highest frequency are marked by asterisks. (C) Representative examples of three-dimensional parent fragments generated using ECFP6 fingerprint.
Table 1. Scaffold Diversity Analysis of MIC and IC50 Datasetsa.
| dataset (N) | Murcko scaffolds (Ns) | singleton Murcko scaffolds (Nss) | skeleton scaffolds (Nsc) | Nsc/N | Ns/N | Nss/N | Nss/Ns | |
|---|---|---|---|---|---|---|---|---|
| MIC value dataset | 956 | 345 | 218 | 183 | 0.19 | 0.36 | 0.23 | 0.63 |
| IC50 value dataset | 336 | 117 | 78 | 68 | 0.20 | 0.35 | 0.23 | 0.66 |
Nsc/N represents the ratio of Skeleton scaffolds (Nsc) to that of MIC or IC50 dataset (N); Ns/N shows the ratio of Murcko scaffolds (Ns) and MIC or IC50 dataset (N); (Nss/N) shows the ratio of singleton Murcko scaffolds and molecules in MIC or IC50 dataset (N); and (Nss/Ns) represents the proportion of singleton Murcko scaffolds (Nss) to Murcko scaffolds (Ns)
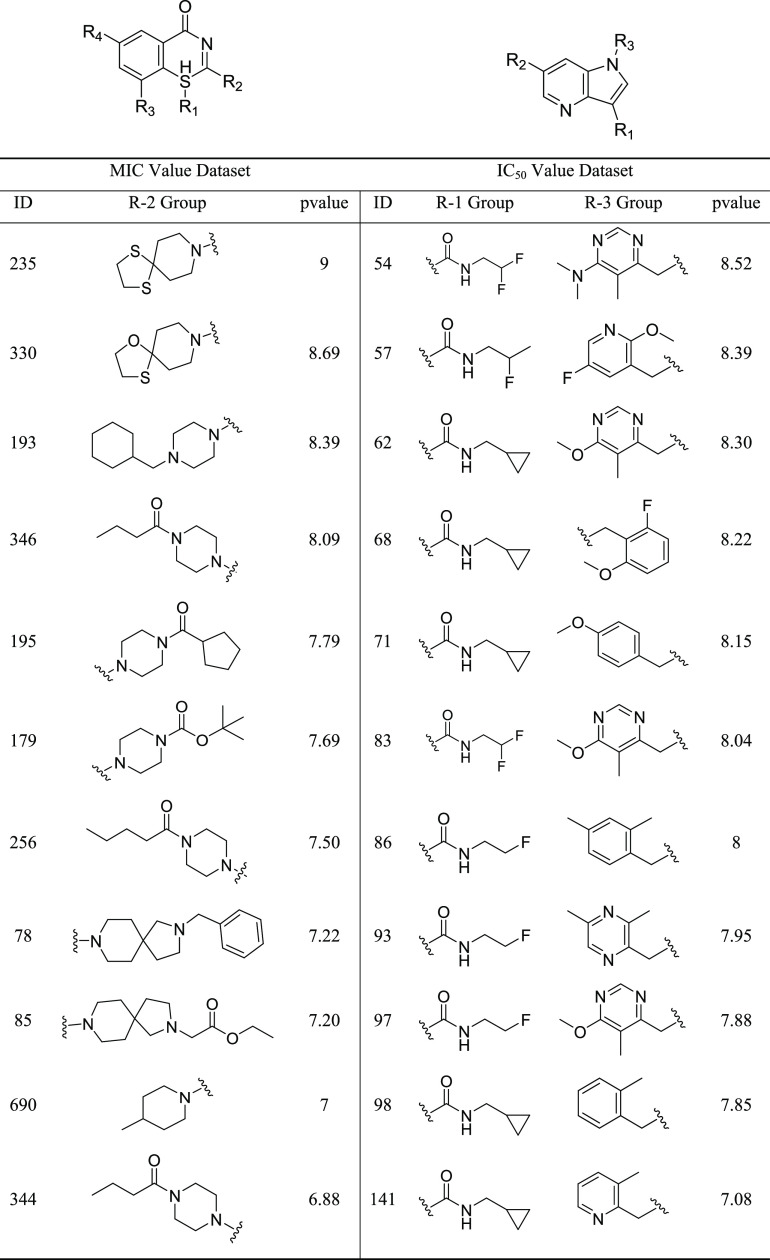
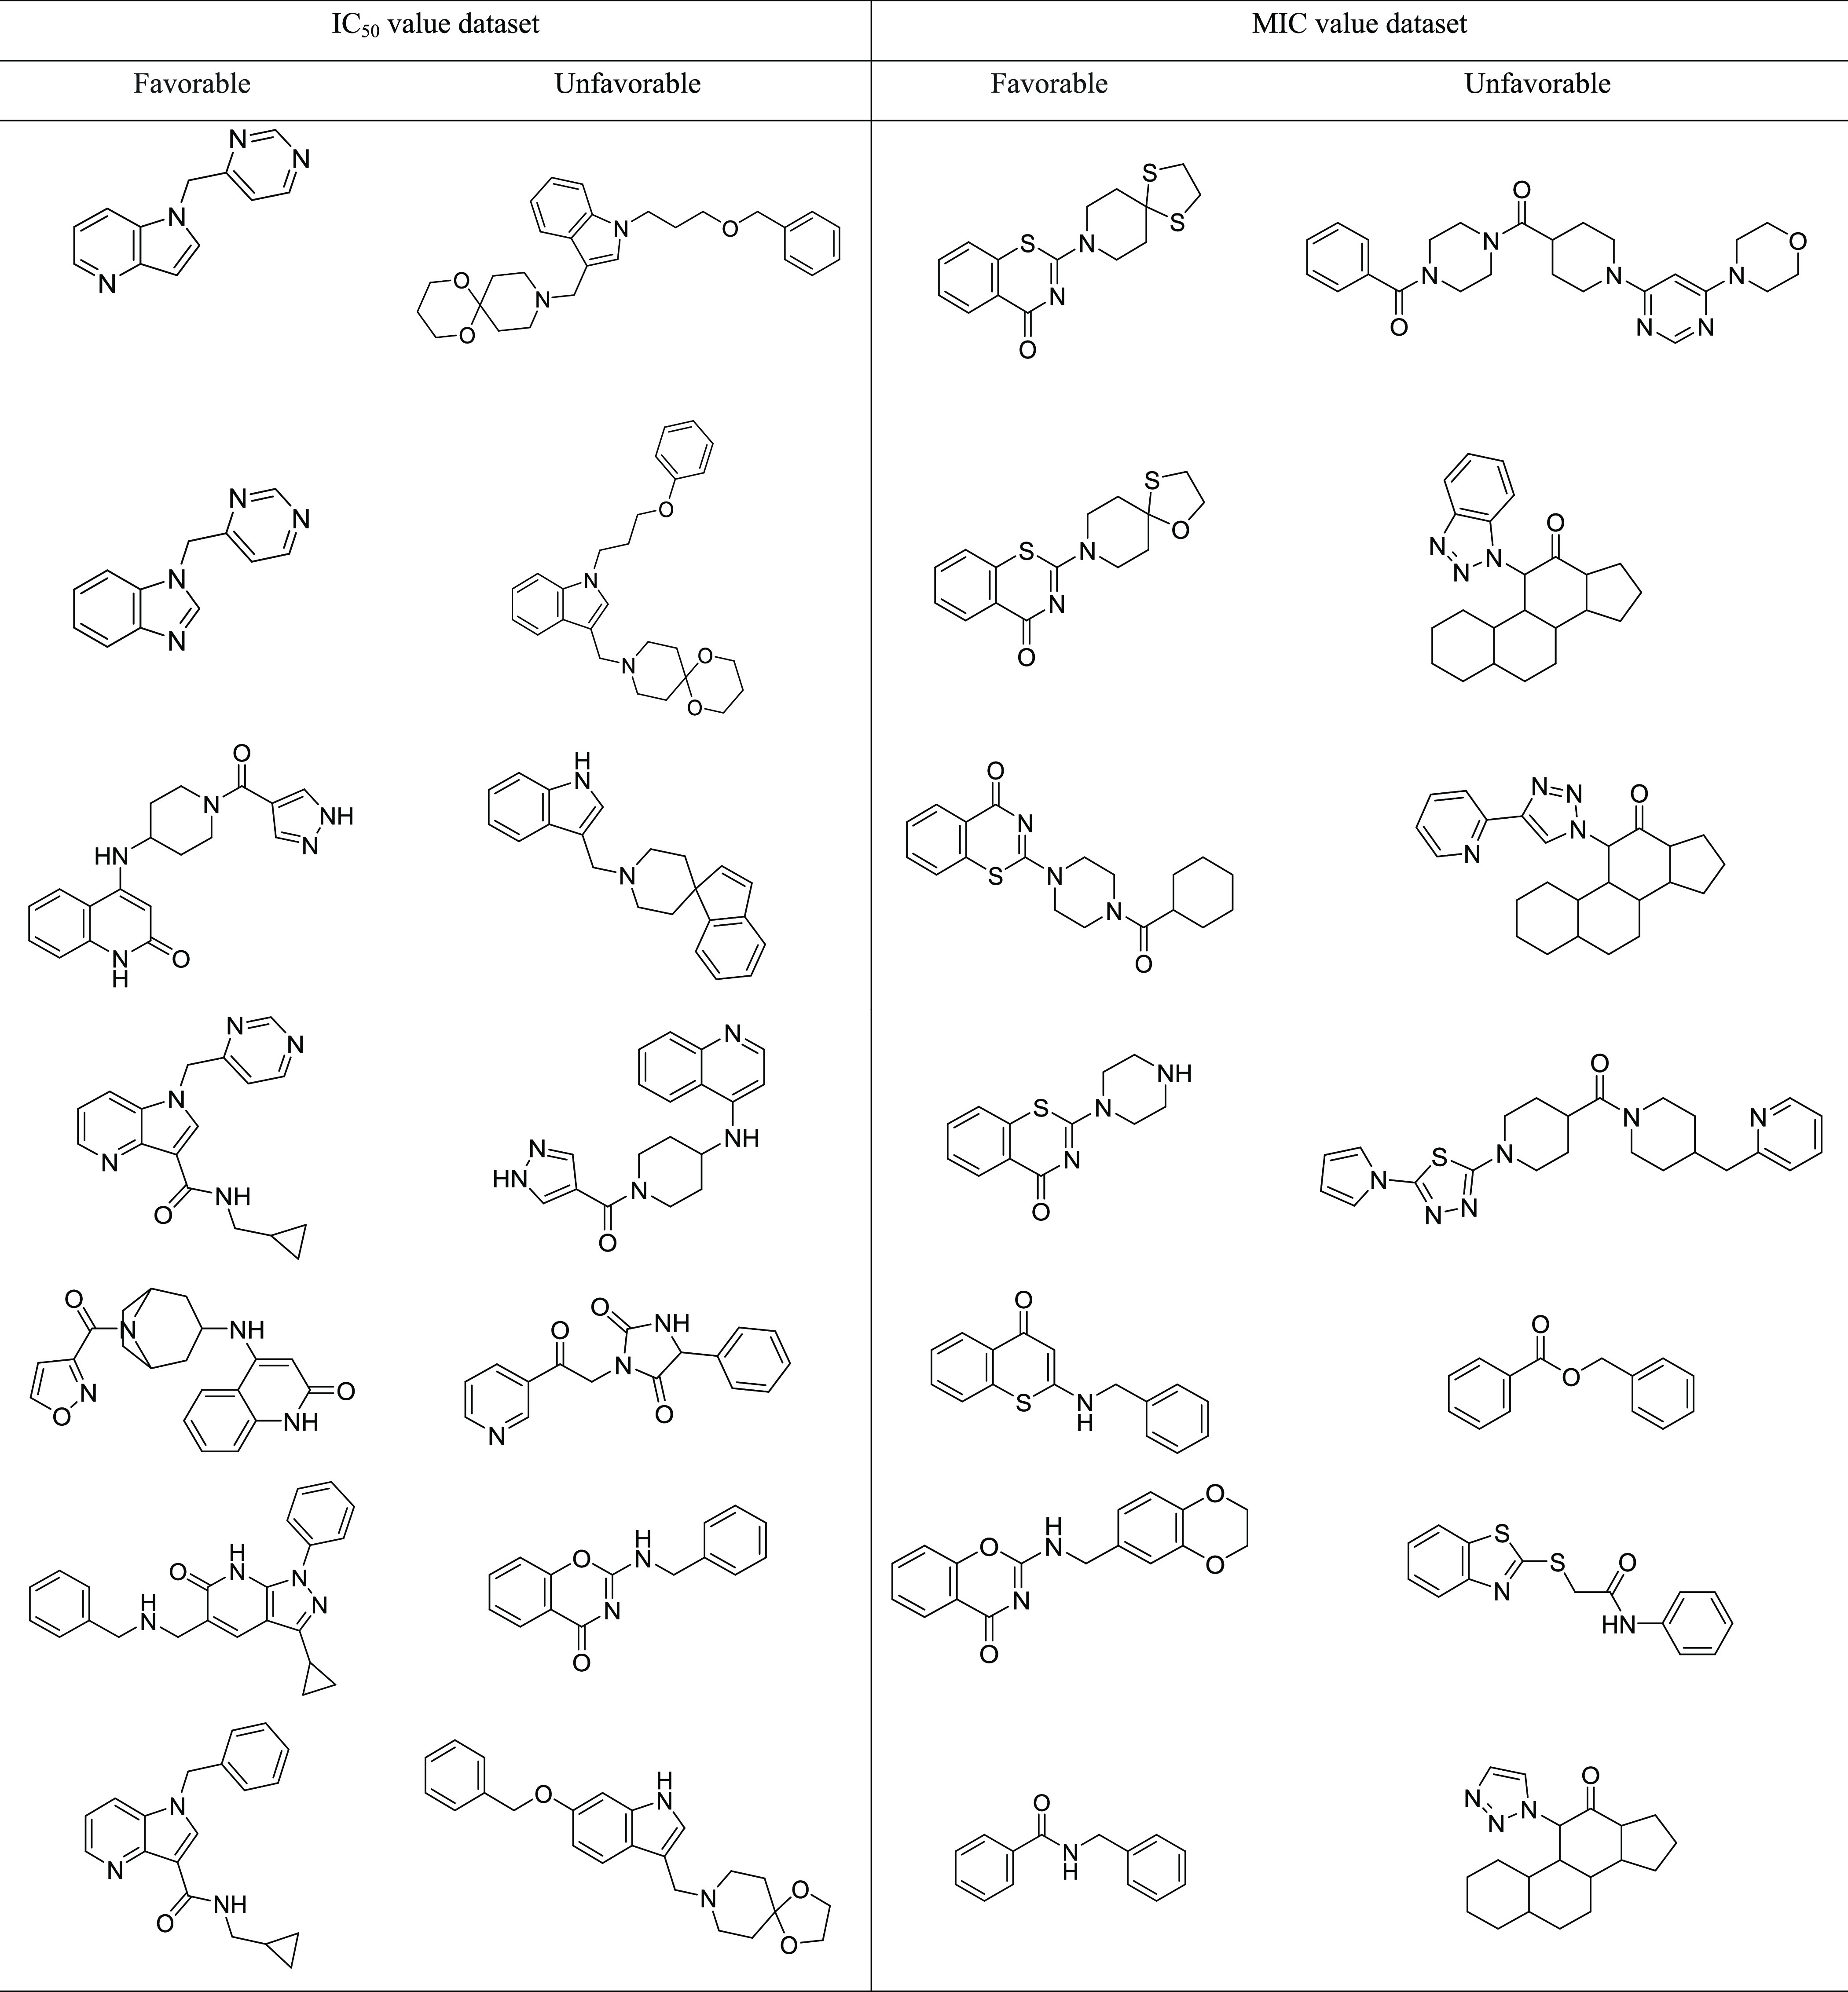
The Murcko scaffold structures and the related biological properties (Figure 2A,B) indicate a change in activity with scaffold diversity. The analysis revealed favorable potent scaffolds and the ones, which should be avoided (Table 2). For example, the Murcko scaffolds, 2-(1,4-dithia-8-azaspiro[4.5]decan-8-yl)-4H-benzo[e][1,3]thiazin-4-one and 1-(pyrimidin-4-yl methyl)-1H-pyrrolo[3,2-b]pyridine show the highest biological activities for MIC and IC50 datasets, respectively. Such scaffolds can be further explored to design novel drug candidates by exploring the structure–activity-relationship (SAR) information, organizing compound series, or generating focused compound libraries.21 The favored scaffolds identified in both datasets from this analysis could be exploited as a starting point for the rational designing of new DprE1 inhibitors by performing follow-up computational and experimental studies.
Table 2. Few Examples of Favorable and Unfavorable Scaffolds among the DprE1 Targeting Small Molecule Inhibitors.
Fragment-based analysis by Scaffold Hunter22 revealed several three-dimensional parent fragments (Figure 2C), which represent potential scaffolds or fragments for generating shape-diverse libraries since three-dimensional fragments are known to enhance pharmacophore coverage and solubility.23 Furthermore, it will be useful to explore the synthetic feasibility of the molecules, which possess these structurally related three-dimensional scaffolds for their inhibitory activity against DprE1.
Similarity Analysis
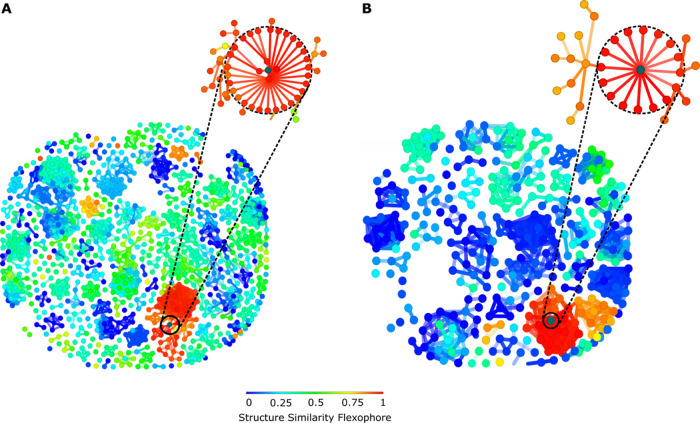
A similarity value between molecules plays an essential role, with the existence of diverse forms of molecular similarities, varying from chemical similarity connected with substructure fragment to biological similarity, which takes into account the three-dimensional geometry and binding comportment. The structural similarity calculation analysis using the Rubberbanding Scaling Forcefield (RSF) approach is useful for understanding the chemical space of DprE1 inhibitors. This protocol involves stretching, twisting, and then snapping the chemical bonds to their original place. RSF approach improves the similarity analysis better than the conventional PCA-based methods.24 Structural descriptors derived from the three-dimensional structure of the molecules are used to measure the similarity among molecules. In our analysis, a flexophore descriptor was generated, exploring the three-dimensional pharmacophore to find molecules with similar binding behavior.25 Molecules with similar size, shape, and pharmacophore points will have high flexophore similarity indexes.
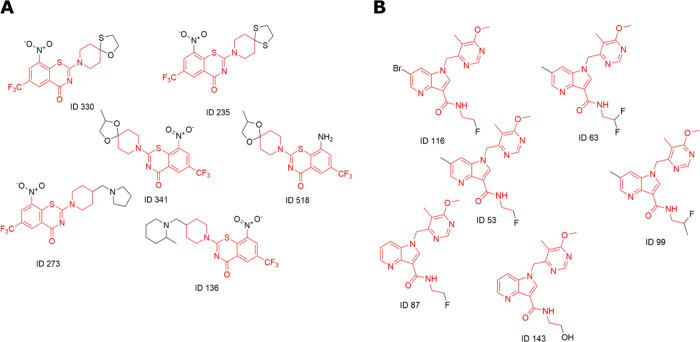
From the MIC dataset, 2372 pairs were generated with the 96% similarity threshold, while 826 pairs with 94% similarity threshold IC50 were generated from the IC50 value dataset. Figure 3 shows the structure similarity chart (flexophore), where molecules with high similarity are connected with lines and colored based on the similarity pharmacophore. The majority of chemical scaffolds in both datasets are clustered together based on their pharmacophore features (Figure 3), suggesting low pharmacophore diversity of DprE1 inhibitors in the DprE1 chemical space (Figure 4). Detailed analysis of a pharmacophore space of structurally similar compounds may lead to significant redundancy in chemical molecules’ collection against DprE1. Furthermore, with rapidly evolving drug-resistant strains of M. tuberculosis, a spontaneous mutation may confer resistance to several structurally similar compounds. Therefore, the existing chemical space of molecules targeting DprE1 should be diversified by including representative molecules of different scaffolds.
Figure 3.
Similarity flexophore and neighbor tree visualization; similarity is indicated by color. (A) MIC value dataset. (B) IC50 value dataset.
Figure 4.
Molecules with structurally similar pharmacophores. (A) MIC value dataset. (B) IC50 value dataset. Similar pharmacophores are depicted in red color.
Activity Cliff Analysis
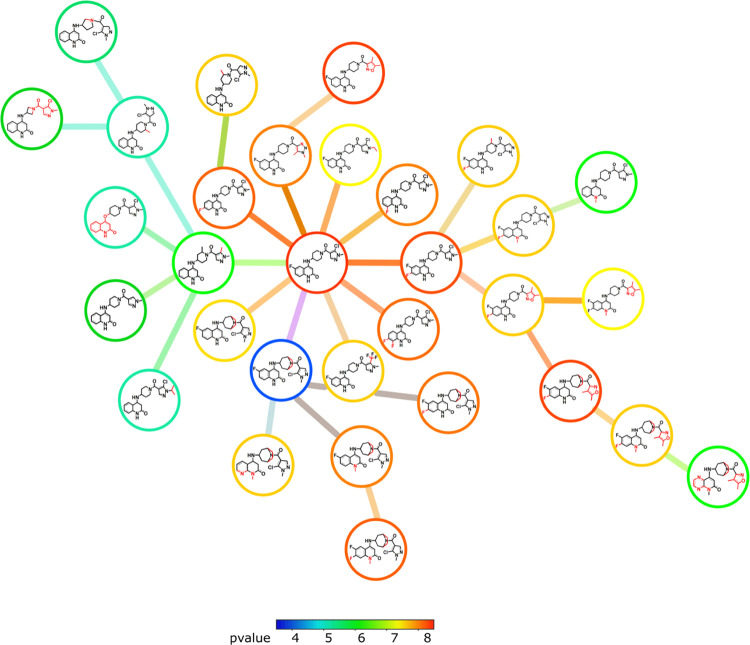
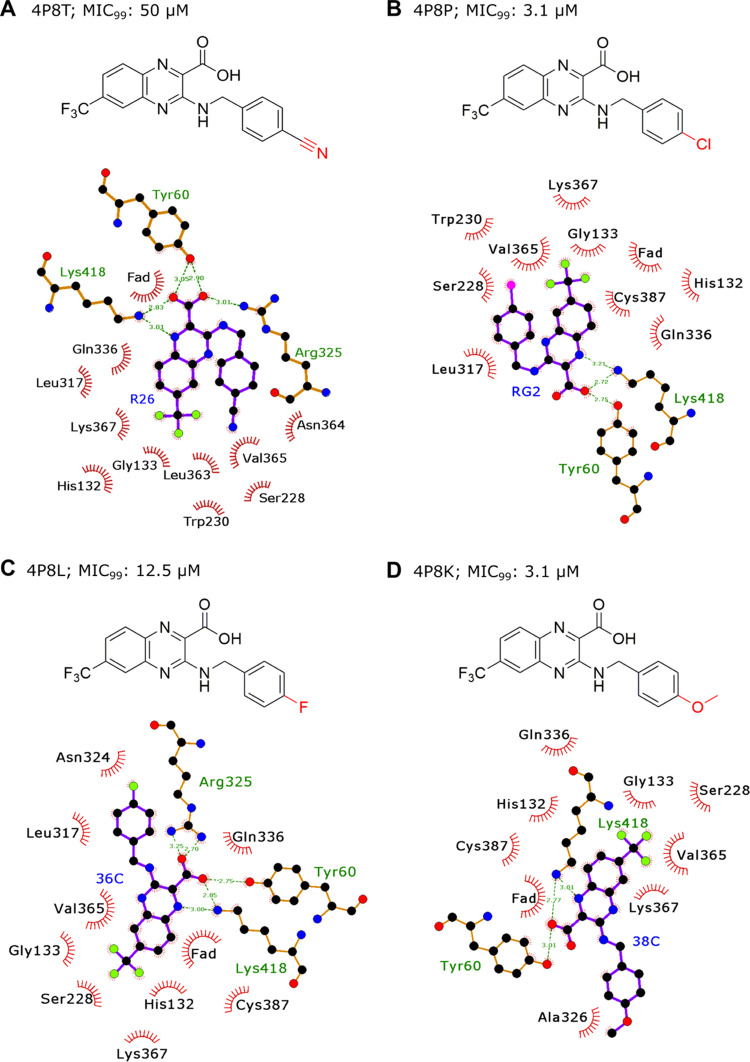
The activity scatter plots (p value) for each molecule were generated using the activity cliff analysis (Figures S2 and S3). This analysis yielded all 2297 pairwise comparisons between the 956 molecules of the MIC value dataset, identifying a cut-off similarity threshold of 89%. Similarly, 847 pairs were generated between the 336 compounds of the IC50 value dataset with the 87% similarity threshold. The pairwise comparisons revealed structurally similar active compounds with unexpected significant potency differences. A minor structural change completely inverts the biological activity (Tables S4 and S5). Figures S2A and S3A represent groups based on neighbor similarity and their respective SALI value. In the SALI plot, it is possible to identify compounds with substantial activity differences but with similar scaffolds (high structural similarity). A higher percentage of pairs of compounds have activity variance above two log units of measure (Figures S2B and S3B). For example, with the paired comparison between pair IDs 841 and 860 of the MIC value datasets, the determined SALI value was 94.661, the similarity was 0.973, and activity values were 7.39 and 4.93, respectively. In the IC50 value dataset, the pair comparisons between pair IDs 134 and 221 reveal the corresponding SALI value to be 55.54, while the similarity is 0.969, and activities are 7.26 and 5.58, respectively. These observations suggest that these sets of compounds could be explored for the SAR to design better analogs. An illustrative example of activity cliff generated for piperidine-based molecules in the IC50 value dataset is shown in Figure 5. Significant variations in biological activity are evident among the quinoxaline scaffold derivatives. To further investigate the effect of structural differences on the inhibition mechanism, we carried out protein–ligand binding interaction analysis using LigPlot+26 for the quinoxaline analogs (Figure 6). The 3-benzyl group in the quinoxaline is amenable to various chemical modifications, which induce conformational changes in the ligand, consequently leading to differences in protein–ligand interactions.27 Our analysis shows that significant potency variations among the derivatives of various scaffolds targeting DprE1 protein result primarily from single substitution and offer exciting implications for compound optimization efforts. Since the presence of prominent activity cliffs in the DprE1 MIC and IC50 value datasets may act as a major limiting factor in QSAR predictions, it will be rational to direct biological activity predictions toward focused regions of continuous SAR in the DprE1 chemical space.
Figure 5.
″Activity cliff″ analysis of piperidine derivatives. The colors indicate the p value (IC50 value dataset), where the smallest and largest values are represented by blue and red colors, respectively. The structural variations are highlighted in red.
Figure 6.
Each group (A, B, C, and D) consists of two illustrations. The upper panel represents the chemical structure of the quinoxaline derivative. The chemical modifications in the 3-benzyl moiety are denoted in red color. The lower panel shows the two-dimensional schematic representation of the ligand with the neighboring amino acid residues in the crystal structure. Ligands are displayed in stick and ball images. Residues forming hydrophobic interactions are shown as red eyelashes. In each stick and ball image, carbon, oxygen, nitrogen, fluorine, and chlorine atoms are depicted by black, red, blue, lime green, and pink balls, respectively. Hydrogen bonds are shown by dotted green lines with their lengths in Å. Amino acids are tagged by their three-letter code and tracked by their residue index in the PDB records.
Structure–Activity Relationship (SAR)
Automatic SAR was employed on the DprE1 dataset resulting in the generation of various R groups and their associated core fragments. This was accomplished using the most central ring system of the scaffolds. We generated two different SARs based on MIC and IC50 value datasets. For the MIC value dataset, 6 R-groups associated with 47 core fragments were generated (Figure S4A). In comparison, for the IC50 value dataset, 4 R-groups associated with 24 core fragments were generated (Figure S4B). With this analysis, it was observed that molecules with the same core fragment exhibit potency variations, implying that different R-groups affect the biological activity distinctively. In order to identify the R-groups responsible for the high biological activity of DprE1 inhibitors, R-group decomposition was carried out, as shown in Table 3. For instance, 8-methyl-1,4-dithia-8-azaspiro[4,5] decane at the R-2 group of core fragment 4H-benzo[e][1,3]thiazin-4-one shows the highest biological activity among the MIC value dataset, but substitution with a similar 8-methyl-1-oxa-4-thia-8-azaspiro[4,5]decane or any other group decreases the activity. The nitro group at R-2 and the trifluoromethyl group present at the R-4 position of the core fragment remain invariant in benzo-based scaffolds. The trifluoromethyl group is known to bind to a hydrophobic groove of DprE1 protein, while the nitroso group forms the covalent bond with Cys387 of the active site of the protein.28 Similarly, among the IC50 value dataset, activity is primarily driven by the substituents N-(2,2-difluoroethyl) acetamide at the R-1 group and 6-ethyl-N,N,5-trimethylpyrimidin-4-amine at the R-3 group of the core fragment 1H-pyrrolo[3,2-b]pyridine. At the same time, the chemical moieties at R-2 and R-4 positions of the pyridine-based scaffold vary considerably.
Table 3. Structure–Activity Relationship (SAR) of Benzothiazinone and Pyrrole Pyridine Scaffolds.
Predictive Toxicology Analysis Using Machine Learning
The earlier research in using artificial intelligence methods in drug discovery suggests that machine learning based on inductive logic programming (ILP) is a practical approach that efficiently handles significant blocks such as molecular superposition compared to other SAR methods. The ILP is very intuitive as it links the various substructures or chemical moieties with their biological properties such as activity, toxicity, etc., and outputs rules, which a medicinal chemist can understand.29,30 To establish correlations between chemical features and biological activities, we used the machine learning tool DCA, which uses the ILP-based approach to generate a hierarchically driven hypothesis using structural and sub-structural information and determine the structure–activity relationship. The inhibitor models generated through ILP suggest that inhibitors with specific substructures containing pyrimidine, pyrazole, or a benzene ring (Figures S5 and S6) may have higher biological activities, similar to findings obtained by scaffold analysis.
Additionally, the SAR analysis of the DprE1 dataset revealed distinct continuity in SAR, implying a continuous relationship between the molecular structural modifications and gradual respective potency variations, also referred to as the similarity property principle (SPP).31 The continuous SAR was accompanied by a marked discontinuity in SAR, where minor structural changes lead to huge variations in biological activity, implicating inconsistency with the SPP and therefore contributes to activity cliffs as described above. A representative example of a set of DprE1 inhibitors demonstrating SAR continuity and discontinuity is shown in Figure 7.
Figure 7.
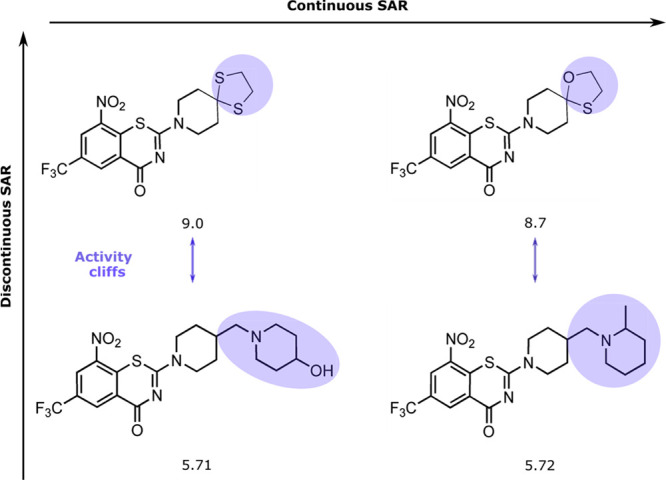
Representative examples of DprE1 MIC dataset showing SAR characteristics. Structural differences are highlighted. The pMIC values are reported for each compound.
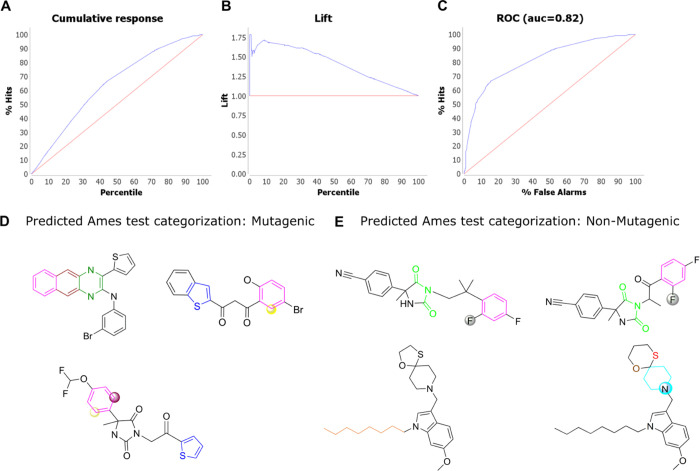
The mutagenicity model was generated based on the structural information, namely, electron flow, elements, moiety, and sub-structural relationship of 4337 structures of the benchmark Kazius’ Ames dataset (2401 mutagens and 1936 non-mutagens), classified into 29 identified toxicophores.32 The above model was then applied to known 1292 DprE1 inhibitors to identify possible toxicophore or mutagenic substructures present in the DprE1 dataset. The analysis revealed that 40% of all the reported inhibitors for DprE1 fall into the probable mutagenic category, clearly indicating that a high percentage of the molecules will have toxicity-related issues for M. tuberculosis drug discovery. As this toxicity analysis is based on the experimental data of the Ames’ dataset, thus the AI predictions on the DprE1 dataset will be useful, as research has shown that toxicity predictions based on the actual experimental toxicity datasets show overall better performance. It will be advisable to address the toxicity of these molecules or completely abandon them from further medicinal chemistry optimizations. The representative examples of the molecules, both mutagenic and non-mutagenic, are shown in Figure 8D,E.
Figure 8.
(A) Cumulative response plot of percentage of hits (y-axis) and the percentile (x-axis) based on the mutagenicity model. (B) Lift curve of the mutagenicity model depicting observations from the percentile about the outperformance of the model over a random model. (C) ROC plot of the mutagenicity model representing the percent of hits (y-axis) and false alarms (x-axis). Representative examples of predicted (D) mutagenic and (E) non-mutagenic molecules. Functional groups contributing to the mutagenicity/non-mutagenicity of the molecules are shown with distinct colors; unsubstituted atoms (yellow and purple) on the benzene ring (pink), thiophene (blue), 6-membered aromatic rings (brown and olive), aliphatic chain (orange), imide group (green), benzene ring (pink) connected to a fluorine atom (grey), thioether group (red), and six-membered aromatic ring (cyan) connected to an oxygen atom (brown).
Conclusions
The numerous phenotypic screens have led to the discovery of several promiscuous targets, which include DprE1.33 The identification of these new striking targets has now shifted the focus to them as an alternative means to combat multi- or extremely drug-resistant M. tuberculosis strains. Several decades of drug discovery are still unsuccessful in targeting these newly emerging and dreadful strains. Our study focuses on chemoinformatics analysis to provide keen insight into target DprE1, offering a new perspective to the early drug discovery process. Assessment of chemical space involving analysis of scaffolds, structural similarity, activity cliff, SAR, and physiochemical properties adds to the revelation that optimization of scaffold derivatives can assist in designing new molecules. Additionally, minor variations in the structure result in significant changes in biological activity. The SAR study revealed diverse core fragments demonstrating the highest biological activity in MIC and IC50 value datasets. Fragment-based analysis showed several three-dimensional fragments populating the chemical space of molecules targeting DprE1, which represent an interesting framework for designing novel three-dimensional-shaped molecules. SALI plots provided an understanding of the relationship between the molecular structure and biological activities. The comparative physicochemical analysis of DprE1 inhibitors, anti-TB, and FDA-approved drugs revealed that TB drugs occupy a broad chemical space, which is more disposed toward polar characteristics. In comparison, DprE1 inhibitors show a predominant hydrophobic character. Therefore, these insights can be immensely useful in the rational designing of chemical libraries to target DprE1 protein. Furthermore, using this ILP approach, we have predicted the mutagenicity of DprE1 inhibitors, as it is related to carcinogenicity and thus provided suggestions for the development of non-hazardous drug molecules for targeting M. tuberculosis. Hence, addressing the problem of multidrug resistance with a different framework can help us identify novel compounds and reposition FDA-approved drugs for possible M. tuberculosis therapeutics. In conclusion, the ligand-based design approaches might unfold a series of potentially active molecules in the early drug-designing process.
Materials and Methods
Data Collection
A database of DprE1 inhibitors with the minimum inhibitory concentration (MIC), IC50 value, and chemical structures was created by reviewing the literature from PubMed, Web of Science, American Chemical Society, and Royal Society of Chemistry from the year 2010 to 2019. We have collected all the structural and experimental information about ∼1300 small molecule inhibitors of DprE1, defined as the DprE1 dataset. The database comprises DprE1 inhibitors with experimentally reported MIC (N = 956) and IC50 (N = 336) values in μM, while molecules with MIC or IC50 values exceeding 100 μM were excluded from the database. For principal component analysis (PCA), we used the datasets of FDA-approved drugs16 (N = 2309) and anti-tuberculosis drugs17 (N = 30). The chemical space assessment involved analysis of scaffold, similarity, structure–activity relationship, activity cliff, and various physicochemical properties, which were performed using DataWarrior (Version 5.2.0),24 Scaffold Hunter,22 and ECFP634 on a CentOS Linux7 Intel Xenon CPU E5–2620 v2 @2.10GHz*24 Graphic-LLVM 6.0, 64 bit OS system.
Physicochemical Parameters
The physicochemical properties essential for drug development like drug-likeness, molecular weight, cLogP, hydrogen-acceptor, hydrogen-donors, total surface area (TSA), polar surface area (PSA), topological polar surface (TPSA), relative polar surface area (RPSA), and rotatable bond count (RB) were evaluated for the present datasets, FDA approved drugs,16 and anti-TB drugs.17 The three-dimensional principal component analysis scatter plot was generated using R studio with rgl package35 for visual representation.
Scaffold Analysis
As each compound is associated with a unique scaffold, the core structures of each of the compounds were analyzed. The scaffold framework was obtained by removing the terminals of all side chains attached to the ring. The analysis was performed using the Murcko and Skeleton scaffolds. The Murcko scaffolds were generated by eliminating the exocyclic double bonds and α-attached atom.36 Further, a skeleton scaffold was created using the Murcko scaffold. The skeleton analysis comprises only the ring, and a carbon atom was replacing the heteroatoms. Furthermore, we employed Scaffold Hunter and decomposed molecules of both datasets into parent and child scaffolds using ECFP6 fingerprint.34
Similarity Analysis
The similarity between the two molecules was computed by matching flexophore descriptors derived from the molecular structure. This involved creating a representative range of conformers.
Activity Cliff Analysis
The critical challenge in all drug discovery programs is to interpret the association between structural features and their bioactivity. The minimum change in the structure of a molecule changes the related biological activity. The SkeletonSphere descriptors were used to determine the structure–activity landscape index (SALI). The SALI values were calculated based on activity cliff analysis correlating the biological properties with the chemical diversity of DprE1 inhibitors.37
where Ai is the activity of ith molecule and Aj is the activity of the jth molecule of the DprE1 dataset, and sim(i, j) is the similarity quotient among the pair of molecules.
Predictive Toxicology Analysis by Machine Learning
To establish a relationship between common structural features of DprE1 ligands and their biological activity profile, we applied inductive logic programming (ILP)-based software, DCA.14 ILP derives a hypothesis in a hierarchical fashion by incorporating the background knowledge of the molecular structure, namely, electron flow, type of elements, substructure relationship between different functional groups, and rings of the molecule to ultimately derive correlation rules between the structural information and the corresponding experimental biological activity. Furthermore, we investigated the chemical features of DprE1 inhibitors, which may prompt mutagenicity by comparing against the Kazius’ Ames mutagenicity dataset32 comprising 2401 mutagens and 1936 non-mutagens.
Future Perspective
Tuberculosis infection represents an immense global health care challenge. Therefore, it is fundamental to design new, potent, and effective drug regimens against M. tuberculosis, which must address the emerging drug-resistant TB. The periplasmic location, high promiscuity, and complete biochemical and genetic characterization demonstrate DprE1 as an innovative drug target amenable to small molecule therapeutics. With three DprE1 inhibitors already undergoing clinical trials, the field is wide open with copious potential for developing novel DprE1 inhibitors with higher specificity and improved pharmacokinetics. While the discovery of the majority of the scaffolds targeting DprE1 has been facilitated by high-throughput screening, it would be advantageous to integrate chemoinformatic and machine learning to accelerate and guide drug designing. This is the first elaborate computational analysis to the best of our knowledge that reports the systematic assessment of chemical space and predictive toxicological analysis of small molecules targeting M. tuberculosis DprE1 protein. We anticipate that the findings reported here will assist in scaffold optimization and structure-based drug designing to form novel anti-tubercular agents.
Acknowledgments
The authors acknowledge the CSIR-Institute of Microbial Technology (grant OLP0136 to R.P.) and DST (SB/SO/BB/023/2014 to R.P.) for financial support. S.C. is grateful to CSIR for Junior Research Fellowship. S.K. is grateful to CSIR-IMTECH for research internship.
Glossary
Abbreviations
- WHO
World Health Organization
- M. tuberculosis
Mycobacterium tuberculosis
- DprE1
decaprenylphosphoryl-β-d-ribose-2′-epimerase
- DprE2
decaprenylphosphoryl-2-keto-ribose reductase
- FAD
flavin adenine dinucleotide
- MIC
minimum inhibitory concentration
- IC50
half maximal inhibitory concentration
- SALI
structure–activity landscape index
- MDR
multidrug resistance
- XDR
extensive drug resistance
Supporting Information Available
The Supporting Information is available free of charge at https://pubs.acs.org/doi/10.1021/acsomega.1c01314.
Details of principal components of physicochemical properties (Tables S1–S3) (Figure S1), activity cliff analysis (Tables S4 and S5), (Figures S2 and S3), and SAR (Figures S4–S6) (PDF)
The project is funded by CSIR-Institute of Microbial Technology (OLP0136) and DST (SB/SO/BB/023/2014).
The authors declare no competing financial interest.
Supplementary Material
References
- Bloom B. R.; Atun R.; Cohen T.; Dye C.; Fraser H.; Gomez G. B.; Knight G.; Murray M.; Nardell E.; Rubin E.; Salomon J.; Vassall A.; Volchenkov G.; White R.; Wilson D.; Yadav P.. Chapter 11. Tuberculosis. Major Infectious Diseases. Disease Control Priorities ;3rd ed.;Holmes K. K., Bertozzi S., Bloom B., Jha P.. , Eds 2017, 233–313.
- Global TB Report 2019; WHO: Geneva, Switzerland, 2019, Available online: https://apps.who.int/iris/bitstream/handle/10665/329368/9789241565714-eng.pdf?ua=1. [Google Scholar]; (accessed on 29 Dec, 2020)
- Pawlowski A.; Jansson M.; Sköld M.; Rottenberg M. E.; Källenius G. Tuberculosis and HIV co-infection. PLoS Pathog. 2012, 8, e1002464 10.1371/journal.ppat.1002464. [DOI] [PMC free article] [PubMed] [Google Scholar]
- Vilchèze C. Mycobacterial cell wall: a source of successful targets for old and new drugs. Appl. Sci. 2020, 10, 2278. 10.3390/app10072278. [DOI] [Google Scholar]
- Konyariková Z.; Savková K.; Kozmon S.; Mikušová K. Biosynthesis of galactan in Mycobacterium tuberculosis as a viable TB drug target?. Antibiotics 2020, 9, 20. 10.3390/antibiotics9010020. [DOI] [PMC free article] [PubMed] [Google Scholar]
- Bhutani I.; Loharch S.; Gupta P.; Madathil R.; Parkesh R. Structure, dynamics, and interaction of Mycobacterium tuberculosis (Mtb) DprE1 and DprE2 examined by molecular modeling, simulation, and electrostatic studies. PLoS One 2015, 10, e0119771 10.1371/journal.pone.0119771. [DOI] [PMC free article] [PubMed] [Google Scholar]
- Mikušová K.; Huang H.; Yagi T.; Holsters M.; Vereecke D.; D’Haeze W.; Scherman M. S.; Brennan P. J.; McNeil M. R.; Crick D. C. Decaprenylphosphoryl arabinofuranose, the donor of the D-arabinofuranosyl residues of mycobacterial arabinan, is formed via a two-step epimerization of decaprenylphosphoryl ribose. J. Bacteriol. 2005, 187, 8020–8025. 10.1128/JB.187.23.8020-8025.2005. [DOI] [PMC free article] [PubMed] [Google Scholar]
- Kolly G. S.; Boldrin F.; Sala C.; Dhar N.; Hartkoorn R. C.; Ventura M.; Serafini A.; McKinney J. D.; Manganelli R.; Cole S. T. Assessing the essentiality of the decaprenyl-phospho-d-arabinofuranose pathway in Mycobacterium tuberculosis using conditional mutants. Mol. Microbiol. 2014, 92, 194–211. 10.1111/mmi.12546. [DOI] [PubMed] [Google Scholar]
- Piton J.; Foo C. S.-Y.; Cole S. T. Structural studies of Mycobacterium tuberculosis DprE1 interacting with its inhibitors. Drug Discovery Today 2017, 22, 526–533. 10.1016/j.drudis.2016.09.014. [DOI] [PubMed] [Google Scholar]
- Chikhale R. V.; Barmade M. A.; Murumkar P. R.; Yadav M. R. Overview of the development of DprE1 inhibitors for combating the menace of tuberculosis. J. Med. Chem. 2018, 61, 8563–8593. 10.1021/acs.jmedchem.8b00281. [DOI] [PubMed] [Google Scholar]
- Macozinone (MCZ, PBTZ-169); 2020, Available online: https://www.newtbdrugs.org/pipeline/compound/macozinone-mcz-pbtz-169.; (accessed on 29 Dec, 2020)
- TBA-7371; 2020, Available online: https://www.newtbdrugs.org/pipeline/compound/tba-7371.; (accessed on 29 Dec, 2020)
- Degiacomi G.; Belardinelli J. M.; Pasca M. R.; de Rossi E.; Riccardi G.; Chiarelli L. R. Promiscuous targets for antitubercular drug discovery: the paradigm of DprE1 and MmpL3. Appl. Sci. 2020, 10, 623. 10.3390/app10020623. [DOI] [Google Scholar]
- Ando H. Y.; Dehaspe L.; Luyten W.; Van Craenenbroeck E.; Vandecasteele H.; Van Meervelt L. Discovering H-bonding rules in crystals with inductive logic programming. Mol. Pharmaceutics 2006, 3, 665–674. 10.1021/mp060034z. [DOI] [PubMed] [Google Scholar]
- Hopkins A. L.; Keserü G. M.; Leeson P. D.; Rees D. C.; Reynolds C. H. The role of ligand efficiency metrics in drug discovery. Nat. Rev. Drug Discovery 2014, 13, 105–121. 10.1038/nrd4163. [DOI] [PubMed] [Google Scholar]
- https://www.selleckchem.com/screening/fda-approved-drug-library.html. (accessed on 25 Dec, 2020)
- World Health Organization Chapter 22.Use of drugs under development and preapproval by national drug regulatory authorities. Companion Handbook to the WHO Guidelines for the Programmatic Management of Drug-Resistant Tuberculosis; World health organization: 2014, 255–257. [PubMed] [Google Scholar]
- Koul A.; Arnoult E.; Lounis N.; Guillemont J.; Andries K. The challenge of new drug discovery for tuberculosis. Nature 2011, 469, 483–490. 10.1038/nature09657. [DOI] [PubMed] [Google Scholar]
- Langdon S. R.; Brown N.; Blagg J. Scaffold diversity of exemplified medicinal chemistry space. J. Chem. Inf. Model. 2011, 51, 2174–2185. 10.1021/ci2001428. [DOI] [PMC free article] [PubMed] [Google Scholar]
- Lipkus A. H.; Yuan Q.; Lucas K. A.; Funk S. A.; BarteltIii W. F. 3rd; Schenck R. J.; Trippe A. J. Structural diversity of organic chemistry. A scaffold analysis of the CAS Registry. J. Org. Chem. 2008, 73, 4443–4451. 10.1021/jo8001276. [DOI] [PubMed] [Google Scholar]
- Hu Y.; Stumpfe D.; Bajorath J. Lessons learned from molecular scaffold analysis. J. Chem. Inf. Model. 2011, 51, 1742–1753. 10.1021/ci200179y. [DOI] [PubMed] [Google Scholar]
- Klein K.; Kriege N.; Scaffold M. P.. Hunter: facilitating drug discovery by visual analysis of chemical space .Computer Vision, Imaging and Computer Graphics. Theory and Application; Csurka G.; Kraus M.; Laramee R.S.; Richard P.; Braz J. Eds 2013, 176–192.
- Downes T. D.; Jones S. P.; Klein H. F.; Wheldon M. C.; Atobe M.; Bond P. S.; Firth J. D.; Chan N. S.; Waddelove L.; Hubbard R. E.; Blakemore D. C.; de Fusco C.; Roughley S. D.; Vidler L. R.; Whatton M. A.; Woolford A. J. A.; Wrigley G. L.; O’Brien P. Design and synthesis of 56 shape-diverse 3D fragments. Chem. – Eur. J. 2020, 26, 8969. 10.1002/chem.202001123. [DOI] [PMC free article] [PubMed] [Google Scholar]
- Sander T.; Freyss J.; von Korff M.; Rufener C. DataWarrior: an open-source program for chemistry aware data visualization and analysis. J. Chem. Inf. Model. 2015, 55, 460–473. 10.1021/ci500588j. [DOI] [PubMed] [Google Scholar]
- Willett P. Similarity-based virtual screening using 2D fingerprints. Drug Discovery Today 2006, 11, 1046–1053. 10.1016/j.drudis.2006.10.005. [DOI] [PubMed] [Google Scholar]
- Laskowski R. A.; Swindells M. B. LigPlot+: multiple ligand–protein interaction diagrams for drug discovery. J. Chem. Inf. Model. 2011, 51, 2778–2786. 10.1021/ci200227u. [DOI] [PubMed] [Google Scholar]
- Neres J.; Hartkoorn R. C.; Chiarelli L. R.; Gadupudi R.; Pasca M. R.; Mori G.; Venturelli A.; Savina S.; Makarov V.; Kolly G. S.; Molteni E.; Binda C.; Dhar N.; Ferrari S.; Brodin P.; Delorme V.; Landry V.; Ribeiro A. L. J. L.; Farina D.; Saxena P.; Pojer F.; Carta A.; Luciani R.; Porta A.; Zanoni G.; Rossi E. D.; Costi M. P.; Riccardi G.; Cole S. T. 2-Carboxyquinoxalines kill Mycobacterium tuberculosis through noncovalent inhibition of DprE1. ACS Chem. Biol. 2015, 10, 705–714. 10.1021/cb5007163. [DOI] [PubMed] [Google Scholar]
- Batt S. M.; Jabeen T.; Bhowruth V.; Quill L.; Lund P. A.; Eggeling L.; Alderwick L. J.; Fütterer K.; Besra G. S. Structural basis of inhibition of Mycobacterium tuberculosis DprE1 by benzothiazinone inhibitors. Proc. Natl. Acad. Sci. U. S. A. 2012, 109, 11354–11359. 10.1073/pnas.1205735109. [DOI] [PMC free article] [PubMed] [Google Scholar]
- Muggleton S. (Ed.).. Inductive logic programming; (No. 38). Morgan Kaufmann: 1992. [Google Scholar]
- Muggleton S.; De Raedt L. Inductive logic programming: Theory and methods. J. Logic Program. 1994, 19-20, 629–679. 10.1016/0743-1066(94)90035-3. [DOI] [Google Scholar]
- Muratov E. N.; Bajorath J.; Sheridan R. P.; Tetko I. V.; Filimonov D.; Poroikov V.; Oprea T. I.; Baskin I. I.; Varnek A.; Roitberg A.; Isayev O.; Curtalolo S.; Fourches D.; Cohen Y.; Aspuru-Guzik A.; Winkler D. A.; Agrafiotis D.; Cherkasov A.; Tropsha A. QSAR without borders. Chem. Soc. Rev. 2020, 49, 3525–3564. 10.1039/D0CS00098A. [DOI] [PMC free article] [PubMed] [Google Scholar]
- Kazius J.; McGuire R.; Bursi R. Derivation and validation of toxicophores for mutagenicity prediction. J. Med. Chem. 2005, 48, 312–320. 10.1021/jm040835a. [DOI] [PubMed] [Google Scholar]
- Lee B. S.; Pethe K. Therapeutic potential of promiscuous targets in Mycobacterium tuberculosis. Curr. Opin. Pharmacol. 2018, 42, 22–26. 10.1016/j.coph.2018.06.006. [DOI] [PubMed] [Google Scholar]
- Rogers D.; Hahn M. Extended-connectivity fingerprints. J. Chem. Inf. Model. 2010, 50, 742–754. 10.1021/ci100050t. [DOI] [PubMed] [Google Scholar]
- Adler D.; Nenadic O.; Zucchini W.. Rgl: A r-library for 3d visualization with opengl. Proceedings of the 35th Symposium of the Interface: Computing Science and Statistics: Salt Lake City: 2003, 35, 1–11. [Google Scholar]
- Schuffenhauer A.; Ertl P.; Roggo S.; Wetzel S.; Koch M. A.; Waldmann H. The scaffold tree visualization of the scaffold universe by hierarchical scaffold classification. J. Chem. Inf. Model. 2007, 47, 47–58. 10.1021/ci600338x. [DOI] [PubMed] [Google Scholar]
- Guha R.; van Drie J. H. Structure activity landscape index: identifying and quantifying activity cliffs. J. Chem. Inf. Model. 2008, 48, 646–658. 10.1021/ci7004093. [DOI] [PubMed] [Google Scholar]
Associated Data
This section collects any data citations, data availability statements, or supplementary materials included in this article.


