Abstract
The cause of nonbacterial chronic prostatitis is unknown, yet its prevalence accounts for more than 90% of all prostatitis cases. Whole blood, plasma, and serum have been used to identify prostate cancer biomarkers; however, few studies have performed protein profiling to identify prostatitis biomarkers. The purpose of this study was to identify protein biomarkers altered by chronic prostatitis. To perform the study, we chemically induced chronic prostate inflammation in Sprague Dawley rats using estradiol benzoate (EB), testosterone (T), and estradiol (E) and then examined protein levels in their plasma. Plasma was collected on postnatal days (PNDs) 90, 100, 145, and 200; plasma proteins were profiled using liquid chromatography–tandem mass spectrometry. Chronic inflammation was observed in the rat prostate induced with EB on PNDs 1, 3, and 5. Rats then were dosed with T+E during PNDs 90–200 via subcutaneous implants. We identified time-specific expression for several proteins (i.e., CFB, MYH9, AZGP1). Some altered proteins that were expressed in the prostate (i.e., SERPINF1, CTR9) also were identified in the rat plasma in the EB+T+E group on PNDs 145 and 200. These findings suggest that the identified proteins could be used as biomarkers of chronic prostatitis. Further studies are needed to verify the results in human samples.
1. Introduction
Prostatitis is a swelling and inflammation of the prostate with symptoms including groin pain, painful and/or difficult urination, and flu-like symptoms. Several studies in the world have reported the mean prevalence of prostatitis was approximately 8.2% or 873/10 617 participants of various ages.1−3 In addition, the histologic prevalence of chronic prostatitis in autopsy samples from Caucasian and Asian men has been shown to be over 70%.4 There are two types of chronic prostatitis: bacterial and nonbacterial. Nonbacterial chronic prostatitis, also termed as the chronic pelvic pain syndrome, has an unknown etiology and represents >90% of all prostatitis cases.3,5 Chronic prostate inflammation can increase the risk of cancer development.6 The diagnosis of chronic prostatitis is based on family/medical history, physical examination, and/or urine or blood tests.
Early detection/diagnosis is an important aspect, and a clinical need exists to identify biomarkers for disease diagnosis, monitoring of treatment, and/or predicting diseases.7 Since innovative proteomics analysis has been established, many researchers, using whole blood, plasma, and serum, have performed proteomic analysis (complex protein profiling) using high-performance equipment [liquid chromatography–mass spectrometry (LC/MS), LC–MS/MS, and matrix-assisted laser desorption/ionization-time of flight (MALDI-TOF)].8 Currently, there are no prostatitis-specific biomarkers. Many researchers, using whole blood, plasma, and serum, have applied proteomics to identify biomarkers for prostate cancer, but not for prostatitis.8−11 Larkin et al. performed proteomic profiling/quantitation with an isobaric tag for relative and absolute quantitation (iTRAQ) 3D LC/MS mass spectrometry using human samples from prostate cancer patients, and the results were then validated with ELISA kits.10 On the other hand, Kagedan et al. performed protein profiling with LC/MS using seminal plasma from prostatitis patients and identified 59 potential biomarkers.12 However, blood (i.e., serum and plasma) is a more convenient and useful clinical aid for diagnosing diseases (https://www.nhlbi.nih.gov/health-topics/blood-tests).
Rats remain widely used as animal models for prostate diseases, due to the ability to induce in them such symptoms as neoplasia and inflammation using endocrine disrupting chemicals (supplemented with additional testosterone and estradiol treatments) to examine gene expression profiles during prostate development through adulthood.13−16
In our previous study,17,18 rat pups were injected with estradiol benzoate (EB) on PNDs 1, 3, and 5 and then underwent additional testosterone (T) and 17β-estradiol (E) exposure via subcutaneous implantation of a hormone-filled Silastic tubing from PND 90 through PND 200 by Ho16 and Nakamura et al.18 Data from that study showed elevated estrogen levels on PND 100. Additionally, chronic inflammation was found on PNDs 145 and 200 in the dorsolateral prostate of rats dosed with EB, T, and E only.
The purpose of this study was to identify possible chronic prostatitis biomarkers by examining plasma protein levels from rats with chronic inflammation induced with EB, T, and E. Rat plasma collected from a previous study was profiled using liquid chromatography–tandem mass spectrometry.17
2. Results
2.1. Principal Component Analysis (PCA) and Partial Least Squares Discriminant Analysis (PLS-DA) for Identifying the Plasma Proteins of Rats Dosed With EB and/or T and E
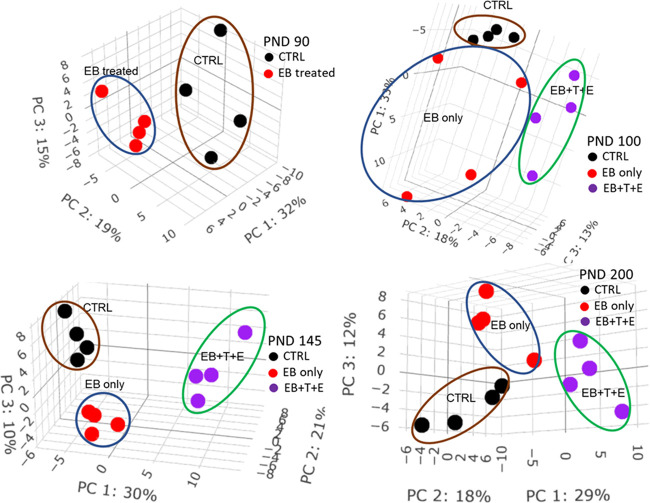
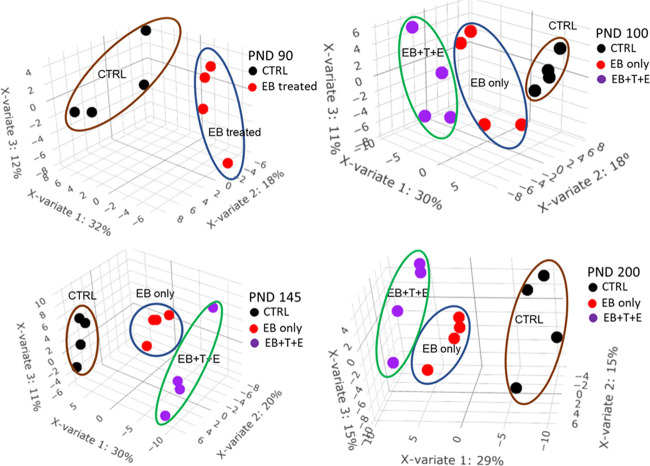
To explore the effects of treatment of EB and/or T and E on the potential pattern of plasma proteome, both unsupervised multivariate analysis PCA and supervised multivariate analysis PLS-DA were performed on quantified proteins at each PND to cluster and classify samples. PCA score plots (Figure 1) show clear segregations among treatment groups on each PND. PLS-DA score plots (Figure 2) show clear discriminations among treatment groups on each PND, and the leave-one-out cross-validation (LOOCV) yielded classification error rates of 0, 8.3, 0, and 8.3% for PND 90, 100, 145, and 200, respectively. The top 10 proteins that mostly contribute to component one are listed in Table S1.
Figure 1.
PCA score plot of plasma protein levels in rats dosed post-natally with EB, T, and E.
Figure 2.
PLS-DA score plot of plasma protein levels in rats dosed post-natally with EB, T, and E. The error rate of leave-one-out cross-validation is 0% on PND 90, 8.3% on PND 100, 0% on PND 145, and 8.3% on PND 200.
2.2. Pathways
Ingenuity pathway analysis (IPA) was used to determine the pathways in rat plasma that were affected by EB exposure on PND 90 or EB, T, and E exposure on PNDs 100, 145, and/or 200 (Table S2). Twelve canonical pathways in the rat plasma were significantly (p < 0.05) altered at all collection points. LXR/RXR activation, FXR/RXR activation, and coagulation system pathways in the rat plasma were the top three pathways most affected by EB or EB+T+E exposure at all collection time points. The number of pathways significantly changed specifically on PNDs 90, 100, and 145 or 200 were 1, 6, and 23 or 21, respectively (Table S2). On each of PNDs 100 and 145 or 200, the numbers of the pathways that were significantly altered in the EB+T+E group were 3 and 12 or 3, respectively (Table S2).
2.3. Significantly Changed Proteins
From 183 proteins (Table S3), 118 proteins were quantified across all treatments and collection points, among which 40 proteins were not significantly changed. The protein changes for each group are as follows: on PND 90 for EB treatment vs control, 32 proteins were significantly changed; on PND 100 for EB vs control, four proteins were significantly changed; at EB+T+E vs control, 17 proteins were significantly changed; on PND 145 for EB vs control, 36 proteins were significantly changed; at EB+T+E vs control, 50 proteins were significantly changed; on PND 200 for EB vs control, 10 proteins were significantly changed; and at EB+T+E vs control, 44 proteins were significantly changed. Interestingly, no significantly altered proteins were identified across all treatments and collection points. In addition, 17 proteins on PND 90 overlapped with those on PNDs 100, 145, or 200.
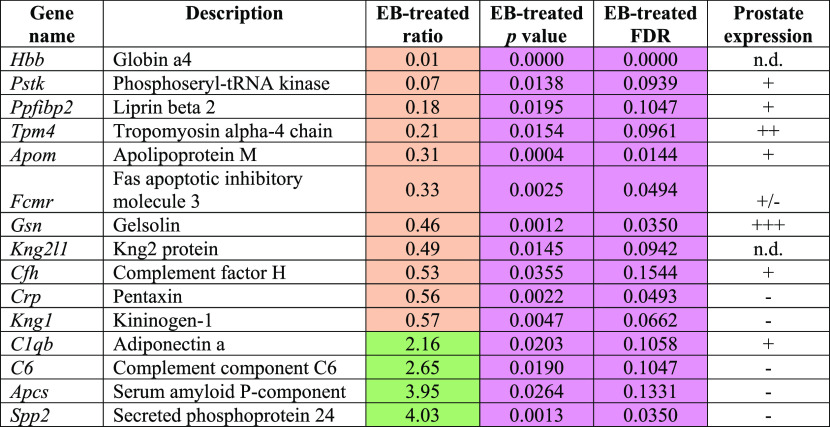
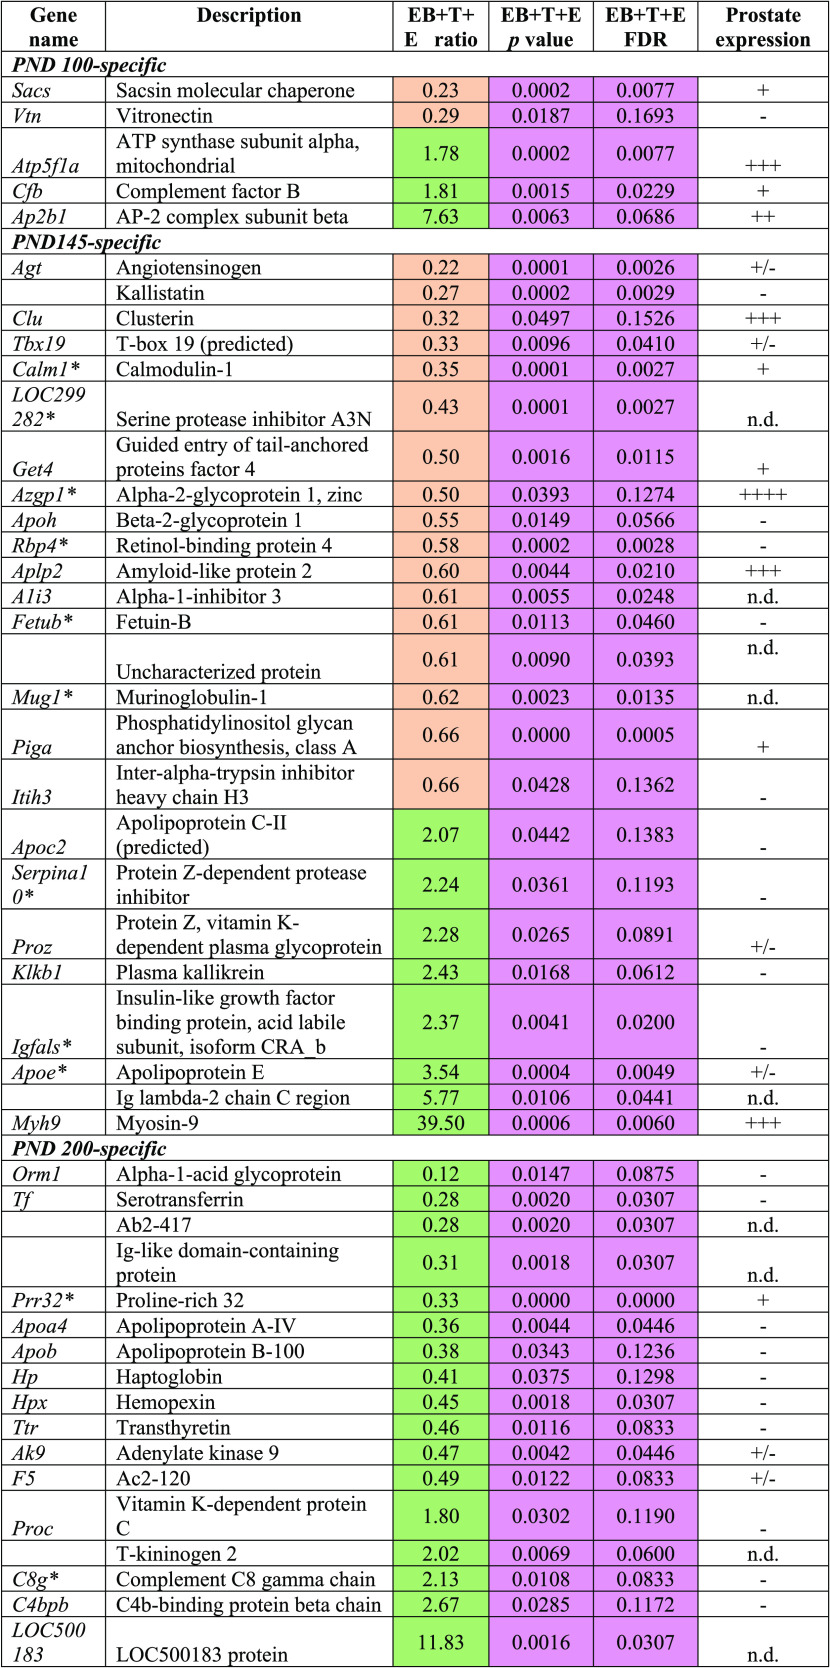
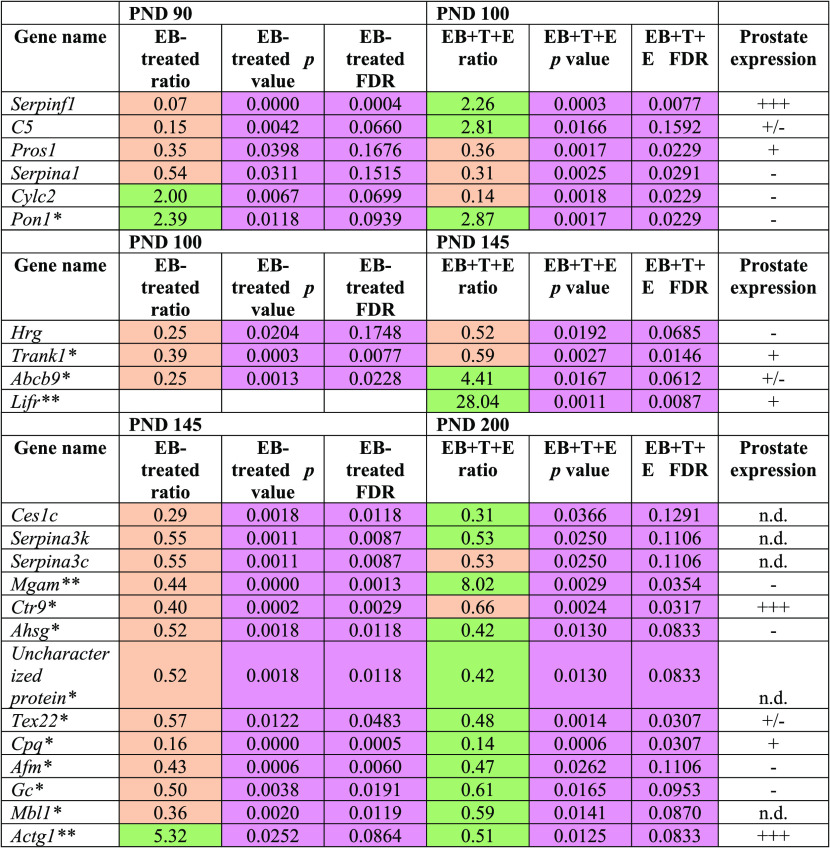
As shown in Table 1, 15 proteins exhibited PND 90-specific alterations, and most were downregulated except for complement component C6 (C6), adiponectin A (C1QB), secreted phosphoprotein 24 (SPP2), and serum amyloid P-component (APCS). Of 17 proteins, five PND 100-specific altered proteins were observed to have statistical significance only in the EB+T+E group compared with the control group (Table 2). Of the 50 proteins that were significantly altered in the EB+T+E group on PND 145, 16 proteins showed PND 145-specific changes. Eleven proteins were downregulated, and five proteins were upregulated in the EB+T+E group (Table 2). On PND 200, of the 44 proteins, the levels of 17 proteins were specifically altered with statistical significance only in the EB+T+E group. Most proteins were downregulated, except for complement C8 gamma chain, LOC500183 protein, vitamin K-dependent protein C, and C4b-binding protein beta chain (Table 2). In addition, SERPINF1 was significantly altered in the rat plasma on both PND 90 for the EB-treated group and PND 100 for the EB+T+E group (Table 3).
Table 1. Specifically Altered Plasma Protein Levels in the EB-Treated Group on PND 90 (Fold Change ≥ 1.5, p < 0.05 and FDR < 0.2)a.
n.d.: no data; prostate expression (www.ncbi.nlm.nih.gov/gene) was categorized into four groups: −, no expression; +/–, faint; + weak; ++ moderate; +++, strong. Coral color indicates down-regulated; green color indicates up-regulated. Pink color shows statistical significances.
Table 2. Specifically Altered Plasma Protein Levels in the EB+T+E Group on PND 100, 145, or 200 (Fold Change ≥ 1.5, p < 0.05, and FDR < 0.2)a.
*Statistical significances were observed in both EB and EB+T+E groups. n.d.: no data; prostate expression (www.ncbi.nlm.nih.gov/gene) was categorized into four groups: −, no expression; +/–, faint; + weak; ++ moderate; +++, strong. Coral color indicates down-regulated; green color indicates up-regulated. Pink color shows statistical significances.
Table 3. Significantly Altered Plasma Protein Levels in the EB+T+E Group on Multiple Collection Points (Fold Change ≥ 1.5, p < 0.05, and FDR < 0.2)a,b.
*Significant differences in the EB and EB+T+E groups on PND 100, PND 145, and PND 200.
**Significant differences only in the EB group on PND 145. Significant differences only in the EB and EB+T+E groups on PND 200. n.d.: no data; prostate expression (www.ncbi.nlm.nih.gov/gene) was categorized into four groups: −, no expression; +/–, faint; + weak; ++ moderate; +++, strong. Coral color indicates down-regulated; green color indicates up-regulated. Pink color shows statistical significances.
Using the National Center for Biotechnology Information (NCBI) database, we examined whether the genes/proteins identified in the rat plasma in this study were expressed in the prostate (Tables 1–3). Most of the genes either are weakly expressed or not expressed in the prostate. However, the following genes are strongly expressed in the prostate: gelsolin (Gsn) on PND 90; AP2 complex subunit beta (Ap2b1), complement factor B (Cfb), and ATP subunit alpha, mitochondrial (Atp5f1a) on PND 100; myosin-9 (Myh9), alpha-2-glycoprotein 1, zinc (Azgp1), and amyloid-like protein 2 (Aplp2) on PND 145; and chromosome X open reading frame 64 (Cxorf64)-encoded PRR32 (proline rich 32) on PND 200. In addition, CTR9 homolog Paf1/RNA polymerase II complex component (Ctr9) is expressed on PNDs 145 and 200; serpin family F member 1 (Serpinf1) on PNDs 90 and 100 genes is strongly expressed in prostates as well (Tables 1–3).
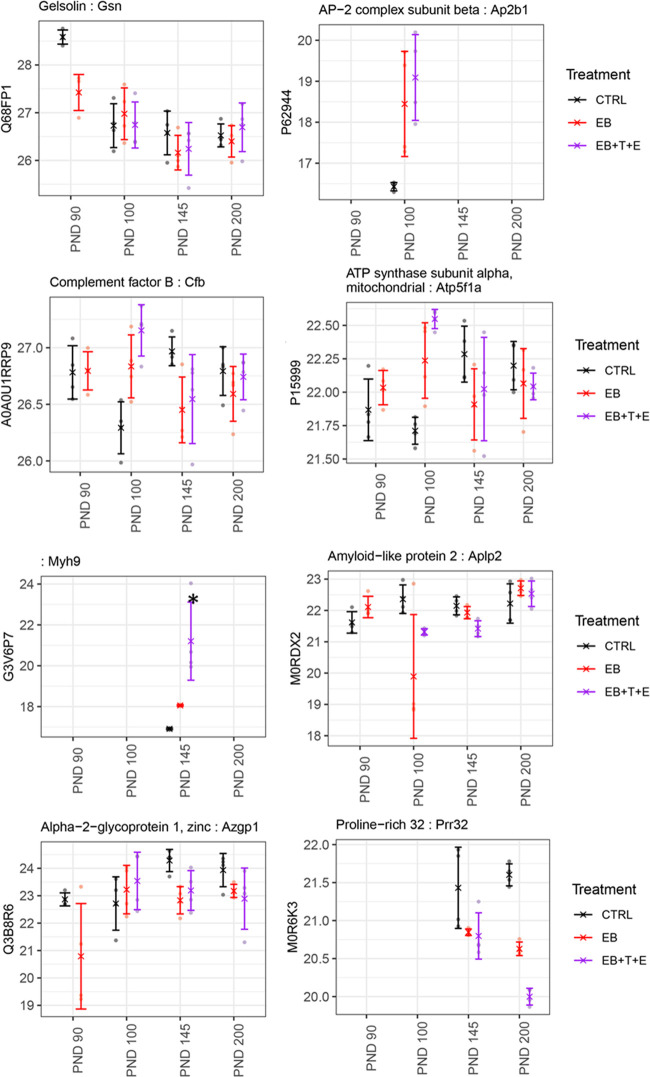
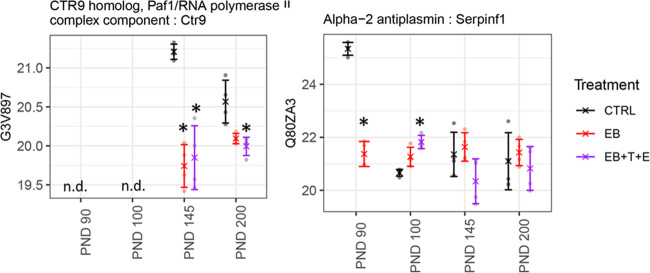
Protein levels encoded in the Gsn gene were significantly lower in the EB-treated group only on PND 90. The ATP5F1A and CFB protein levels were rather unique (Figure 3). On PND 100, protein levels in the rat plasma of the EB+T+E group had dramatically increased, while on PNDs 90, 145, and 200, no statistical significance in the levels for the treated group was observed (Figure 3). MYH9, AZGP1, and APLP2 were significantly lower in the EB+T+E group only on PND 145 (Figure 3). PRR32 levels were significantly lower in the EB and EB+T+E groups than in the control group only on PND 200 (Figure 3). Protein levels of CTR9 and ATGC1 were significantly lower in the EB and EB+T+E groups on PND 145 and in the EB+T+E group on PND 200. SERPINF1 protein levels were significantly lower in the EB-treated group on PND 90 but higher in the EB+T+E group on PND 100 (Figure 4).
Figure 3.
Comparison of relative protein abundance among control and treatment groups for GSN, AP2B1, CFB, ATPF51A, MYH9, APLP2, AZGP1, and PRR32. X indicates group mean, error bars represent mean ± standard deviation, and * indicates a significant change compared to the CTRL group.
Figure 4.
Comparison of relative protein abundance among control and treatment groups for CTR9 and SERPINF1. X indicates group mean, error bars represent mean ± standard deviation, and * indicates a significant change compared to the CTRL group.
3. Discussion
The present study found that the changes in the protein levels of rat plasma were time-treatment-specific on PNDs 90, 100, and 145 or 200. Across collection points, 40 proteins were without significant change upon treatment across collection points. Few altered proteins with statistical significances overlapped among the collection points. These findings suggest that such changes may be due to the responses to EB and T+E exposure or specifically to chronic inflammation (Figure 5). For example, GSN expression was significantly reduced only on PND 90, suggesting that neonatal EB exposure affected its expression. AP2B1, ATP5F1A, and CFB may have responded to the T+E exposure. The changes in SERPINF1 suggest that CTR9 and ACTG1 were significantly altered in the EB+T+E group on PNDs 145 and 200; these changes are associated with the occurrence of chronic inflammation. Taken together, these proteins are potential marker candidates for the development of chronic prostatitis.
Figure 5.
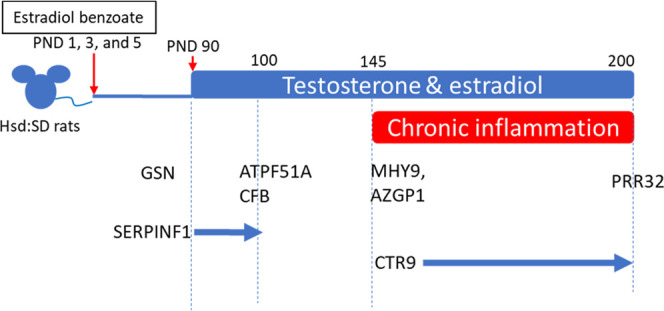
Association between proteins identified in this study and the responses to EB exposure, T+E exposure, and chronic inflammation.
In addition, within the treated groups, several proteins identified in the plasma also were expressed in the prostate and were previously reported in studies using samples from human prostate cancer patients.8,10−12,19
3.1. Gsn
GSN is highly expressed in prostate cancer, and its expression correlates with its progression.20
No expression of this protein/gene was observed in benign prostatic hyperplasia. At this point, we know of no reports linking gelsolin and an inflammatory response.
3.2. Ap2b1
This protein, encoded by the Ap2b1 gene, acts as one of the components (AP2 adaptor complex) that are related to clathrin-coated vesicles.21 Although no reports link AP2B1 protein and prostate cancer specifically, some studies on the AP2 adaptor complex and prostate cancer suggest that the influence of the complex may be due to other proteins that interact with the AP2 adaptor complex.22,23 As no inflammation was observed in the rat prostate on PND 100, the elevated E and T levels on PND 100 due to T+E exposure on PND 90 may have affected this change in the protein levels.17 Further studies are needed to elucidate the association between T+E exposure and protein levels.
3.3. Ctr9
The protein encoded in the Ctr9 gene is a key regulator of estrogen signaling in developing breast cancer.24 In the inflammation of prostate cancer, CTR9 levels in tumor tissues were upregulated tumor tissues treated with interleukin-15.25
3.4. Mhy9
MHY9 belongs to the myosin superfamily and may play a role in the progression, invasion, and metastasis of cancers. In addition, MHY9 is thought to act as a tumor suppressor in neck and head cancers.26 However, the role of this protein in prostate cancer has not yet been determined.
3.5. Azgp1
AZGP1 protein or the Azgp1 gene plays a role in lipolysis, which significantly reduces body fats.27 In prostate cancer, the loss of the AZGP1 protein or Azgp1 gene expression is associated with a higher risk of recurring prostate cancer after prostatectomy, the advanced progression of prostate cancer, or death from prostate cancer as the worst case.28−30 Thus, this protein/gene expression is a potential marker of prostate cancer in the clinic.31
3.6. Aplp2
This protein belongs to the amyloid precursor protein (APP) family, which is reported to show increased expression in prostate cancer.32,33 However, the changes in APLP2 expression levels are still unclear.
3.7. PRR32
The PRR32 protein is encoded by the CXorf64 gene. Expression levels in prostate cancer tissues were low (https://www.proteinatlas.org/ENSG00000183631-PRR32/pathology). The role of PRR32 in the prostate and in prostate cancer has not yet been determined.
3.8. Atp5f1aandcfb
Reduced levels of ATP5F1A positively correlate with the onset of prostate cancer (ages and clinical evaluation).34 This protein encoded by the Cfb gene includes alternative pathways for complement activation, which is a natural defense against infection. In the prostate, this protein was expressed in the tissues of benign prostatic hyperplasia.35
3.9. Serpinf1
Pigment epithelium-derived factor (PDEF) protein encoded by the Serpinf1 gene responded to neonatal exposure to EB and to T+E. The PDEF protein inhibits tumor progression in all cancer types (i.e., the development of malignancy, tumor cell migration invasion, and metastasis).36 In prostate cancer, the protein acts as an antiangiogenic, promoting neuroendocrine differentiation, suppressing tumor cell proliferation, inhibiting metastasis, and enabling the recruitment of macrophages.
Interestingly, the proteins serpin family A member 1 (SERPINA1) and SERPINF1 identified in this study were the same as those identified by other researchers via proteomic analysis. These proteins were identified using prostatitis patients’ seminal plasma.12 Decreased PDEF(SERPINF1) levels were found in the serum of prostate cancer patients, suggesting potential protein biomarkers.8 Thus, SERPINF1 (Serpinf1 gene) may be a potential biomarker for prostatitis and prostate cancer.
This is a preliminary study with a small number of subjects. Further studies are necessary to validate the findings using an increased number of human plasma samples from prostate cancer patients.
4. Conclusions
This study identified several proteins in the plasma of rats dosed with EB, T, and E. These proteins have also been reported to be expressed in the prostate. In addition, their presence was time-specific, suggesting that alterations in their expression may be dependent on responses to EB exposure, additional T+E exposure, or chronic inflammation. Some of the proteins identified in the rat models used in this study were the same as those that have been reported by other researchers to be altered in the serum of prostate cancer patients or in the seminal plasma of prostatitis patients. Our research, along with that of others, suggests that SERPINF1 (Serpinf1 gene) may be a potential biomarker for the development of prostatitis and of prostate cancer. As these proteins have been identified in rat plasma, further study is necessary to verify these findings using human plasma from prostatitis and prostate cancer patients.
5. Materials and Methods
5.1. Materials
All reagents were purchased from Thermo Fisher Scientific (Pittsburgh, PA) and Sigma-Aldrich (St. Louis, MO), unless otherwise indicated.
5.2. Animals and Treatments
Rat plasma that was collected and processed in a previous study was evaluated.17 The dosing of male offspring followed the method described by Ho et al.16 Briefly, fifty 11–13-week-old time-mated female Hsd:SD rats were purchased from Envigo (Indianapolis, IN) and delivered to the National Center for Toxicological Research (NCTR) on gestation day (GD) 3 (day of birth = PND 0) to produce male pups. The animals were housed individually and maintained under a 12/12 h light/dark cycle with controlled room temperature (23 ± 3 °C) and humidity (50 ± 20%). Their diet upon arrival was low-phytoestrogen 5K96 chow (Purina Mills, St. Louis, MO). Water was provided ad libitum. All animal procedures were approved by the NCTR Institutional Animal Care and Use Committee and followed the guidelines set forth by the National Research Council’s Guide for the Care and Use of Laboratory Animals.37
A total of 148 male offspring selected at birth (PND 0) were divided into two groups: untreated and EB-treated. In the EB-treated group, the male pups were injected subcutaneously with 2.5 mg/kg body weight (BW) EB (cat # E8515; Sigma-Aldrich) on PNDs 1, 3, and 5. Male pups in the untreated group were injected with a vehicle (tocopherol-stripped corn oil; #0290141584-400; ICN Biomedicals, Inc., Aurora, OH).
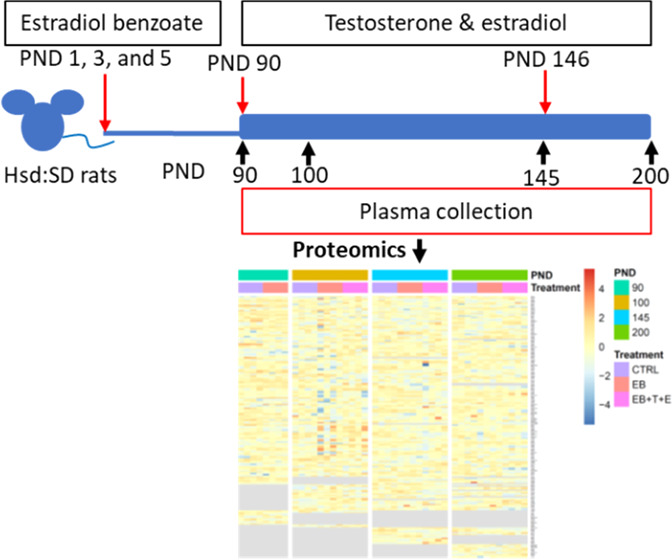
On PND 90, each group (untreated and EB-treated) was divided into two additional groups: control, T and 17β-estradiol (E) only, EB, and EB+T+E groups. Next, all animals were subcutaneously implanted with several Silastic tubes (Dow Corning, Midland, MI; internal diameter [ID], 1.47 mm; absorbance, 1.95 mm; cat# 11-189-15D, Fisher Scientific). Animals in the control and EB groups were implanted with three empty Silastic tubing inserts (two 2 cm tubes and one 1 cm tube); animals in the T+E only and EB+T+E groups were implanted with two Silastic tubes (two 2 cm tubes) packed with T powder (cat # T1500; Sigma-Aldrich) and one tube (one 1 cm tube) packed with E (cat# E8875; Sigma-Aldrich) for additional T and E treatment until PND 200. On PND 146, 8 weeks after the first surgery on PND 90, the 32 animals underwent a second hormone-containing tube implantation surgery for replacements. These animals were sacrificed on PND 200 (Figure 6).
Figure 6.
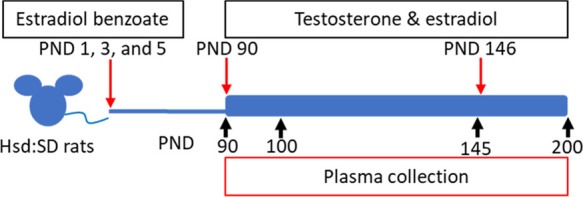
Scheme of the experimental design. Hsd:SD rats were administered 2.5 mg/kg estradiol benzoate (EB) on PNDs 1, 3, and 5 via subcutaneous injection. On PND 90, the animals received Silastic tube implants individually packed with estradiol (E) and testosterone (T), which were kept in place until PND 146. On PND 146, the implants were replaced.
5.3. Proteomic Analysis
Proteomic analysis was performed by Bioproximity LLC (https://www.bioproximity.com/; Manassas. VA).
We used rat samples from two groups (control and EB-treated) on PND 90 and from three groups (control, EB, and EB+T+E) on PNDs 100, 145, and 200 (n = 4 per group) for proteomic analysis. Previous studies noted chronic prostate inflammation was observed in only the EB+T+E group.17,18 Acute inflammation in rat prostates was observed in only the T+E group on PNDs 145 and 200. As the purpose of this study is to identify altered proteins in rat plasma with chronic prostatitis, we did not select the T+E only group.
5.3.1. Protein Depletion, Denaturation, Digestion, and Desalting
The plasma was thawed on ice, and 25 μL was removed for processing. Abundant proteins (rat serum albumin, IgG, fibrinogen, transferrin, IgM haptoglobin, and alpha-1-antitrypsin) were depleted using affinity chromatography (cat# SEP130; Seppro Rat, Sigma-Aldrich) according to the manufacturer’s directions. The samples were added to a final concentration of 1% sodium dodecyl sulfate (SDS; cat# 436143; Sigma-Aldrich) and 50 mM Tris–HCl, pH 8.0, and then were heated to 95 °C for 10 min. Next, samples were cooled, probe-sonicated, and clarified via centrifugation at 20 000g for 2 min. The final concentration of 5 mM Tris(2-carboxyethyl) phosphine hydrochloride (TCEP; cat# C4706; Sigma-Aldrich) were added to the samples and incubated at RT for 30 min, then samples were alkylated with 20 mM iodoacetamine (cat# I1149; Sigma-Aldrich) at RT for 30 min in the dark, then quenched by adding 20 mM dithiothreitol (cat# 1610611; Bio-Rad). Then, samples were digested with trypsin using the single-pot solid-phase-enhanced sample preparation (SP3) paramagnetic bead method previously described.38 The bead eluates were dried in a vacuum centrifuge and resuspended in mobile phase A.
5.3.2. Liquid Chromatography–Tandem Mass Spectrometry
Each digestion mixture was analyzed using ultrahigh performance liquid chromatography–tandem mass spectrometry (UHPLC-MS/MS). UHPLC was performed on an Easy-nLC 1200 (Thermo Fisher Scientific). Mobile phase A was 99.9% MilliQ water and 0.1% formic acid (Cat# 695076; Sigma-Aldrich). Mobile phase B was 80% acetonitrile (Cat# 34998, Sigma-Aldrich) and 0.1% formic acid. The 20 min LC gradient ran from 10% B to 30% B over 16 min, to 45% B over 4 min, and then to 80% B for the remaining 5 min. The samples were loaded directly into the column. The column was 15 cm × 100 μm I.D. and packed with 1.9 μm Reprosil-Pur C18-AQ media (Dr. Maisch, GmbH, Ammerbuch, Germany). The LC was interfaced to a quadrupole-Orbitrap mass spectrometer (Q-Exactive HF-X, Thermo Fisher) via nanoelectrospray ionization. An electrospray voltage of 2.0 kV was applied. The mass spectrometer was programmed to acquire, by data-dependent acquisition, tandem mass spectra from the top 12 ions in the full scan from 350 to 1400 m/z. Dynamic exclusion was set for 30 s, singly charged ions were excluded, isolation width was set to 1.6 Da, full MS resolution to 60 000, and MS/MS resolution to 15 000. The normalized collision energy was set to 27, automatic gain control to 3e6, max MS fill to 45 ms, and max MS/MS fill to 22 ms.
5.3.3. Data Processing and Library Search
Mass spectrometer RAW data files were converted to the mzML format using msconvert.39 MGF files were generated from the mzML files using OpenMS.40 All searches were performed on Amazon Web Services-based cluster compute instances using the Proteome Cluster interface. Briefly, all searches stipulated the requirements of 10 ppm for precursor mass tolerance, 0.02 Da fragment mass tolerance, strict tryptic cleavage with up to two missed cleavages, fixed modification of cysteine alkylation, variable modification of methionine oxidation, and protein-level expectation value scores of 0.0001 or lower. Proteome Cluster builds species- and genus-specific protein sequence libraries monthly from the most current UniProtKB distribution.41
The MGF files were searched using the most recent protein sequence libraries available from UniProtKB using X!Tandem42 and Comet.43 XML output files were parsed using Bibliospec44 and nonredundant protein sets were determined using Proteome Cluster based on previously published rules.45 MS1-based isotopic features were detected, and peptide peak areas were calculated using OpenMS.40,46 The proteins were required to have one or more unique peptides across the analyzed samples, with E-value scores of 0.0001 or less. Protein levels were compared with intensity-based absolute quantification (iBAQ), which is the sum of peak intensities of all peptides matching to a specific protein divided by the number of theoretically observable peptides.47
5.4. Statistical Analysis
For each PND, proteins missing more than half their value at each time point were excluded from further analysis, and a two-step missing value imputation was performed. Briefly, the missing values first were replaced with their group minimums. Next, the left missing values (the whole group missing) were replaced with half the minimum of all samples at the collection time point. The proteins were normalized to the total proteins (sum of iBAQ values) to reduce sample-to-sample variation. Principal component analysis (PCA) and partial least squares discriminant analysis (PLS-DA) were performed to cluster and classify the samples. Leave-one-out cross-validation (LOOCV) was used to evaluate the performance of the PLS-DA models. We used analysis of variance (ANOVA) to evaluate the effects of the treatments for each PND group, followed by a post hoc Dunnett’s test to compare the means of the treatment groups against the control group mean.48 The Benjamini–Hochberg method was used to calculate the false discovery rate (FDR).49 For multivariate analysis, statistical analysis, and data visualization, we employed R 3.6 software with packages mixOmics, multcomp, and ggplot2, respectively.50 Pathway analysis was performed with Ingenuity Pathway Analysis (IPA) software (https://www.qiagenbioinformatics.com/products/ingenuity-pathway-analysis).
Acknowledgments
The authors thank Dr. Li-Rong Yu and Dr. Pierre Alusta (NCTR) for their suggestions for the manuscript and Dr. John K. Leighton, Center for Drug Evaluation and Research (CDER), for his suggestion about this project proposal. N.N. thanks Ralph Patton and Kristie Voris, TPA, for plasma preparation and Patricia Shores and Kathy Carroll for preparing the cage cards. The authors thank Joanne Berger, FDA Library, for manuscript editing assistance. Special thanks should be given to Brian Balgley and Bioproximity for performing the protein profiling.
Supporting Information Available
The Supporting Information is available free of charge at https://pubs.acs.org/doi/10.1021/acsomega.1c01191.
Table S1: Top 10 proteins that mostly contribute to component 1 for each time point. Table S2: Ingenuity canonical pathways in rat plasma are significantly altered on PNDs 90, 100, 145, or 200 [−log (p-value)]. Table S3: List of quantified proteins in rat plasma in the EB-treated group on PND 90 and the EB and EB+T+E group on PNDs 100, 145, and 200. In column stat_status 0, 1, and NA indicate no significant change, significant change, or no quantitative comparison for the following comparisons: PND 90 EB vs control, PND 100 EB vs control, PND 100 EBTE vs control, PND 145 EB vs control, PND 145 EBTE vs control, PND 200 EB vs control, PND 200 EBTE vs control based on fold change ≥ 1.5, p < 0.05, and FDR < 0.2. (PDF) The mass spectrometry proteomics data have been deposited to the PRIDE Archive (http://www.ebi.ac.uk/pride/archive/) via the PRIDE partner repository with the data set identifier PXD024422.
Author Present Address
† Independent Researcher.
Author Contributions
N.N. conceived the idea and experimental design. Z.C. and N.N. wrote and finalized the manuscript. D.T.S. assisted in the experiments, sample preparation, and edited the manuscript. Z.C. performed the statistical analysis and provided figures and suggestions. N.N. finalized the manuscript incorporating all co-authors’ comments.
This study was funded by NCTR/FDA intramural fund (E0759701).
The views expressed are those of the authors and do not represent the views of the U.S. Food and Drug Administration.
The authors declare no competing financial interest.
Supplementary Material
References
- Nickel J. C. Prostatitis. Can. Urol. Assoc. J. 2011, 5, 306–315. 10.5489/cuaj.686. [DOI] [PMC free article] [PubMed] [Google Scholar]
- Krieger J. N.; Lee S. W.; Jeon J.; Cheah P. Y.; Liong M. L.; Riley D. E. Epidemiology of prostatitis. Int. J. Antimicrob. Agents 2008, 31, S85–S90. 10.1016/j.ijantimicag.2007.08.028. [DOI] [PMC free article] [PubMed] [Google Scholar]
- Collins M. M.; Stafford R. S.; O’Leary M. P.; Barry M. J. How common is prostatitis? A national survey of physician visits. J. Urol. 1998, 159, 1224–1228. 10.1016/S0022-5347(01)63564-X. [DOI] [PubMed] [Google Scholar]
- Zlotta A. R.; Egawa S.; Pushkar D.; Govorov A.; Kimura T.; Kido M.; Takahashi H.; Kuk C.; Kovylina M.; Aldaoud N.; Fleshner N.; Finelli A.; Klotz L.; Lockwood G.; Sykes J.; Kwast T. Prevalence of inflammation and benign prostatic hyperplasia on autopsy in Asian and Caucasian men. Eur. Urol. 2014, 66, 619–622. 10.1016/j.eururo.2014.06.026. [DOI] [PubMed] [Google Scholar]
- Batstone G. R. D.; Doble A. Chronic prostatitis. Curr. Opin. Urol. 2003, 13, 23–29. 10.1097/00042307-200301000-00005. [DOI] [PubMed] [Google Scholar]
- Sfanos K. S.; De Marzo A. M. Prostate cancer and inflammation: the evidence. Histopathology 2012, 60, 199–215. 10.1111/j.1365-2559.2011.04033.x. [DOI] [PMC free article] [PubMed] [Google Scholar]
- Califf R. M. Biomarker definitions and their applications. Exp. Biol. Med. 2018, 243, 213–221. 10.1177/1535370217750088. [DOI] [PMC free article] [PubMed] [Google Scholar]
- Tanase C. P.; Codrici E.; Popescu I. D.; Mihai S.; Enciu A. M.; Necula L. G.; Preda A.; Ismail G.; Albulescu R. Prostate cancer proteomics: Current trends and future perspectives for biomarker discovery. Oncotarget 2017, 8, 18497–18512. 10.18632/oncotarget.14501. [DOI] [PMC free article] [PubMed] [Google Scholar]
- Latonen L.; Afyounian E.; Jylha A.; Nattinen J.; Aapola U.; Annala M.; Kivinummi K. K.; Tammela T. T. L.; Beuerman R. W.; Uusitalo H.; Nykter M.; Visakorpi T. Integrative proteomics in prostate cancer uncovers robustness against genomic and transcriptomic aberrations during disease progression. Nat. Commun. 2018, 9, 1176 10.1038/s41467-018-03573-6. [DOI] [PMC free article] [PubMed] [Google Scholar]
- Larkin S. E.; Johnston H. E.; Jackson T. R.; Jamieson D. G.; Roumeliotis T. I.; Mockridge C. I.; Michael A.; Manousopoulou A.; Papachristou E. K.; Brown M. D.; Clarke N. W.; Pandha H.; Aukim-Hastie C. L.; Cragg M. S.; Garbis S. D.; Townsend P. A. Detection of candidate biomarkers of prostate cancer progression in serum: a depletion-free 3D LC/MS quantitative proteomics pilot study. Br. J. Cancer 2016, 115, 1078–1086. 10.1038/bjc.2016.291. [DOI] [PMC free article] [PubMed] [Google Scholar]
- Burgess E. F.; Ham A. J.; Tabb D. L.; Billheimer D.; Roth B. J.; Chang S. S.; Cookson M. S.; Hinton T. J.; Cheek K. L.; Hill S.; Pietenpol J. A. Prostate cancer serum biomarker discovery through proteomic analysis of alpha-2 macroglobulin protein complexes. Proteomics: Clin. Appl. 2008, 2, 1223. 10.1002/prca.200780073. [DOI] [PMC free article] [PubMed] [Google Scholar]
- Kagedan D.; Lecker I.; Batruch I.; Smith C.; Kaploun I.; Lo K.; Grober E.; Diamandis E. P.; Jarvi K. A. Characterization of the seminal plasma proteome in men with prostatitis by mass spectrometry. Clin. Proteomics 2012, 9, 2 10.1186/1559-0275-9-2. [DOI] [PMC free article] [PubMed] [Google Scholar]
- Russell P. J.; Voeks D. J.. Animal Models of Prostate Cancer. In Methods in Molecular Medicine; Springer, 2003; Vol. 81, pp 89–112. [DOI] [PubMed] [Google Scholar]
- Gilleran J. P.; Putz O.; DeJong M.; DeJong S.; Birch L.; Pu Y.; Huang L.; Prins G. S. The role of prolactin in the prostatic inflammatory response to neonatal estrogen. Endocrinology 2003, 144, 2046–2054. 10.1210/en.2002-0038. [DOI] [PubMed] [Google Scholar]
- Huang L.; Pu Y.; Alam S.; Birch L.; Prins G. S. Estrogenic regulation of signaling pathways and homeobox genes during rat prostate development. J. Androl. 2004, 25, 330–337. 10.1002/j.1939-4640.2004.tb02796.x. [DOI] [PubMed] [Google Scholar]
- Ho S. M.; Tang W. Y.; de Frausto J. B.; Prins G. S. Developmental exposure to estradiol and bisphenol A increases susceptibility to prostate carcinogenesis and epigenetically regulates phosphodiesterase type 4 variant 4. Cancer Res. 2006, 66, 5624–5632. 10.1158/0008-5472.CAN-06-0516. [DOI] [PMC free article] [PubMed] [Google Scholar]
- Nakamura N.; Pence L. M.; Cao Z.; Beger R. D. Distinct lipid signatures are identified in the plasma of rats with chronic inflammation induced by estradiol benzoate and sex hormones. Metabolomics 2020, 16, 95 10.1007/s11306-020-01715-w. [DOI] [PubMed] [Google Scholar]
- Nakamura N.; Davis K.; Yan J.; Sloper D. T.; Chen T. Increased estrogen levels altered microRNA expression in prostate and plasma of rats dosed with sex hormones. Andrology 2020, 8, 1360–1374. 10.1111/andr.12780. [DOI] [PubMed] [Google Scholar]
- Latonen L.; Nykter M.; Visakorpi T. Proteomics of prostate cancer - revealing how cancer cells master their messy genomes. Oncoscience 2018, 5, 216–217. 10.18632/oncoscience.453. [DOI] [PMC free article] [PubMed] [Google Scholar]
- Chen C. C.; Chiou S. H.; Yang C. L.; Chow K. C.; Lin T. Y.; Chang H. W.; You W. C.; Huang H. W.; Chen C. M.; Chen N. C.; Chou F. P.; Chou M. C. Secreted gelsolin desensitizes and induces apoptosis of infiltrated lymphocytes in prostate cancer. Oncotarget 2017, 8, 77152–77167. 10.18632/oncotarget.20414. [DOI] [PMC free article] [PubMed] [Google Scholar]
- Rappoport J. Z.; Benmerah A.; Simon S. M. Analysis of the AP-2 adaptor complex and cargo during clathrin-mediated endocytosis. Traffic 2005, 6, 539–547. 10.1111/j.1600-0854.2005.00280.x. [DOI] [PMC free article] [PubMed] [Google Scholar]
- Zi X.; Singh R. P.; Agarwal R. Impairment of erbB1 receptor and fluid-phase endocytosis and associated mitogenic signaling by inositol hexaphosphate in human prostate carcinoma DU145 cells. Carcinogenesis 2000, 21, 2225–2235. 10.1093/carcin/21.12.2225. [DOI] [PubMed] [Google Scholar]
- Puri C.; Chibalina M. V.; Arden S. D.; Kruppa A. J.; Kendrick-Jones J.; Buss F. Overexpression of myosin VI in prostate cancer cells enhances PSA and VEGF secretion, but has no effect on endocytosis. Oncogene 2010, 29, 188–200. 10.1038/onc.2009.328. [DOI] [PMC free article] [PubMed] [Google Scholar]
- Zeng H.; Xu W. Ctr9, a key subunit of PAFc, affects global estrogen signaling and drives ERalpha-positive breast tumorigenesis. Genes Dev. 2015, 29, 2153–2167. 10.1101/gad.268722.115. [DOI] [PMC free article] [PubMed] [Google Scholar]
- Rohena-Rivera K.; Sanchez-Vazquez M. M.; Aponte-Colon D. A.; Forestier-Roman I. S.; Quintero-Aguilo M. E.; Martinez-Ferrer M. IL-15 regulates migration, invasion, angiogenesis and genes associated with lipid metabolism and inflammation in prostate cancer. PLoS One 2017, 12, e0172786 10.1371/journal.pone.0172786. [DOI] [PMC free article] [PubMed] [Google Scholar]
- Wang Y.; Liu S.; Zhang Y.; Yang J. Myosin Heavy Chain 9: Oncogene or Tumor Suppressor Gene?. Med. Sci. Monit. 2019, 25, 888–892. 10.12659/MSM.912320. [DOI] [PMC free article] [PubMed] [Google Scholar]
- Russell S. T.; Zimmerman T. P.; Domin B. A.; Tisdale M. J. Induction of lipolysis in vitro and loss of body fat in vivo by zinc-alpha2-glycoprotein. Biochim. Biophys. Acta 2004, 1636, 59–68. 10.1016/j.bbalip.2003.12.004. [DOI] [PubMed] [Google Scholar]
- Lapointe J.; Li C.; Higgins J. P.; van de Rijn M.; Bair E.; Montgomery K.; Ferrari M.; Egevad L.; Rayford W.; Bergerheim U.; Ekman P.; DeMarzo A. M.; Tibshirani R.; Botstein D.; Brown P. O.; Brooks J. D.; Pollack J. R. Gene expression profiling identifies clinically relevant subtypes of prostate cancer. Proc. Natl. Acad. Sci. U.S.A. 2004, 101, 811–816. 10.1073/pnas.0304146101. [DOI] [PMC free article] [PubMed] [Google Scholar]
- Henshall S. M.; Horvath L. G.; Quinn D. I.; Eggleton S. A.; Grygiel J. J.; Stricker P. D.; Biankin A. V.; Kench J. G.; Sutherland R. L. Zinc-alpha2-glycoprotein expression as a predictor of metastatic prostate cancer following radical prostatectomy. J. Natl. Cancer Inst. 2006, 98, 1420–1424. 10.1093/jnci/djj378. [DOI] [PubMed] [Google Scholar]
- Severi G.; FitzGerald L. M.; Muller D. C.; Pedersen J.; Longano A.; Southey M. C.; Hopper J. L.; English D. R.; Giles G. G.; Mills J. A three-protein biomarker panel assessed in diagnostic tissue predicts death from prostate cancer for men with localized disease. Cancer Med. 2014, 3, 1266–1274. 10.1002/cam4.281. [DOI] [PMC free article] [PubMed] [Google Scholar]
- Sidaway P. Prostate cancer: AZGP1 expression predicts favourable outcomes. Nat. Rev. Urol. 2017, 14, 391 10.1038/nrurol.2017.86. [DOI] [PubMed] [Google Scholar]
- Pandey P.; Sliker B.; Peters H. L.; Tuli A.; Herskovitz J.; Smits K.; Purohit A.; Singh R. K.; Dong J.; Batra S. K.; Coulter D. W.; Solheim J. C. Amyloid precursor protein and amyloid precursor-like protein 2 in cancer. Oncotarget 2016, 7, 19430–19444. 10.18632/oncotarget.7103. [DOI] [PMC free article] [PubMed] [Google Scholar]
- Miyazaki T.; Ikeda K.; Horie-Inoue K.; Inoue S. Amyloid precursor protein regulates migration and metalloproteinase gene expression in prostate cancer cells. Biochem. Biophys. Res. Commun. 2014, 452, 828–833. 10.1016/j.bbrc.2014.09.010. [DOI] [PubMed] [Google Scholar]
- Feichtinger R. G.; Schafer G.; Seifarth C.; Mayr J. A.; Kofler B.; Klocker H. Reduced Levels of ATP Synthase Subunit ATP5F1A Correlate with Earlier-Onset Prostate Cancer. Oxid. Med. Cell. Longevity 2018, 2018, 1347174 10.1155/2018/1347174. [DOI] [PMC free article] [PubMed] [Google Scholar]
- Hata J.; Machida T.; Matsuoka K.; Hoshi S.; Akaihata H.; Hiraki H.; Suzuki T.; Ogawa S.; Kataoka M.; Haga N.; Ishibashi K.; Homma Y.; Sekine H.; Kojima Y. Complement activation by autoantigen recognition in the growth process of benign prostatic hyperplasia. Sci. Rep. 2019, 9, 20357 10.1038/s41598-019-57001-w. [DOI] [PMC free article] [PubMed] [Google Scholar]
- Becerra S. P.; Notario V. The effects of PEDF on cancer biology: mechanisms of action and therapeutic potential. Nat. Rev. Cancer 2013, 13, 258–271. 10.1038/nrc3484. [DOI] [PMC free article] [PubMed] [Google Scholar]
- National Research Council . Guide for the Care and Use of Laboratory Animals; National Academy Press: Washington, D.C., 2011. [Google Scholar]
- Moggridge S.; Sorensen P. H.; Morin G. B.; Hughes C. S. Extending the Compatibility of the SP3 Paramagnetic Bead Processing Approach for Proteomics. J. Proteome Res. 2018, 17, 1730–1740. 10.1021/acs.jproteome.7b00913. [DOI] [PubMed] [Google Scholar]
- Chambers M. C.; Maclean B.; Burke R.; Amodei D.; Ruderman D. L.; Neumann S.; Gatto L.; Fischer B.; Pratt B.; Egertson J.; Hoff K.; Kessner D.; Tasman N.; Shulman N.; Frewen B.; Baker T. A.; Brusniak M. Y.; Paulse C.; Creasy D.; Flashner L.; Kani K.; Moulding C.; Seymour S. L.; Nuwaysir L. M.; Lefebvre B.; Kuhlmann F.; Roark J.; Rainer P.; Detlev S.; Hemenway T.; Huhmer A.; Langridge J.; Connolly B.; Chadick T.; Holly K.; Eckels J.; Deutsch E. W.; Moritz R. L.; Katz J. E.; Agus D. B.; MacCoss M.; Tabb D. L.; Mallick P. A cross-platform toolkit for mass spectrometry and proteomics. Nat. Biotechnol. 2012, 30, 918–920. 10.1038/nbt.2377. [DOI] [PMC free article] [PubMed] [Google Scholar]
- Sturm M.; Bertsch A.; Gropl C.; Hildebrandt A.; Hussong R.; Lange E.; Pfeifer N.; Schulz-Trieglaff O.; Zerck A.; Reinert K.; Kohlbacher O. OpenMS - an open-source software framework for mass spectrometry. BMC Bioinform. 2008, 9, 163 10.1186/1471-2105-9-163. [DOI] [PMC free article] [PubMed] [Google Scholar]
- UniProt Consortium . UniProt: a hub for protein information Nucleic Acids Res. 201543D204–D212. 10.1093/nar/gku989. [DOI] [PMC free article] [PubMed] [Google Scholar]
- Craig R.; Beavis R. C. TANDEM: matching proteins with tandem mass spectra. Bioinformatics 2004, 20, 1466–1467. 10.1093/bioinformatics/bth092. [DOI] [PubMed] [Google Scholar]
- Eng J. K.; Jahan T. A.; Hoopmann M. R. Comet: an open-source MS/MS sequence database search tool. Proteomics 2013, 13, 22–24. 10.1002/pmic.201200439. [DOI] [PubMed] [Google Scholar]
- Frewen B.; MacCoss M. J. Using BiblioSpec for creating and searching tandem MS peptide libraries. Curr. Protoc. Bioinform. 2007, 20, 13.7.1–13.7.12. 10.1002/0471250953.bi1307s20. [DOI] [PubMed] [Google Scholar]
- Slotta D. J.; McFarland M. A.; Markey S. P. MassSieve: panning MS/MS peptide data for proteins. Proteomics 2010, 10, 3035–3039. 10.1002/pmic.200900370. [DOI] [PMC free article] [PubMed] [Google Scholar]
- Weisser H.; Nahnsen S.; Grossmann J.; Nilse L.; Quandt A.; Brauer H.; Sturm M.; Kenar E.; Kohlbacher O.; Aebersold R.; Malmstrom L. An automated pipeline for high-throughput label-free quantitative proteomics. J. Proteome Res. 2013, 12, 1628–1644. 10.1021/pr300992u. [DOI] [PubMed] [Google Scholar]
- Schwanhäusser B.; Busse D.; Li N.; Dittmar G.; Schuchhardt J.; Wolf J.; Chen W.; Selbach M. Global quantification of mammalian gene expression control. Nature 2011, 473, 337–342. 10.1038/nature10098. [DOI] [PubMed] [Google Scholar]
- Dunnett C. W. A Multiple Comparison Procedure for Comparing Several Treatments with a Control. J. Am. Stat. Assoc. 1955, 50, 1096–1121. 10.1080/01621459.1955.10501294. [DOI] [Google Scholar]
- Benjamini Y.; Hochberg Y. Controlling the False Discovery Rate: A Practical and Powerful Approach to Multiple Testing. J. R. Stat. Soc., Ser. B 1995, 57, 289–300. 10.1111/j.2517-6161.1995.tb02031.x. [DOI] [Google Scholar]
- R Core Team . R: A Language and Environment for Statistical Computing, 3.6; R Foundation for Statistical Computing, 2019. [Google Scholar]
Associated Data
This section collects any data citations, data availability statements, or supplementary materials included in this article.


