Abstract
Purpose
To investigate 50 week ultrasound imaging and ultrastructure changes of bladder in diuresis and diabetes rats.
Methods
Forty-two healthy male Sprague–Dawley rats were randomly divided into control group, sugar-induced diuresis group and streptozotocin-induced diabetes group. The 24 h drinking and urine volume were calculated from 21 to 31 weeks. Using ultrasound to assess bladders after 49 weeks. Bladders were examined by transmission electron microscope after 50 weeks.
Results
The drinking and urine volume significantly increased in the diuresis and diabetes groups. The bladder morphology and bladder wall thickness increased in the diuresis and diabetes groups. Bladder stones, bladder overdistension and urinary retention were seen in the diuresis and diabetes groups. Urothelium manifested degeneration, denudation and necrosis in the diuresis and diabetes groups. The mitochondrial vacuolar degeneration in the urothelial cells was seen in the diabetes group. The subepithelial vascular endothelial cells hyperplasia with a narrowed lumen were observed in the diabetes group. Abnormal mitochondria were rarely seen in the control group. The mitochondrial vacuolar degeneration in the detrusor was more severe in the diabetes group than in the diuresis group. The detrusor muscle and axon degeneration were observed in the diuresis and diabetes groups. Two rats in the diuresis group share similarities with diabetes group (2/6).
Conclusion
Long-term diabetes mellitus can cause increments of urinary bladder morphology and bladder wall thickness, urinary retention and bladder stones. Ultrastructural degeneration of the bladder might be the morphological bases of diabetic cystopathy.
Supplementary Information
The online version contains supplementary material available at 10.1007/s11255-021-02911-w.
Keywords: Urinary bladder, Diabetes mellitus, Diuresis, Ultrasonography, Microscopy, Electron
Introduction
Diabetic cystopathy (DCP) is a common complication of diabetes mellitus (DM). The urodynamic findings include reduced bladder sensation, increased cystometric bladder capacity, decreased bladder contractility, impaired uroflow, and increased residual urine volume later [1]. However, the pathogenesis of DCP has not been fully elucidated.
Previous studies have revealed the ultrastructure changes in neurogenic and non-neurogenic bladder dysfunction and compared with the urodynamic findings [2–4]. The ultrastructure abnormalities may explain the lower urinary tract symptoms. Pathological research of DCP is limited [5, 6]. Impact of persistent and chronic hyperglycemia induced urinary bladder dysfunction is poorly understood.
Ultrasound imaging has become increasingly important in the assessment of lower urinary tract dysfunction. Using ultrasound to assess bladders of diabetic animals has not been conducted before.
The characteristic of polydipsia and polyuria with DM may influence the function of the urinary bladder in some degree [7]. We use 5% white granulated sugar-induced osmotic diuresis (OD) to imitate polydipsia and polyuria.
The objective of this study is to investigate the long-term (50 weeks) ultrasound imaging and ultrastructure abnormalities of bladder after sugar diuresis and diabetes mellitus in rats, providing morphological bases of DCP.
Methods
Experimental animals and designs
Adult male Sprague–Dawley rats (8 weeks old, Xinjiang Medical University Laboratories, Urumchi, China) were randomly divided into control group (n = 12), OD group (n = 12) and DM group (n = 18). Diabetes mellitus was induced by a single intraperitoneal injection of 50 mg/kg body weight of streptozotocin (STZ, Sigma, USA) dissolved in a citrate buffer (0.1 M, pH 4.5). Animals with blood glucose higher than 16.7 mmol/L with an automatic glucometer (Accu-Chek®, Roche, Germany) 72 h after STZ injection were classified as diabetic [7]. Osmotic diuresis was induced by adding 5% white granulated sugar to the rats’ daily drinking water. The diuresis and age-matched control rats were injected with a proportionate volume of buffer alone. Blood glucose was measured weekly. To prevent excessive hyperglycemia and death, DM rats received three units of NPH human insulin (Lilly, France) injection if the blood glucose was higher than 33.3 mmol/L (HI was displayed on the glucometer). The experimental protocol was approved by the first affiliated hospital of Shihezi University Institutional Animal Care and Use Committee.
Drinking and voiding volume measurement
From 21 to 31 weeks, the rats were placed in metabolic cages. The animals were housed in groups of two per cage. A known volume of water or 5% sugar was placed in the drinking bottles. Urine was collected by clean plastic cups. At the end of 24 h, the remaining volume in the drinking bottles and voiding volumes were measured, and the consumed volume was calculated.
Ultrasound assessment
Skin preparation and water deprivation were performed before measurement. The probe of the clinical ultrasound machine (Hitachi, EZU-MT28-S1,12 MHz linear probe; Tokyo, Japan) was placed over the suprapubic area in awake rats.
Empty bladder was ensured by four steps. First, water deprivation for more than 3 h. Second, the operator applied a gentle force to the suprapubic area to promote micturition before measurement [8]. Then, the sonographer used the ultrasonic probe to apply pressure to the suprapubic area and verify the filling and emptying state of the bladder. Finally, if PVR existed, the operator repeated step two and three at least once [9]. As for diabetic rats, if PVR were still existence, urinary retention was considered.
When there was no discharge of urine after the above operation, ultrasound acquisitions were quickly performed considering empty bladder. Images of bladders were recorded in both sagittal and transverse plane. The greatest transverse (width), anterioposterior (depth), and superioinferior (height) distances and bladder wall thickness (BWT) were recorded. The BWT was measured on the transverse plane. We measured at least eight positions on the ventral and dorsal side on the images using ImageJ (1.53c). And means were calculated for analyzing the BWT. The ultrasound was performed by the same sonographer.
Transmission electron microscope (TEM) examination
Animals were euthanized by excess pentobarbital anesthesia at 50 weeks (n = 6, control; n = 6, OD; n = 6, DM). The dome of bladder was quickly sliced into 1 mm3. The samples were immersed in 2.5% glutaraldehyde solution for 48 h and further fixed in 1% osmium tetroxide for 1.5 h. Tissues were dehydrated by an acetone series and embedded in epoxy resin. Ultrathin sections were stained with uranyl acetate and lead citrate. The samples were viewed with the JEOL 1200 TEM (JEOL Ltd., Akishima, Tokyo, Japan).
Changes in the urothelium and detrusor smooth muscle were recorded. The quantification of the different stages of mitochondrial vacuolar degeneration in the detrusor used the methods described by Chaanine [10] and Lu et al. [4] Each mitochondrion was evaluated as 0–5 to represent the severity of structural destruction. Additional three photographs of different fields of detrusor were obtained randomly in each specimen in 12,000× magnification.
Statistical analysis
The results are expressed as the mean ± standard deviation. The quantitative data performed parametric test. Comparisons among three groups were performed using one-way analysis of variance followed by Dunnett’s t test or Kruskal–Wallis H test followed by Nemenyi test. Statistical analysis was performed using SPSS 26.0 (IBM Corp., NY, USA). P < 0.05 was considered statistically significant.
Results
General characteristics
The remaining rats in DM, OD and control were 8, 9 and 11, respectively (due to the COVID-19) up to 49 weeks. All the DM rats showed cataracts except one. The necrosis of tails was only observed in the DM rats. During 21–31 weeks, the DM group manifested weight loss, polydipsia and polyuria (nearly 4.3 times and 10.8 times compared to the control group, Table 1).
Table 1.
General characteristics
| n | Weight (g) |
Glucose (mmol/L) |
Drinking (mL) |
Urine (mL) |
|
|---|---|---|---|---|---|
| Control | 6 | 538 ± 69 | 5.8 (5.1, 6.4)b | 327 ± 43c | 79 ± 19d |
| OD | 6 | 553 ± 72 | 6.3 (5.9, 6.9) | 695 ± 88 | 360 ± 67 |
| DM | 6 | 351 ± 102a | > 33.3 | 1404 ± 136 | 802 ± 11 |
aStatistical significance for the DM group compared to the control group (P = 0.017). Statistical significance for the DM group compared to the control and OD group (P = 0.025)
bStatistical significance for the control group compared to the OD group (P = 0.022). Statistical significance for the control group compared to the DM group (P < 0.001)
cStatistical significance for the control group compared to the OD group (P < 0.001). Statistical significance for the control group compared to the DM group (P < 0.001)
dStatistical significance for the control group compared to the OD group (P < 0.001). Statistical significance for the control group compared to the DM group (P < 0.001)
Ultrasound assessment
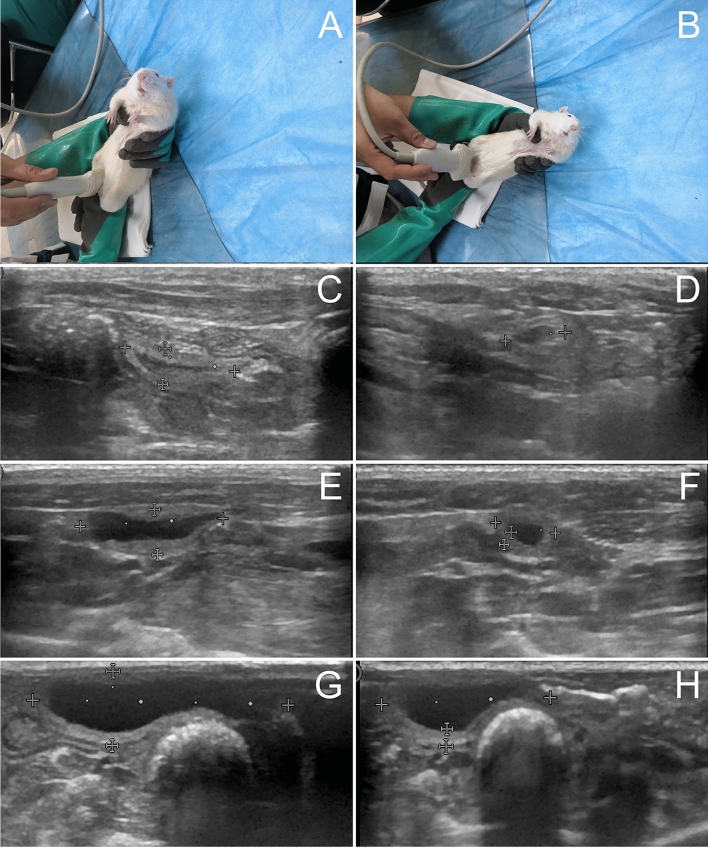
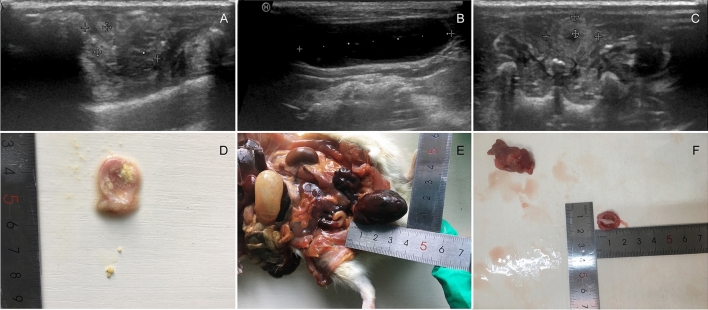
The bladder morphology and BWT increased in awake OD and DM rats (Fig. 1, Table 2). Bladder overdistension, urinary retention and bladder stones were noticed in OD and DM groups (Fig. 2). A diabetic rat showed bladder overdistension and micturated due to ultrasonic probe pressure. Urinary retention was observed after micturition (Fig. 1G, H). The bladder stone was invisible on the ultrasound imaging in the OD rat and accompanied by prostatic hyperplasia. The stone composition in the DM rat was calcium carbonate (Infrared Spectroscopy Analysis System, type LIIR-20, Tianjin).
Fig. 1.
Ultrasound imaging of bladders in awake rats A–G sagittal plan, B–H transverse plane. C, E and G were control, OD and DM groups. E The hypoechogenic detrusor was sandwiched between the hyperechogenic mucosa and adventitia. G A diabetic rat micturated due to ultrasonic probe pressure. Urine flow in urethra was observed. H The sphincter was closed after micturition. Compared to the control rats, urinary retention was observed
Table 2.
Ultrasound imaging characteristics
| n | Stone | Urinary retention | BWT (mm) |
Length (mm) |
Depth (mm) |
Width (mm) |
|
|---|---|---|---|---|---|---|---|
| Control | 11 | 0 | 0 | 0.83 ± 0.18 | 11.26 ± 1.43 | 3.22 ± 0.57 | 5.48 ± 0.80d |
| OD | 9 | 1* | 2** | 1.23 ± 0.26a | 13.53 ± 1.27b | 4.37 ± 0.29c | 5.87 ± 0.59 |
| DM | 8 | 2 | 2** | 1.92 ± 0.58a | 13.05 ± 1.36b | 5.32 ± 1.64c | 6.48 ± 1.10 |
No statistical significance between the OD and DM groups (a, P = 0.085. b, P = 0.536. c, P = 0.946)
*The bladder stone was invisible on the imaging in the OD rat
**Urinary retention rats were not included for analysis (width, length depth and BWT)
aStatistical significance for the OD group compared to the control group (P = 0.043). Statistical significance for the DM group compared to the control group (P < 0.001)
bStatistical significance for the OD group compared to the control group (P = 0.005). Statistical significance for the DM group compared to the control group (P = 0.033)
cStatistical significance for the OD group compared to the control group (P = 0.012). Statistical significance for the DM group compared to the control group (P = 0.006)
dNo statistical significance among three groups (P = 0.116)
Fig. 2.
Abnormal ultrasound findings A, D and C DM group. Multiple bladder stones. The increasement of the BWT. B, E and F OD group. Bladder overdistension. The existence of bladder stone and the prostatic hyperplasia was prominent
Ultrastructural characteristics
Urothelium lesions
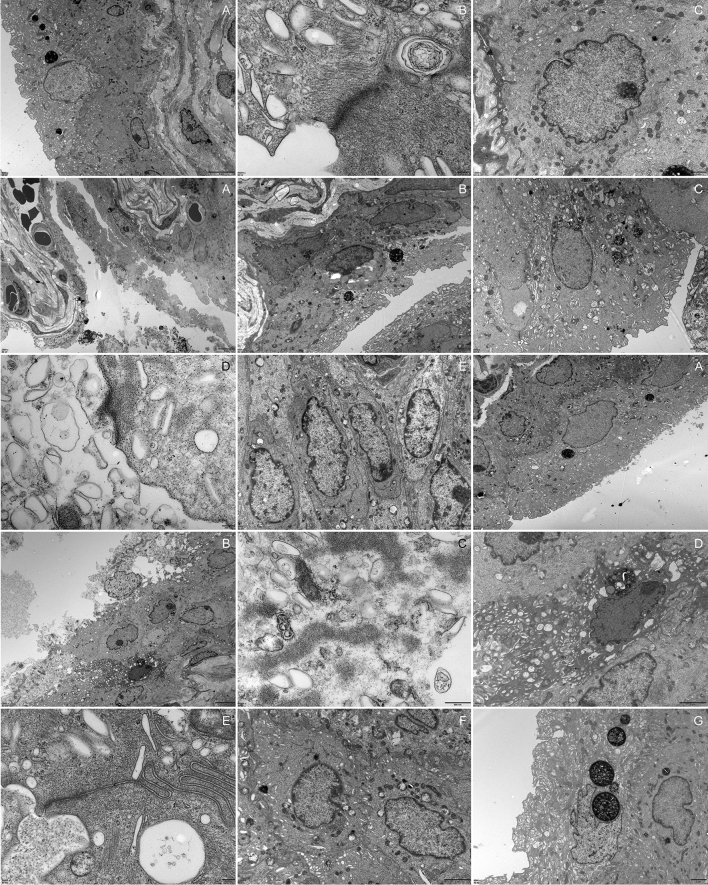
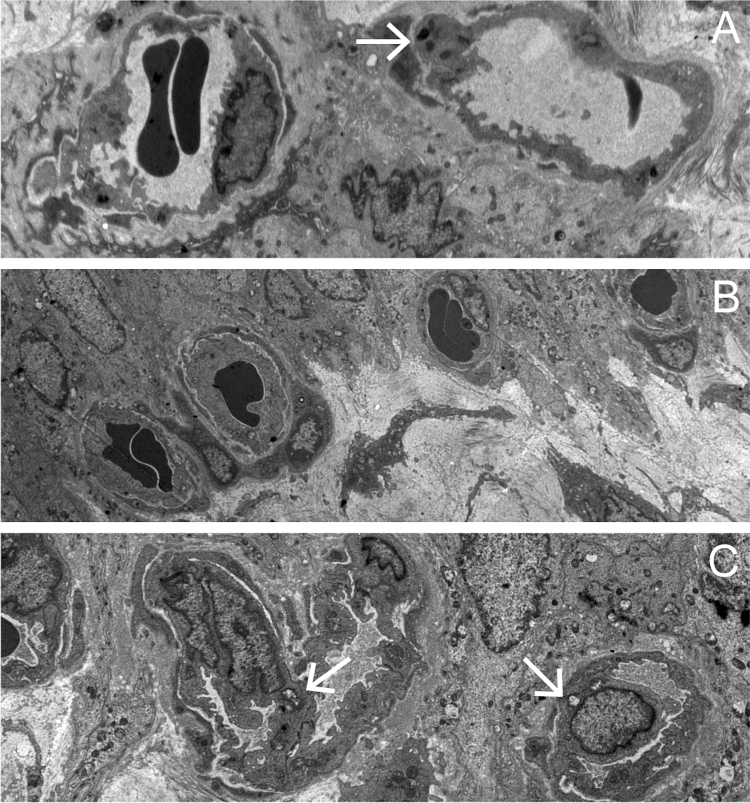
The urothelium degeneration, exfoliation and necrosis were observed in the OD and DM groups (Fig. 3, Table 3). An OD rat with hyperglycemia showed severe mitochondrial vacuolar degeneration in the urothelium. An OD rat with hyperglycemia showed steatosis of urothelial cells. In the DM group, the mitochondrial vacuolar degeneration in the urothelium was prominent. The endoplasmic reticulum was swollen in some cases. Cell junctions between adjacent umbrella cells were decreased. The subepithelial vascular endothelial cells hyperplasia with a narrowed lumen (Fig. 4) were observed in the DM group. The autophagosomes were observed both in the OD and DM groups (Fig. 5).
Fig. 3.
Urothelium lesions 1A–C, control group. 2A–E, OD group. 3A–G, DM group. 2A The urothelium showed desquamation, necrosis and cell debris was seen. 2B Steatosis of urothelial cells and urothelial exfoliation. 2C and 2E Obviously, mitochondrial vacuolar degeneration in the urothelium. The cell junctions were absent and the prominent gap was observed in adjacent umbrella cells. 2D The lysis of unilateral umbrella cell’ s cytoplasm. 3A The urothelium detached from the basement membrane. 3B–D The urothelial cells manifested degeneration, necrosis and remained bare nuclei and cell debris. The mitochondrial vacuolar degeneration and endoplasmic reticulum swollen was observed. 3E Cell junctions between adjacent umbrella cells were decreased. 3G A rat received regular insulin injection looking similar to control rats
Table 3.
Ultrastructure characteristics
| Urothelium exfoliation, necrosis | Grade of the mitochondrial vacuolar degeneration in the detrusor* | |||||||
|---|---|---|---|---|---|---|---|---|
| 0 | 1 | 2 | 3 | 4 | 5 | n | ||
| CON | 0 | 206 | 30 | 16 | 3 | 0 | 0 | 255 |
| OD | 5 | 116 | 60 | 33 | 6 | 4 | 1 | 220 |
| DM | 4 | 37 | 56 | 89 | 24 | 18 | 32 | 256 |
*Statistical significance for the OD group compared to the control group (P < 0.001). Statistical significance for the DM group compared to the control group (P < 0.001). Statistical significance for the DM group compared to the OD group (P < 0.001)
Fig. 4.
Vasculature in the vesicle lamina propria A control group, ×2500; B OD group, ×2000; C DM group, ×3000. The submucosa vascular endothelial cells hyperplasia with a narrowed lumen were observed in the diabetic group. The arrowhead showed the mitochondrial vacuolar degeneration in the vascular endothelial cells in the DM groups
Fig. 5.
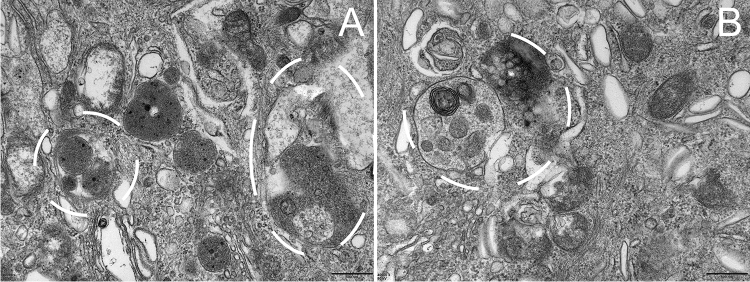
Autophagosomes in the urothelium A OD group, the autophagosome consists of double-membrane. B DM group, the autophagosome was adjacent to the lysosome
Detrusor lesions
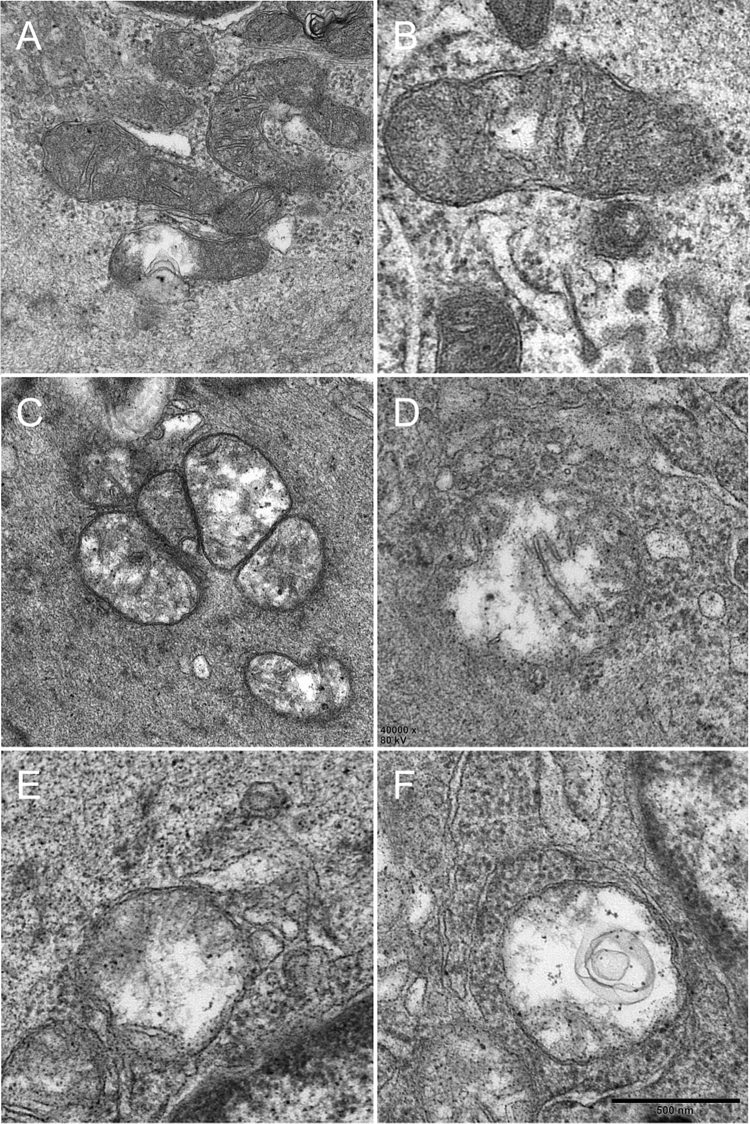
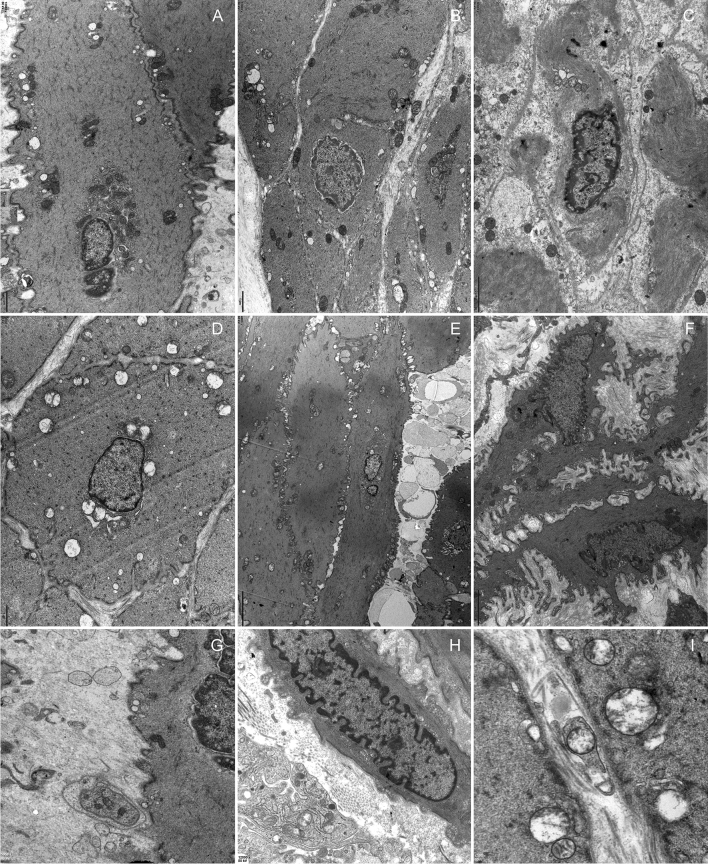
Rodlike mitochondria in the control group were widespread. However, globular mitochondria were seen in the DM group. The mitochondrial vacuolar degeneration in the detrusor was more severe in the DM group than the OD group (Figs. 6 and 7, Table 3). Abnormal mitochondria were rarely seen in the control group. The OD and DM groups showed degenerating muscle cells with disrupted sarcolemma, myofilaments and vacuolar degeneration, and cell junctions reduced with depleted caveolae. Flocculent degeneration was seen in the sarcoplasm and axoplasm of the DM rats. Local severe degeneration with indiscernible detrusor profile linked by protrusion junctions was observed in the DM rat. Distinctive protrusion junctions were observed in the DM rats. Neuroeffector junction with muscle cells were indiscernible and intrinsic nerves of detrusor degeneration were seen.
Fig. 6.
TEM revealed detrusor mitochondrial changes A normal mitochondria (grade 0). B–C. Loss and dissolution of the mitochondrial cristae in one (grade 1) or multiple mitochondrion area(s) (grade 2). D Mitochondrial swelling and progressive dissolution of the mitochondrial cristae (grade 3), E–F Complete loss and dissolution of the mitochondrial cristae and destruction of the inner mitochondrial membrane (grade 4) and the outer mitochondrial membrane rupture (grade 5). Reduced from ×400000
Fig. 7.
Muscularis lesions A and G, control group. B–C and H, OD group. D–F and I, DM group. A, B and D showed mitochondria at the same magnification. B–C, degenerating muscle cells with uneven thickness or focally disrupted sarcolemma, disrupted sarcoplasmic myofilaments and vacuolar degeneration, and cell junctions reduced with depleted caveolae. D predominant mitochondrial vacuolar degeneration. E Flocculent degeneration was seen in the sarcoplasm and axoplasm in which cytoplasm was replaced by amorphous particulate material. F Detrusor profile linked by protrusion junctions with moderately widened intercellular spaces, scarce intermediate muscle cell junctions. Note the distinctive nucleus coming into another cell. G–I Neuroeffector junction with muscle cells. H. Mitochondrial vacuolar degeneration in the axoplasm. I Axolemmas are fuzzy, breached, disrupted residual silhouettes of synaptic vesicles, and mitochondrial vacuolar degeneration
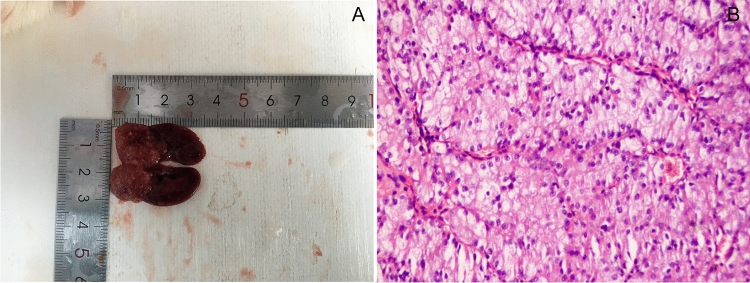
3 DM rats showed unilateral kidney tumor. One of them measured nearly 1.9 cm × 1.8 cm, invading the pelvicalyceal system, perirenal and renal sinus fat but not beyond Gerota’s fascia. Histopathology was renal cell carcinoma (Fig. 8).
Fig. 8.
Kidney neoplasm tumor cell with distinct cell membranes and optically clear cytoplasm. They are arranged in sheets, compact nests, alveolar, acinar and microcystic or even macrocystic structures, separated by an abundance of thin wall blood vessels (×200)
Discussion
Previously studies focused on the functional changes of DCP. Herein, we try to provide the histological appearance of DCP. As for the animal models, the longest time of previous research on diabetic rats was approximately 20 weeks. However, DM and its complications are always persistent and chronic.
Ultrasound demonstrated the morphology and BWT increased in the OD and DM groups. Combined with polydipsia and polyuria, bladder overdistension and urinary retention, the morphological changes may be a compensational adaptive response to diuresis and incomplete bladder emptying.
Little attention has been given to the ultrastructural changes of DM on the urinary bladder. Mitchell et al. reported the necrosis and desquamation of the umbrella cells in diabetic rats at 9 weeks, while the urothelium recovered at 20 weeks [6]. They attributed it to the burden of chronic hyperglycemia and adaptive response. Rizk et al. did not mention this phenomenon in diabetic rats at 6, 10 and 16 weeks [5]. However, the degeneration, necrosis and exfoliation of the urothelium still existed both in the OD and DM groups after 50 weeks. In some dead diabetic rats, the microorganism could be observed under microscopy. While we did not find obvious microorganisms under the TEM at 50 weeks. The urothelium is a barrier to urine. The urothelium exfoliation could also be seen in cyclophosphamide chemotherapy, BCG immunotherapy and radiotherapy. Therefore, they may be a response to injurious stimulus.
Lu et al. have performed morphometry of human detrusor mitochondria with urodynamic after partial bladder outlet obstruction [4]. They found that the mitochondrial damage score correlated with the linearized passive urethral resistance relationship score. The mitochondria of the vesical urothelium, subepithelial vasculature, detrusor muscle and axon manifested vacuolar degeneration in the DM.
The flocculent degeneration in the sarcoplasm and axoplasm was reported in unilateral sacral ventral rhizotomy in the cats [11]. This may indicate that the degeneration of detrusor muscle was associated with axon degeneration. Protrusion junctions were proposed as a manifestation of muscle cell de-differentiation associated with detrusor overactivity [12]. The detrusor and axon degeneration may explain incomplete bladder emptying. Neuromuscular dysfunction of bladder may be the structural bases of the detrusor overactivity and acontractile detrusor. And the bladder stone might be associated with chronic hyperglycemia, glycosuria, increased urine calcium excretion [13] and neuromuscular dysfunction [14].
Sugar-induced osmotic diuresis was often used to mimic the symptom of polyuria and polydipsia with DM. Liu et al. found time-dependent decrease of density of the nerves and vasculatures in the bladder tissues both in the diuresis and diabetes group. They concluded diabetes and diabetes-induced polyuria contributed to the alteration [15]. However long-term extra sugar intakes may cause impaired fasting glucose, impaired glucose tolerance and type 2 DM (T2DM) [16]. T2DM-induced bladder ultrastructural changes share similar manifestations with STZ-induced DM.
Hyperglycemia induced oxidative stress causing diabetic complications. Gene expression for oxidative stress in diabetic animals demonstrated a significant increase and a downstream effect on protein damage and apoptosis [17]. In diabetes, oxidative phosphorylation fails, leading to decreased ATP production and increased reactive oxygen species levels, which causes mitochondrial dysfunction and oxidative damage of urothelium, subepithelial vasculature, detrusor muscle and axons [18].
STZ-induced kidney tumors were first reported by Arison et al. [19]. WHO listed STZ as a cancerogen (group 2B) [20]. Dombrowski et al. reported nephrocarcinogenesis in spontaneously diabetic rats (no STZ injection) [21]. A previous study found that type 1 diabetes mellitus increased carcinogenic hazards to humans including kidney neoplasms [22]. Future studies need to research the mechanism of diabetes mellitus caused renal cell carcinoma.
Our study has some limitations. First, we could not collect the rat urine to analyze and build the association between urinary infections and the desquamation of the urothelium. The urine in the plastic cup was contaminated after 24 h. After anesthesia, there was not enough urine volume in the control rats (less than minimum requirement). Second, although we measured the BWT at an empty bladder depending the actual situation, a full bladder would be more accurate. However, this condition need anesthesia and diabetic rats may be intolerant. Even if a specified amount of water (for example 1.5 mL) were injecting into the bladder, ultrasonic probe pressure can promote micturition during measurement based on our experience and a former study [23]. Transurethral bladder catheterization can cause cystitis (Supplementary Fig. 1) and influence the ultrastructural results in this study.
Conclusions
Long-term diabetes mellitus can cause increments of urinary bladder morphology and bladder wall thickness, urinary retention and bladder stones. The histological degeneration of the urothelium, subepithelial vasculature, detrusor muscle and axon might be the pathological bases of DCP.
Supplementary Information
Below is the link to the electronic supplementary material.
Supplementary file1 (TIF 112879 KB) Supplementary fig 1 Acute cystitis after transurethral bladder catheterization Infiltration of abundant acute and chronic inflammatory cells in the urothelium, lamina propria and detrusor muscle in all three groups were observed. Congested and dilated blood vessels were seen. A, D and G, urothelium; B, E and H, lamina propria; C, F and I, detrusor muscle. A. control group; D. OD group; G. DM group (A, B, D, E and G, ×200; H, ×400; C, F and I, ×100)
Author contributions
QW: conceptualization, writing-review and editing, supervision, project administration, and funding acquisition. KY: methodology, software, validation, formal analysis, investigation, resources, data curation, writing—original, and visualization.
Funding
This study was supported by the National Natural Science Foundation of China (81960147).
Declarations
Ethics approval
The experimental protocol was approved by the first affiliated hospital of Shihezi University Institutional Animal Care and Use Committee.
Footnotes
Publisher's Note
Springer Nature remains neutral with regard to jurisdictional claims in published maps and institutional affiliations.
References
- 1.Wittig L, Carlson KV, Andrews JM, Crump RT, Baverstock RJ. Diabetic bladder dysfunction: a review. Urology. 2019;123:1–6. doi: 10.1016/j.urology.2018.10.010. [DOI] [PubMed] [Google Scholar]
- 2.Haferkamp A, Dörsam J, Resnick NM, Yalla SV, Elbadawi A. Structural basis of neurogenic bladder dysfunction. II. Myogenic basis of detrusor hyperreflexia. J Urol. 2003;169:547–554. doi: 10.1097/01.ju.0000042667.26782.c7. [DOI] [PubMed] [Google Scholar]
- 3.Elbadawi A, Hailemariam S, Yalla SV, Resnick NM. Structural basis of geriatric voiding dysfunction. VI. Validation and update of diagnostic criteria in 71 detrusor biopsies. J Urol. 1997;157:1802–1813. doi: 10.1016/S0022-5347(01)64867-5. [DOI] [PubMed] [Google Scholar]
- 4.Lu SH, et al. Morphological and morphometric analysis of human detrusor mitochondria with urodynamic correlation after partial bladder outlet obstruction. J Urol. 2000;163:225–229. doi: 10.1016/S0022-5347(05)68011-1. [DOI] [PubMed] [Google Scholar]
- 5.Rizk DEE, Padmanabhan RK, Tariq S, Shafiullah M, Ahmed I. Ultra-structural morphological abnormalities of the urinary bladder in streptozotocin-induced diabetic female rats. Int Urogynecol J Pelvic Floor Dysfunct. 2006;17:143–154. doi: 10.1007/s00192-005-1359-5. [DOI] [PubMed] [Google Scholar]
- 6.Hanna-Mitchell AT, et al. Impact of diabetes mellitus on bladder uroepithelial cells. Am J Physiol Regul Integr Comp Physiol. 2013;304:R84–R93. doi: 10.1152/ajpregu.00129.2012. [DOI] [PMC free article] [PubMed] [Google Scholar]
- 7.Xiao N, Wang Z, Huang Y, Daneshgari F, Liu G. Roles of polyuria and hyperglycemia in bladder dysfunction in diabetes. J Urol. 2013;189:1130–1136. doi: 10.1016/j.juro.2012.08.222. [DOI] [PMC free article] [PubMed] [Google Scholar]
- 8.Sartori AM, Schwab ME, Kessler TM. Ultrasound: a valuable translational tool to measure postvoid residual in awake rats? Eur Urol Focus. 2020;6:916–921. doi: 10.1016/j.euf.2019.11.016. [DOI] [PubMed] [Google Scholar]
- 9.D'Ancona C, et al. The International Continence Society (ICS) report on the terminology for adult male lower urinary tract and pelvic floor symptoms and dysfunction. Neurourol Urodyn. 2019;38:433–477. doi: 10.1002/nau.23897. [DOI] [PubMed] [Google Scholar]
- 10.Chaanine AH. Morphological stages of mitochondrial vacuolar degeneration in phenylephrine-stressed cardiac myocytes and in animal models and human heart failure. Medicina (Kaunas) 2019 doi: 10.3390/medicina55060239. [DOI] [PMC free article] [PubMed] [Google Scholar]
- 11.Elbadawi A, Atta MA. Intrinsic neuromuscular defects in the neurogenic bladder. III. Transjunctional, short- and long-term ultrastructural changes in muscle cells of the decentralized feline bladder base following unilateral sacral ventral rhizotomy. Neurourol Urodyn. 1984;3:245–270. doi: 10.1002/nau.1930030407. [DOI] [Google Scholar]
- 12.Elbadawi A, Yalla SV, Resnick NM. Structural basis of geriatric voiding dysfunction. III. Detrusor overactivity. J Urol. 1993;150:1668–1680. doi: 10.1016/S0022-5347(17)35868-8. [DOI] [PubMed] [Google Scholar]
- 13.Weinberg AE, Patel CJ, Chertow GM, Leppert JT. Diabetic severity and risk of kidney stone disease. Eur Urol. 2014;65:242–247. doi: 10.1016/j.eururo.2013.03.026. [DOI] [PMC free article] [PubMed] [Google Scholar]
- 14.Türk C et al (2020) In European Association of Urology Guidelines. 2020 Edition. Vol. Presented at the EAU Annual Congress Amsterdam 2020. The European Association of Urology Guidelines Office
- 15.Liu G, Li M, Vasanji A, Daneshgari F. Temporal diabetes and diuresis-induced alteration of nerves and vasculature of the urinary bladder in the rat. BJU Int. 2011;107:1988–1993. doi: 10.1111/j.1464-410X.2010.09840.x. [DOI] [PubMed] [Google Scholar]
- 16.Drouin-Chartier JP, et al. Changes in consumption of sugary beverages and artificially sweetened beverages and subsequent risk of type 2 diabetes: results from three large prospective U.S. cohorts of women and men. Diabetes Care. 2019 doi: 10.2337/dc19-0734. [DOI] [PMC free article] [PubMed] [Google Scholar]
- 17.Kanika ND, et al. Oxidative stress status accompanying diabetic bladder cystopathy results in the activation of protein degradation pathways. BJU Int. 2011;107:1676–1684. doi: 10.1111/j.1464-410X.2010.09655.x. [DOI] [PMC free article] [PubMed] [Google Scholar]
- 18.Feldman EL, et al. Diabetic neuropathy. Nat Rev Dis Primers. 2019;5:41. doi: 10.1038/s41572-019-0092-1. [DOI] [PubMed] [Google Scholar]
- 19.Arison RN, Feudale EL. Induction of renal tumour by streptozotocin in rats. Nature. 1967;214:1254–1255. doi: 10.1038/2141254a0. [DOI] [PubMed] [Google Scholar]
- 20.IARC (International Agency for Research on Cancer). Streptozotocin. IARC monographs on the identification of carcinogenic hazards to humans. Available: https://monographs.iarc.who.int/list-of-classifications. Accessed 06 May 2021
- 21.Dombrowski F, Klotz L, Bannasch P, Evert M. Renal carcinogenesis in models of diabetes in rats: metabolic changes are closely related to neoplastic development. Diabetologia. 2007;50:2580–2590. doi: 10.1007/s00125-007-0838-2. [DOI] [PubMed] [Google Scholar]
- 22.Carstensen B, et al. Cancer incidence in persons with type 1 diabetes: a five-country study of 9,000 cancers in type 1 diabetic individuals. Diabetologia. 2016;59:980–988. doi: 10.1007/s00125-016-3884-9. [DOI] [PMC free article] [PubMed] [Google Scholar]
- 23.Spinelli AE, et al. A non-invasive ultrasound imaging method to measure acute radiation-induced bladder wall thickening in rats. Radiat Oncol. 2020;15:240. doi: 10.1186/s13014-020-01684-3. [DOI] [PMC free article] [PubMed] [Google Scholar]
Associated Data
This section collects any data citations, data availability statements, or supplementary materials included in this article.
Supplementary Materials
Supplementary file1 (TIF 112879 KB) Supplementary fig 1 Acute cystitis after transurethral bladder catheterization Infiltration of abundant acute and chronic inflammatory cells in the urothelium, lamina propria and detrusor muscle in all three groups were observed. Congested and dilated blood vessels were seen. A, D and G, urothelium; B, E and H, lamina propria; C, F and I, detrusor muscle. A. control group; D. OD group; G. DM group (A, B, D, E and G, ×200; H, ×400; C, F and I, ×100)


