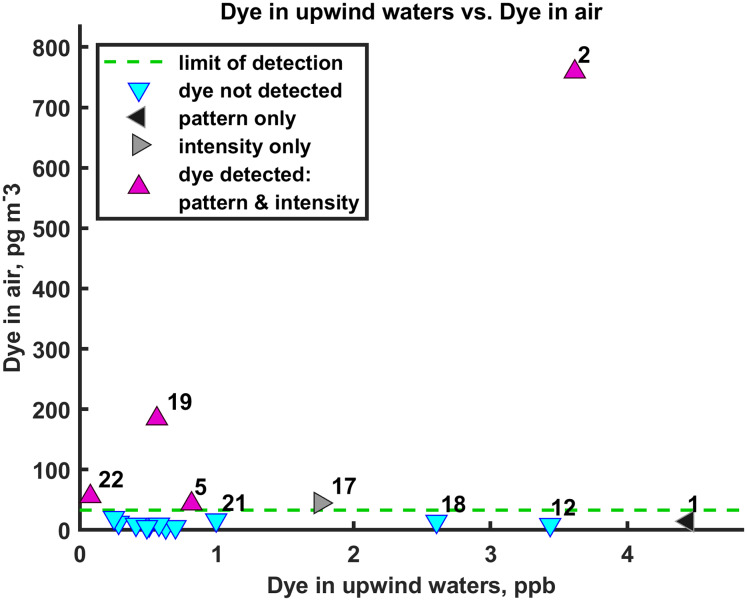
Figure 3. Dye concentrations in air and upwind waters.
For aerosol samples that were collected during periods of hyperspectral measurements of ocean dye concentrations (primarily daytime), the RWT concentration in the air (vertical axis) is compared against the dye concentration in the upwind source waters (horizontal axis). Symbol labels are sample numbers. A dye concentration in the air can be calculated whether dye was detected (magenta) or not (cyan) as dye detection relies both on values being above the blank and containing the RWT signature. The green dashed line indicates the limit of detection determined from the air field blanks and Eq. (1) (32.8 pg/m3). False positives would show up along a vertical line near 0 on the horizontal axis. Here, two air samples met one of two criteria for dye detection and two other air samples did as well, but do not appear here because sea surface RWT concentrations are not available for them.

