Abstract
We have determined the minimum number of base pairings necessary to stabilize DNA–Au NP aggregates as a function of salt concentration for particles between 15 and 150 nm in diameter. Significantly, we find that sequences containing a single base pair interaction are capable of effecting hybridization between 150 nm DNA–Au NPs. While traditional DNA hybridization involves two strands interacting in one dimension (1D, Z), we propose that hybridization in the context of an aggregate of polyvalent DNA–Au NP conjugates occurs in three dimensions (many oligonucleotides oriented perpendicular to the X, Y plane engage in base pairing), making nanoparticle assembly possible with three or fewer base pairings per DNA strand. These studies enabled us to compare the stability of duplex DNA free in solution and bound to the nanoparticle surface. We estimate that 4–8, 6–19, or 8–33 additional DNA bases must be added to free duplex DNA to achieve melting temperatures equivalent to hybridized systems formed from 15, 60, or 150 nm DNA–Au NPs, respectively. In addition, we estimate that the equilibrium binding constant (Keq) for 15 nm DNA–Au NPs (3 base pairs) is ~3 orders of magnitude higher than the Keq for the corresponding nanoparticle free system.
Introduction
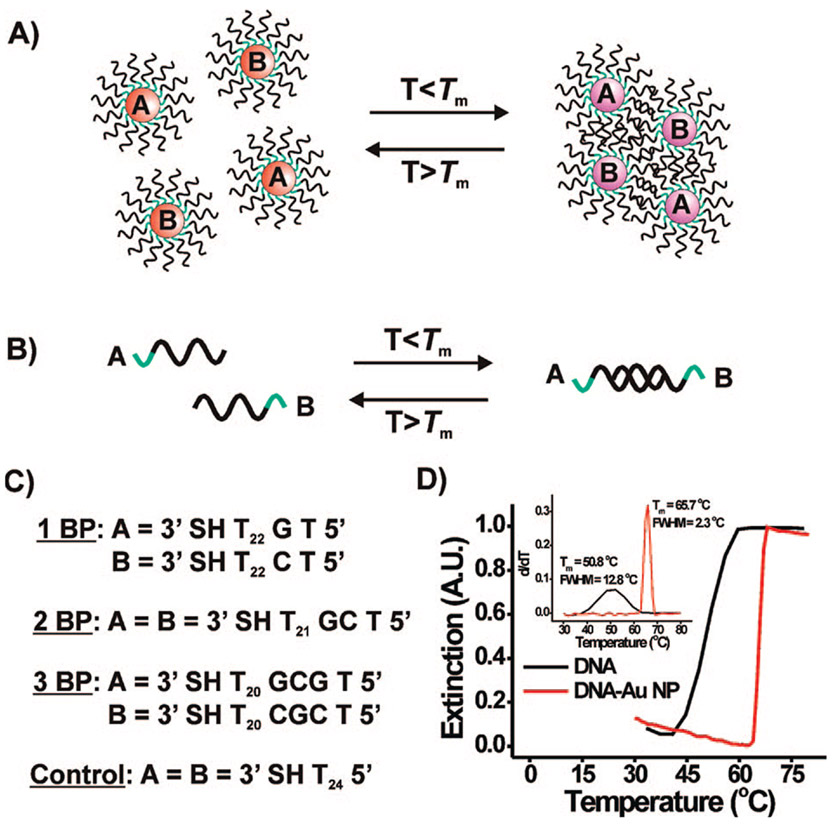
Since their introduction in 1996, polyvalent oligonucleotide gold nanoparticle conjugates (DNA–Au NP, polyvalent refers to many oligonucleotides per particle) have been studied extensively for their utility in diagnostic,1 therapeutic,2,3 intracellular RNA quantification,4 and gene regulation,2,3 and materials synthesis applications.1,5 Smaller monovalent particle conjugates (<2 nm) are also interesting but do not possess many of the properties of the larger polyvalent structures.6 Indeed, particle conjugates larger than ~3 nm exhibit plasmon resonances in the 520–560 nm region of the spectrum, which gives rise to their intense red color.1,6-8 When two sets of gold nanoparticles functionalized with many complementary DNA strands are combined, they form duplex DNA linkages leading to polymeric structures, which result in a dampening and red shifting of the surface plasmon resonance.1,9 This hybridization-induced particle aggregation process is reversible, and upon heating, the DNA linkages holding the particles together dehybridize (melting of the aggregate of DNA–Au NP conjugates) in a highly cooperative manner. Because of this cooperativity, the melting transitions for the aggregates formed from the polyvalent DNA–Au NPs are much sharper than those for free duplex DNA of the same base sequence (full width at half-maximum (fwhm) of the first derivative = ~2 °C, DNA–Au NP; vs ~13 °C, free DNA) and occur at a higher temperature (melting temperature (Tm) = ~66 °C, DNA–Au NP; ~51 °C, free DNA (Scheme 1D)).1,8 These sharp transitions have translated into selectivity advantages for diagnostic assays that use the polyvalent DNA–Au NPs as probes.10 Finally, the DNA–Au NPs typically bind DNA more tightly than free single-stranded DNA of the identical sequence. Indeed, the binding constant can be up to 100 times greater.11
Scheme 1a.
a General scheme for the hybridization and melting of (A) DNA–Au NP aggregates and (B) free DNA duplexes. A list of the DNA sequences that were used is presented in (C), while (D) shows typical melting curves obtained for a fully complementary 15-mer DNA duplex (black curve) and for nanoparticle (15 nm) aggregates prepared with the same fully complementary DNA sequences (red curve) (5′ SH A10 ATC CTT TAC AAT ATT 3′ and 5′ SH A10 AAT ATT GTA AAG GAT 3′).
The sharp melting transitions associated with aggregates of polyvalent DNA–Au NPs are attributed to the high degree of cooperativity that exists between the DNA strands packed closely together on the surface of the gold nanoparticle.12-14 This cooperative effect has been explored both experimentally and theoretically through investigation of the magnitude of (Tm) and breadth (fwhm) of the melting transitions as a function of parameters such as monovalent salt concentration, interparticle distance, and surface DNA density.12 The surface coverage of the DNA is important, and at high values, sharper transitions typically are observed. In addition, there is a more subtle salt influence on the transition. It has been proposed that with these densely packed structures, counterions from one duplex can help stabilize neighboring duplexes.12-14 Therefore, as the melting process is initiated, the removal of DNA strands and their counterions destabilizes the remaining links, leading to a melting cascade that occurs over a narrow temperature range.
Particle size is one important parameter that has not been fully studied in terms of its effect on the cooperative properties exhibited by aggregates of DNA–Au NPs. Indeed, until recently, reliable methods for loading large gold nanoparticles (between 50 and 250 nm diameter) with oligonucleotides did not exist.15 Larger gold nanoparticle conjugates (in this Article ≥60 nm gold cores) exhibit markedly different properties as compared to their small nanoparticle counterparts. In particular, we have noted that the larger particle conjugates will reversibly self-aggregate in moderate to high salt concentration solutions under experimental conditions where such aggregation is not seen with smaller (15 nm) DNA–Au NPs.15 Even particles that appear to have no significant complementarity can exhibit this type of aggregation. This type of aggregation presents a potential problem in terms of many particle conjugate uses, especially biodiagnostic applications.10,16-18 Therefore, developing an understanding of the cause of this aggregation process and methods for controlling it is of paramount importance for fully realizing the potential of these structures.
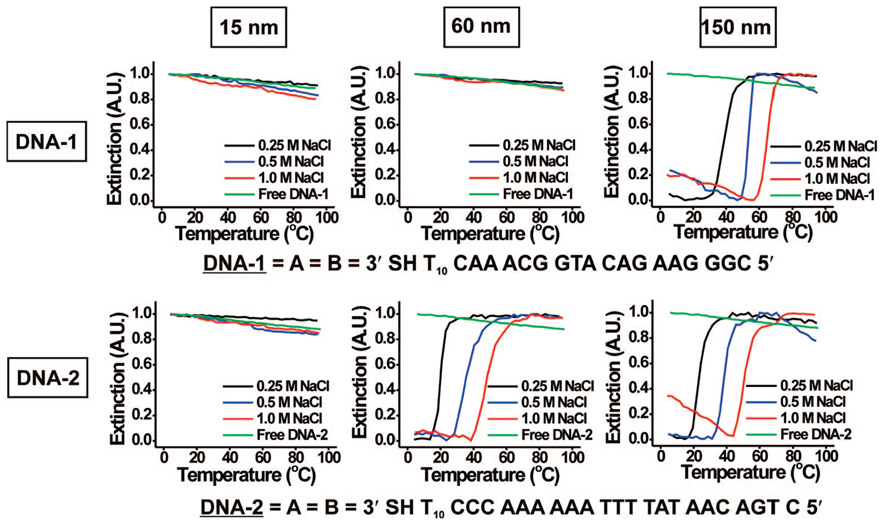
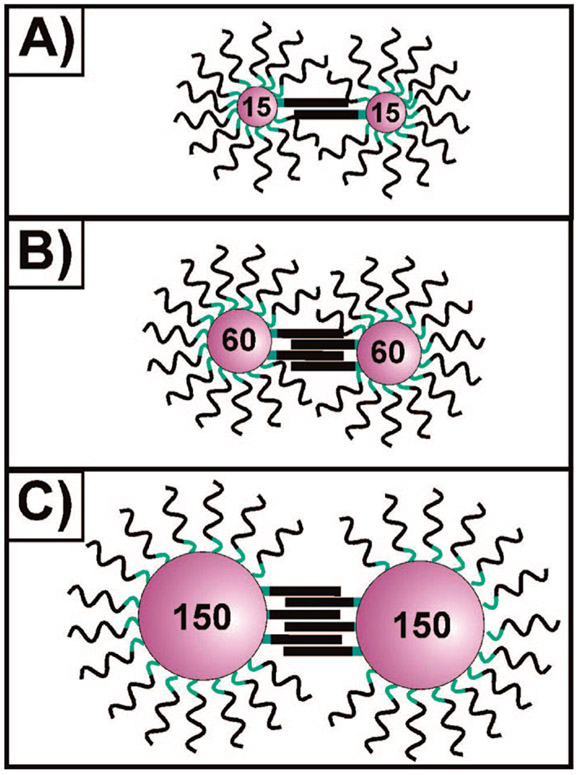
To investigate the cause of reversible aggregation in apparently noncomplementary particle systems, we performed melting experiments on aggregates made of such conjugates. Surprisingly, we found that the aggregates exhibited transitions that are as sharp as those seen for aggregates formed from fully complementary DNA–Au NPs (Figure 1, Scheme 1D).1,19 Because this aggregation was only occurring with larger DNA–Au NP conjugates, we hypothesized that, as these particles form more DNA linkages (due to their greater surface area), several weak individual DNA interactions (one to a few base pairing interactions) might be leading to a cumulative interaction strong enough to induce aggregation (i.e., polyvalency20,21) (Scheme 2). These observations led us to question (1) the minimum number of base pairing interactions required to effectively stabilize a nanoparticle aggregate, and (2) the relationship between this number and the size of the nanoparticle.
Figure 1.
Normalized melting curves (monitored at 260 nm) for 15, 60, and 150 nm DNA–Au NPs functionalized with either DNA-1 or DNA-2 at 0.25, 0.5, or 1.0 M NaCl. The green curve is the spectroscopic response of particle-free DNA-1 or DNA-2, respectively, at 1.0 M NaCl, the salt concentration studied that is most favorable for hybridization.
Scheme 2a.
a Scheme depicting the relative number of DNA linkages connecting aggregated DNA–Au NPs as a function of nanoparticle size for (A) 15, (B) 60, and (C) 150 nm nanoparticles.
Herein, we explore the relationship between nanoparticle size and the cooperative melting transition associated with aggregates of DNA–Au NPs. Significantly, we find that 150 nm DNA–Au NPs capable of only forming a single base pair per connection will hybridize and exhibit a highly cooperative melting transition typically associated with duplexes formed from long overlapping sequences (> 10 bases) between two types of complementary particles.1,19 We conclude that hybridization in the context of an aggregate of polyvalent DNA–Au NP conjugates constitutes a three-dimensional (3D) type of hybridization, making nanoparticle aggregation possible with smaller numbers of base pairings per duplex (less than 3). In the system we describe herein, nanoparticle structures with multiple oligonucleotides on their surfaces form stable base-pairing interactions with complementary particles, even though the same oligonucleotides do not form duplexes free of nanoparticles under identical conditions (Scheme 2). We postulate that the cumulative weak interactions between multiple pairs of adjacent strands lead to a structure that exhibits melting profiles typically associated with duplexes made of many complementary bases. This is in contrast to the traditional DNA duplex hybridization that only occurs between two strands oriented opposite of one another in one dimension.
Procedure
Materials.
Gold nanoparticles were purchased from Ted Pella (Redding, CA). Oligonucleotides were purchased from Integrated DNA Technologies, Inc. (Coralville, IA) or synthesized on an Expedite Nucleic Acid Synthesizer, using reagents acquired from Glen Research (Sterling, VA). Oligonucleotides that were synthesized on the Expedite were purified using Poly-Pak II cartridges (Glen Research) according to the manufacturer’s protocol. Dithiothreitol (DTT) was purchased from Pierce Biotechnology, Inc. (Rockford, IL). NAP-5 columns (Sephadex, G-25 DNA grade) were purchased from G. E. Healthcare (Piscatiway, NJ). Carbowax 20 M was purchased from Supelco, Inc. (Bellefonte, PA). All other salts and reagents were purchased from Sigma-Aldrich (St. Louis, MO). Quartz cuvettes for use in melting analyses were purchased from Hellma USA (Plainview, NY). Water (> 18.0 MΩ) purified using a Barnstead NANOpure Ultrapure water system was used for all experiments.
Instrumentation.
The concentrations of both gold nanoparticles and oligonucleotides were determined on a NanoDrop ND-1000 UV–vis spectrophotometer or a Cary 5000 UV–vis spectrophotometer. Melting experiments were performed using a Cary 100 UV–vis spectrophotometer. All sonication experiments were performed using a Branson 2510 sonicator.
DNA Sequence Design.
The DNA sequences we used in these investigations were a series of 24-mer oligonucleotides composed of: (1) a 3′ propyl thiol functionality, (2) a poly-T spacer, (3) a GC-rich section that, when combined with its complement, will have a 1, 2, or 3 base pair (BP) overlap, and (4) a single T capping base on the 5′ end (Scheme 1C). Each section of the oligonucleotide was designed to serve a key role in the experiment. The 3′ thiol functionality is used to anchor the DNA strand to the gold nanoparticle surface. The poly-T spacer separates the GC-rich recognition element from the nanoparticle surface so that it is accessible for hybridization. Poly-T sequences were selected as spacer units because these sequences, either free in solution or on the surface of a gold nanoparticle, do not exhibit hybridization and subsequent melting behavior (Supporting Information, Figure S1).22 Sequences with G and/or C bases were chosen to comprise the overlap region (1, 2, or 3 base pairs (BP) in length) because they form more stable base pairs than A–T-rich structures and will not hybridize with poly-T structures.23 A single T was added to the end of every sequence to increase nanoparticle stability by minimizing the possibility of G-quadruplex interactions.24,25
Preparation of Oligonucleotide-Modified Gold Nanoparticles.
Gold nanoparticles were functionalized with oligonucleotides using modified literature methods.15 Briefly, the disulfide protecting groups on the oligonucleotides were cleaved prior to nanoparticle functionalization. Specifically, DTT was added to lyophilized DNA and incubated at room temperature for 1 h (0.1 M DTT, 0.17 M phosphate buffer (PB), pH 8.0). The cleaved oligonucleotides were purified using a NAP-5 column and then added to an aqueous solution of gold nanoparticles (3 nmol of oligonucleotide/mL gold nanoparticles). The oligonucleotide/gold nanoparticle solution was allowed to incubate at room temperature overnight. Next, the concentrations of phosphate buffer and sodium dodecyl sulfate (SDS) were brought to 0.01 M and 0.01 (wt/vol) %, respectively. The concentration of NaCl was increased to 0.05 M using 2 M NaCl, 0.01 M PBS while maintaining a SDS concentration of 0.01%, and the mixture was sonicated for ~10 s. This process was repeated one more time to bring the NaCl concentration to 0.1 M. Next, the NaCl concentration was raised in 0.1 M increments until a final concentration of 1.0 M NaCl was reached. The salting process was followed by another overnight incubation at room temperature. To remove excess oligonucleotides, the gold nanoparticles were centrifuged, and the supernatant was removed, leaving a pellet of gold nanoparticles at the bottom of an Eppendorf tube. The particles then were resuspended in 0.01% solution of Triton X-100 in water. This washing process was repeated for a total of four supernatant removals. The nanoparticles were stored as a colloidal suspension in 0.01% Triton X-100 at 4 °C until further use.
Hybridization of Oligonucleotide-Modified Gold Nanoparticles.
After the washing step, the extinction values of the gold nanoparticle solutions were measured, and their concentrations were determined using Beer’s Law (A = εbc) (ε = 1.90 × 10⁷, 1.57 × 10⁸, 2.01 × 10⁹, 5.63 × 10⁹, and 1.87 × 10¹⁰ L/mol·cm for 15, 30, 60, 80, and 150 nm gold nanoparticles, respectively, at 560 nm). The total concentration of oligonucleotides in each sample then was determined using DNA loading values for sonicated particles with either a T10 or poly(ethylene glycol) (PEG) spacer (T10: 163, 550, 913, 1827, and 9760 strands/particle for 15, 30, 60, 80, and 150 nm gold nanoparticles, respectively. PEG: 1635 strands/particle for 60 nm nanoparticles).15
Using these values, the concentration of nanoparticle-bound DNA in solution was adjusted to 1.2 μM (15 nm nanoparticles) or 150 nM (30, 60, 80, 150 nm nanoparticles) using 0.01% Triton X-100. Both the nanoparticle-bound DNA and the nanoparticles contribute to the extinction of these conjugates at 260 nm. Because the 15 nm nanoparticles have a smaller extinction coefficient (vide supra) than the larger nanoparticles, a 150 nM solution of 15 nm nanoparticles (in terms of nanoparticle-bound DNA) gave a barely discernible spectral change upon melting. However, we found that this difference in nanoparticle-bound DNA concentration only affects the melting temperature (Tm) of the nanoparticle aggregates comprised of 15 nm DNA–Au NPs by ~3 °C (Supporting Information, Figure S2). As a result, we believe that the Tm’s of the higher concentration 15 nm nanoparticles and the lower concentration 30, 60, 80, and 150 nm nanoparticles can be compared.
To induce hybridization, the DNA–Au NPs (A and B) were combined with their appropriate complement (Scheme 1A), centrifuged, and resuspended in either a 0.25 M, 0.5 M NaCl, or 1.0 M NaCl, 0.01% Triton X-100, 0.01 M phosphate buffer (PB, pH 7.0) or a 1.0 M NaCl, 0.01% SDS, 0.01 M phosphate buffer. Surfactants, including Triton X-100 and SDS, commonly undergo phase transitions in the temperature range used in our melting experiments (4–95 °C).26 These phase transitions increase their absorbance and are affected, for example, by electrolyte concentration (Supporting Information, Figure S3). These transitions can obscure those of the DNA–Au NPs aggregates, if the two overlap. As a result, by testing two sets of nanoparticles at 1.0 M NaCl with different surfactants in hybridization/dehybridization experiments, we were able to get melting information for the DNA–Au NP aggregates over the entire temperature range. The same samples run in Triton X-100 and SDS showed no significant difference in Tm (Supporting Information, Figure S4). All DNA–Au NPs were allowed to equilibrate at room temperature for ~3 h, then at 4 °C overnight (~12 h) prior to testing.
Hybridization of Free Oligonucleotides.
Hybridization was carried out in the same manner as with the DNA–Au NPs (Scheme 1B). However, the free DNA was combined at a total concentration (A plus B) of 1 μM in 1.0 M NaCl, 0.01 M PB that did not contain surfactant.
Melting of Oligonucleotide-Modified Gold Nanoparticles and Free Oligonucleotides.
The samples were transferred to prechilled cuvettes (at 4 °C) for melting analysis on the Cary 100. The temperature was ramped from 4 to 95 °C at 1 °C/min with magnetic stirring. The extinction was monitored at 1 °C intervals at 260 nm for all particles and free DNA samples. Particles were also monitored at either 524 nm (15 nm nanoparticles) or 560 nm (30, 60, 80, and 150 nm). The Cary 100 was flushed with nitrogen during all measurements to prevent condensation on the outside of the cuvettes at lower temperatures. Although data were collected at two different wavelengths, only the data collected at 260 nm are presented in this Article. The traces at 524 and 560 nm exhibited similar melting transitions, however.
Results and Discussion
Gold nanoparticles (15, 30, 60, 80, 150 nm) were functionalized with propylthiol-modified oligonucleotides. Complementary DNA–Au NPs or complementary free DNA strands (A and B, Scheme 1A and B) were hybridized, and their melting transitions were recorded. These transitions are highly reproducible, as demonstrated by repeated hybridization/melting experiments that were performed on the same sample of DNA–Au NPs (Supporting Information, Figure S5). The Tm’s of these melting transitions, which are directly related to the strength of the binding interaction (hybridization) between the DNA–Au NP aggregates,11 were explored.
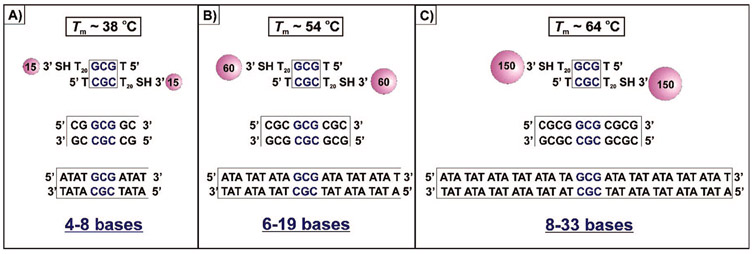
Free DNA strands (Scheme 1B), which contain a 1, 2, or 3 base pair (BP) complementary region, show no evidence of hybridization under any of the conditions studied (Figure 2A). Others have concluded that hybridization of strands with a small number of complementary bases (<4 pairings) is generally unfavorable but has been observed under nonbiological non-aqueous conditions.27 In contrast, when two batches of 15 nm diameter gold particles are functionalized respectively with two types of oligonucleotides containing only three complementary base pairings, they will hybridize and form an aggregate structure (Figure 2B). These structures melt like duplex DNA, but in a highly cooperative manner, similar to aggregates formed from particles with long complementary sequences (Scheme 1D).1,19 Indeed, we have begun to quantify the additional stability imparted on the DNA duplex by its immobilization on the nanoparticle surface. For example, we determined that 4–8, 6–19, or 8–33 additional DNA bases must be added to the free DNA duplex to reach melting temperatures that are equivalent to aggregates formed from 15, 60, or 150 nm DNA–Au NPs functionalized with 3 BP, respectively (1.0 M NaCl, Figure 3). The high number represents an AT-rich DNA duplex with the same 3 BP (GCG/CGC) overlap sequence at its core; the low number represents a DNA duplex made up of entirely GC pairs.
Figure 2.
(A) Temperature profiles (normalized, monitored at 260 nm) for free DNA duplexes with 1 BP, 2 BP, or 3 BP at 1.0 M NaCl. (B) Comparison of the temperature profile for 3 BP free DNA duplexes (which shows no melting behavior) with that of nanoparticle-bound 3 BP DNA–Au NP aggregates (15 nm nanoparticles) (which shows a sharp melting transition) at the same salt concentration (1.0 M NaCl).
Figure 3.
Graphics depicting the equivalent number of base pairings necessary to achieve equivalent melting temperatures for free DNA duplexes and aggregates of (A) 15 nm, (B) 60 nm, or (C) 150 nm DNA–Au NPs at 1.0 M NaCl. The Tm (salt-corrected, 1.0 M NaCl) for the free DNA duplexes was calculated for a 1.2 μM (for comparison to 15 nm) or a 0.15 μM (for comparison to 60 and 150 nm) free DNA concentration using the oligonucleotide properties calculator available at http://www.idtdna.com. This online calculator estimates that the melting temperature of the free DNA duplex strands that we analyzed in Scheme 1D is 46.1 °C. This predicted value is within error (~4 °C lower) to that obtained experimentally (Scheme 1D). These data confirm that it is valid to use this particular calculator to estimate melting temperatures of DNA duplexes.
Unlike free DNA strands, which can only form a single DNA duplex, DNA–Au NPs interact in three dimensions, all oriented perpendicular to the particle surface, allowing for the formation of base pairing interactions involving multiple complementary strands (Scheme 2). We hypothesized that sharp melting transitions occur for aggregates of DNA–Au NPs (for small numbers of base pairings (3 or fewer)) as a result of this three-dimensional hybridization. To develop an understanding of this type of nanoparticle-specific transition, we have investigated three experimental variables (i.e., salt concentration, nanoparticle size, and number of base pairs) and determined their relative contributions to DNA-functionalized nanoparticle aggregate stability. Understanding the relative importance of these variables and their effect on the nanoparticle-based system is critical to minimize instances of undesired hybridization between small regions of oligonucleotide complementarity, especially when working with larger DNA–Au NPs, in some of the diagnostic applications discussed above.
Effect of Salt Concentration.
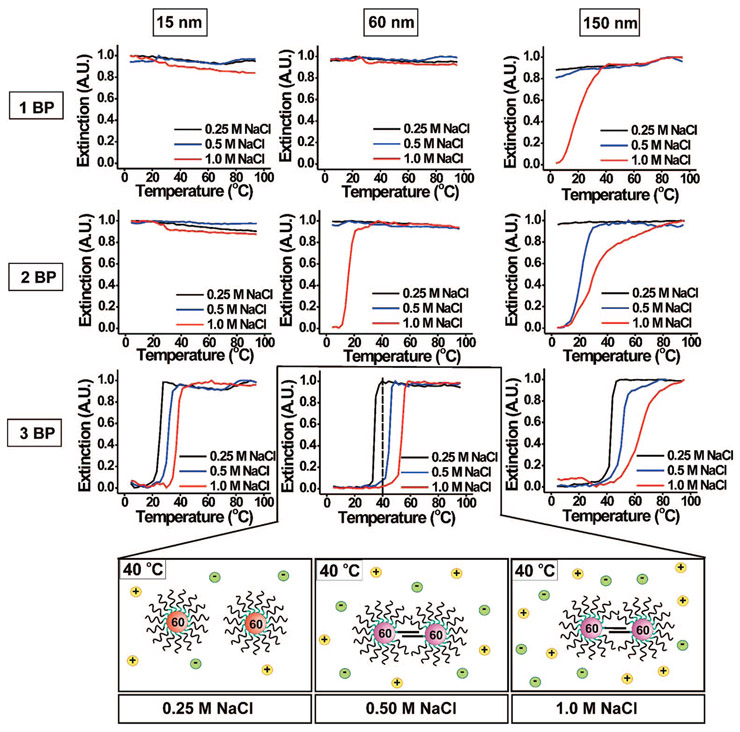
Salt stabilizes duplex DNA and has a similar effect on nanoparticle aggregates formed from duplex structures.12,27 We hypothesized that the aggregation described above (Figure 2B) was induced by the hybridization of strands containing only a three base pair overlap per DNA connection at the surface of the nanoparticles. If this hypothesis is correct, then the stability of that interaction should be highly salt-dependent. In addition, it might be possible to stabilize interactions that involve even fewer than three base pairs per DNA connection. To test the effect of salt concentration on aggregate stability, we investigated the melting transitions of the hybridized oligonucleotide–gold nanoparticle conjugate system as a function of particle size (15, 60, and 150 nm) and oligonucleotide sequence (1, 2, and 3 BP) for three different NaCl concentrations (0.25, 0.5, and 1.0 M). For a given size and sequence, the Tm’s of the DNA–Au NP aggregates increase with increasing salt concentration (Figure 4, Supporting Information, Figures S6 and S7). This trend has been observed previously in DNA duplex systems (including those bound to gold nanoparticles).12,27 This result suggests that DNA base pairings are mediating the melting transitions reported here.
Figure 4.
Normalized melting curves (monitored at 260 nm) of 15, 60, and 150 nm DNA–Au NPs aggregates for 1 BP, 2 BP, or 3 BP. Each graph shows the effect of changing salt concentration (0.25, 0.5, and 1.0 M NaCl) on the melting transition. The Tm of the duplex-interconnected aggregate structures is highly dependent on salt concentration. For example, at 40 °C, 60 nm nanoparticles (functionalized with 3 BP) remain unhybridized in 0.25 M aqueous NaCl, but are hybridized in solutions containing either 0.5 M NaCl or 1.0 M NaCl (bottom graphic).
For shorter sequences, hybridization only occurs in the case of the larger particles at high salt concentrations. For example, with only a single base pair possible per strand, only the 150 nm particles at a 1.0 M NaCl concentration exhibit hybridization and subsequent melting behavior (Figure 4, top right plot). Interestingly, this is the first time that oligonucleotide-functionalized structures with only a single base pair of complementarity have exhibited hybridization and formation of a complex stable enough to exhibit melting under aqueous conditions. As the possible base pair number per strand increases, smaller particles begin to hybridize. For example, with two base pairs, both the 60 and the 150 nm particles hybridize at a 1.0 M NaCl concentration (Figure 4). In addition, the 150 nm particles now hybridize at a 0.5 M NaCl concentration. With three base pairs per connection, all particles hybridize at all salt concentrations studied.
In addition, for a given number of base pairings, we find that as nanoparticle size increases, the difference in the Tm’s (ΔTm) between DNA–Au NP aggregates at low and high salt concentrations increases (i. e., from 12.3 °C for 15 nm nanoparticles, 3 BP to 26.9 °C for 150 nm nanoparticles, 3 BP) (Table 1). This is likely due to the greater surface area of the larger particles, which allows them to support more oligonucleotides and therefore a greater number of points of connection with complementary particles. As a result, the Tm’s of aggregates formed from 150 nm DNA–Au NPs are more affected by changes in salt concentration. Although Table 1 only shows data for 3 BP sequences, a similar trend was observed for the two other oligonucleotide sequences that were studied.
Table 1.
Melting Temperatures for 15, 30, 60, 80, and 150 nm DNA–Au NP Aggregates at 0.25 M NaCl and 1.0 M NaCl for 3 BPa
| Tm (°C) 3 BP | |||
|---|---|---|---|
| 0.25 M | 1.0 M | ΔTm (°C) | |
| 15 nm | 25.4 | 37.7 | 12.3 |
| 30 nm | 31.2 | 46.8 | 15.6 |
| 60 nm | 34.0 | 54.1 | 20.1 |
| 80 nm | 35.5 | 58.7 | 23.2 |
| 150 nm | 42.9 | 63.8 | 20.9 |
The rightmost column lists the difference in Tm between the low salt (0.25 M NaCl) and high salt (1.0 M NaCl) samples for each particle size.
Effect of Nanoparticle Size.
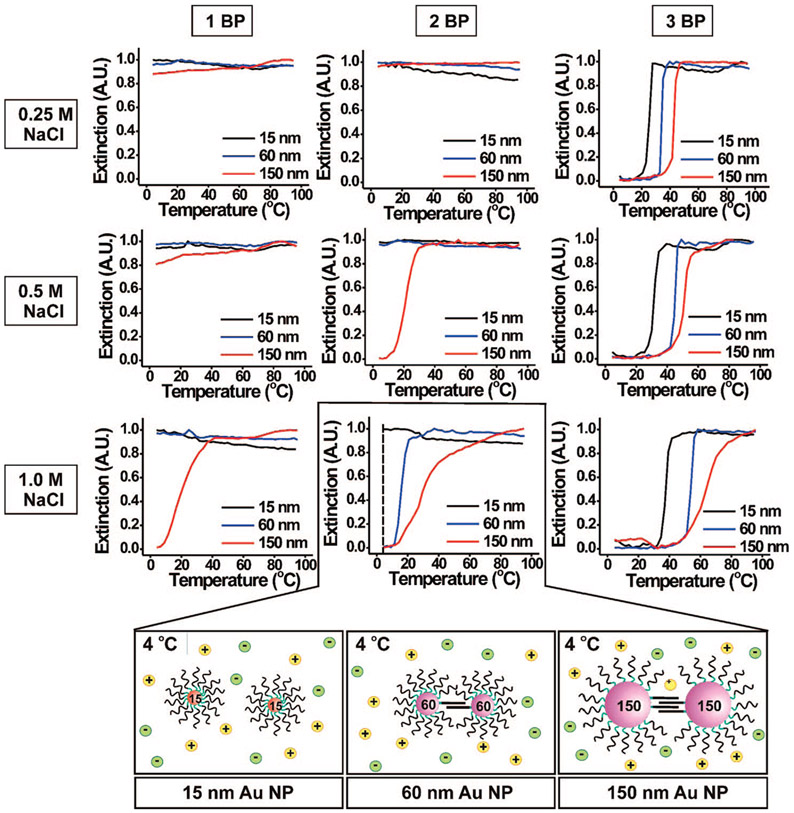
As nanoparticle size increases, more DNA duplex linkages can form between aggregate structures (Scheme 2) due to the increased nanoparticle surface area and accordingly their increased contact area within the aggregate. As a result, we expect to observe higher Tm’s for larger particles when compared to a system of smaller particles with the same oligonucleotide sequence at the same salt concentration. Indeed, we have used this qualitative observation to develop a protocol aimed at separating polyvalent 15 nm particle conjugates from 80 nm structures.19 Here, we quantitatively analyze the effect of nanoparticle conjugate size on aggregate stability at low numbers of base pairings per strand (1–3 BP). We replotted the melting transitions in Figure 4, focusing on their dependence on particle size (Figure 5). For a given salt concentration and oligonucleotide sequence, the Tm’s of the DNA–Au NP aggregates clearly increase with increasing nanoparticle size (Figure 5, Supporting Information, Figures S6 and S7). As nanoparticle size increases, aggregate formation/melting behavior generally is observed at lower salt concentrations and with oligonucleotides of a smaller number of possible base pairings per strand (Figure 5). For example, in the case of 2 BP per strand, 60 and 150 nm DNA–Au NPs form aggregates at 1.0 M NaCl (Figure 5, bottom middle plot). Moving up the middle column, only aggregates comprised of 150 nm DNA–Au NPs form at 0.5 M NaCl. For particles with this sequence, no hybridization takes place at 0.25 M regardless of size (15–150 nm).
Figure 5.
Normalized melting curves (monitored at 260 nm) for 1, 2, or 3 BP at 0.25, 0.5, and 1.0 M NaCl. Each graph shows the effect of changing nanoparticle size (15, 60, and 150 nm) on the melting transition. For instance, at 4 °C, 60 and 150 nm DNA–Au NPs (functionalized with 2 BP) are both hybridized in 1.0 M NaCl, but 15 nm DNA–Au NPs under the same conditions are not hybridized (bottom graphics).
We also note that, for a given salt concentration and oligonucleotide sequence, as nanoparticle size increases, the difference in the Tm between each subsequent size decreases (i.e., 9.1 °C between 15 and 30 nm nanoparticles to 5.1 °C between 80 and 150 nm nanoparticles) (Table 2). We believe this trend can be attributed to the decrease in DNA surface coverage/density as the nanoparticles get larger.15,28 By the time the nanoparticles reach 150 nm in diameter, the density of DNA on the surface of the nanoparticle decreases and approaches that of a flat Au surface.29 Similar trends were observed for all salt concentrations and DNA sequences investigated here.
Table 2.
Melting Temperatures for 15, 30, 60, 80, and 150 nm DNA–Au NP Aggregates at 1.0 M NaCl for 3 BPa
| Tm (°C) 3 BP | ||
|---|---|---|
| 1.0 M | ΔTm (°C) | |
| 15 nm | 37.7 | – |
| 30 nm | 46.8 | 9.1 |
| 60 nm | 54.1 | 7.3 |
| 80 nm | 58.7 | 4.6 |
| 150 nm | 63.8 | 5.1 |
The rightmost column lists the difference in Tm between neighboring particle sizes.
Effect of the Number of Base Pairs.
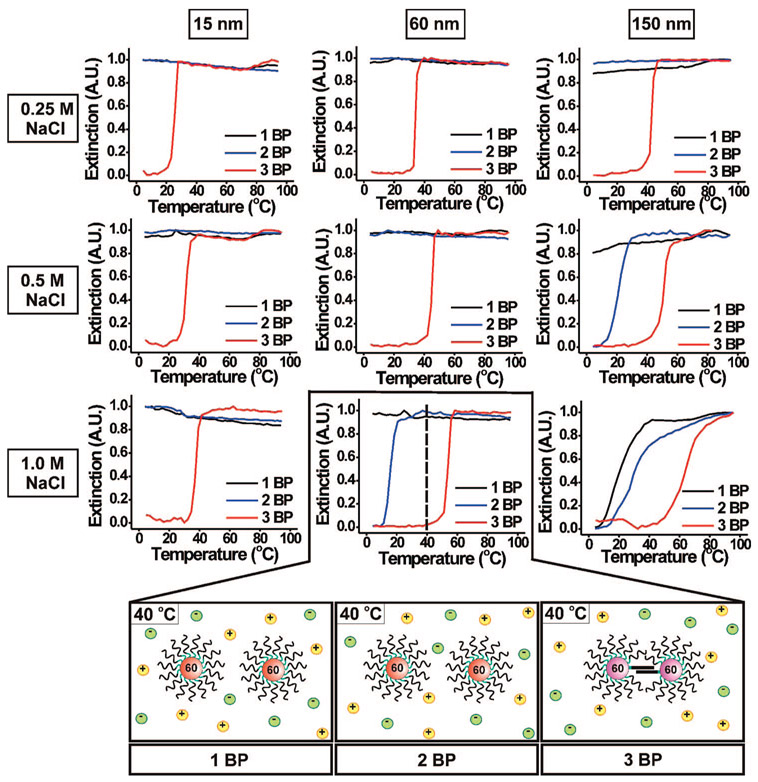
An additional hypothesis pertains to the relationship between the possible number of base pairs per DNA strand and aggregate stability. Typically, longer DNA duplexes or those with more G–C pairs have higher Tm’s than shorter sequences or those with more A–T pairs.27 So similarly, for the nanoparticle system, we hypothesized that as the number of possible G–C base pairings per strand in the overlap region increases (from 1 to 3 BP), the Tm of the aggregate will increase. We again examined the same melting transitions as shown in Figures 4 and 5 but instead plotted the data so the salt concentration and nanoparticle size are constant while the oligonucleotide sequence is varied (Figure 6). As the number of base pairings per strand increases, the Tm of the DNA–Au NP aggregates increases for a given salt concentration and nanoparticle size (Figure 6, Supporting Information, Figures S6 and S7). Also, aggregate formation/melting behavior generally is observed at lower salt concentrations and with smaller nanoparticles. For instance, 60 nm DNA–Au NPs functionalized with 2 BP form stable aggregates at 1.0 M NaCl (Figure 6, bottom middle plot). At lower salt concentrations, only 60 nm DNA–Au NPs functionalized with 3 BP form stable aggregates (Figure 6, middle column).
Figure 6.
Normalized melting curves (monitored at 260 nm) for 15, 60, and 150 nm DNA–Au NP aggregates at 0.25, 0.5, and 1.0 M NaCl. Each graph shows the effect of changing the number of base pairings (1, 2, or 3 BP) on the melting transition. In the case of the 60 nm DNA–Au NPs, at 40 °C in 1.0 M NaCl, those functionalized with 3 BP form aggregates, while those functionalized with 1 BP and 2 BP do not (bottom graphics).
For a given nanoparticle size and salt concentration, the Tm increases significantly with the addition of each base pairing (i.e., 15.6 °C (2 BP) to 54.1 °C (3 BP) for 60 nm DNA–Au NPs at 1.0 M NaCl). This increase in Tm for each additional base pairing per strand is larger than that for the total increase in Tm over the entire range of salt concentrations or nanoparticle sizes studied (Tables 1 and 3). This enhancement is so striking because, with small numbers of base pairs, each additional base pair dramatically increases the total number of hydrogen bonds per DNA connection. For example, by adding one additional potential base pair to 2 BP (resulting in 3 BP), the total number of hydrogen bonds per connection jumps from 6 to 9, an increase of 50%. If we add one potential G–C base pair to a 15-mer DNA sequence (resulting in a 16-mer DNA sequence), we again only increase the total number of potential hydrogen bonds per connection by 3. However, the percent increase in the number of hydrogen bonds per connection in the duplex is only 9% (15 mer, 33 hydrogen bonds/connection; 16 mer, 36 hydrogen bonds per connection (Supporting Information, Figure S8)). The ΔTm between 2 BP and 3 BP is 38.5 °C, while that between the 15-mer and 16-mer is only 2.6 °C. As the number of base pairings in the overlap region increases, the increase in stability (increase in Tm) gained from each additional base pair will get progressively smaller.
Table 3.
Melting Temperatures for 15, 30, 60, 80, and 150 nm DNA–Au NP Aggregates at 1.0 M NaCl for 2 BP and 3 BPa
| Tm (°C) 1.0 M | |||
|---|---|---|---|
| 2 BP | 3 BP | ΔTm (°C) | |
| 15 nm | – | 37.7 | – |
| 30 nm | – | 46.8 | – |
| 60 nm | 15.6 | 54.1 | 38.5 |
| 80 nm | 22.6 | 58.7 | 36.1 |
| 150 nm | 28.2 | 63.8 | 35.6 |
The rightmost column lists the difference in Tm between the different numbers of base pairings for each particle size.
The data presented in Tables 1, 2, and 3 allow us to compare and contrast the relative effects of salt concentration, nanoparticle size, and the number of base pairings per DNA strand on the melting transitions of DNA–Au NP aggregates. In examining the tables, we find that the Tm of the nanoparticle aggregates is most influenced by the number of base pairings, followed by the salt concentration, and then nanoparticle size. This type of knowledge about DNA–Au NP melting behavior will be useful when designing experiments that employ DNA–Au NPs, especially those larger than 60 nm, as probes, building blocks, or nanotherapeutic agents. This information can be used to minimize the instances of self-hybridization and drive the DNA–Au NP aggregate to the fully complementary interaction.
Confirmation Using a PEG Spacer.
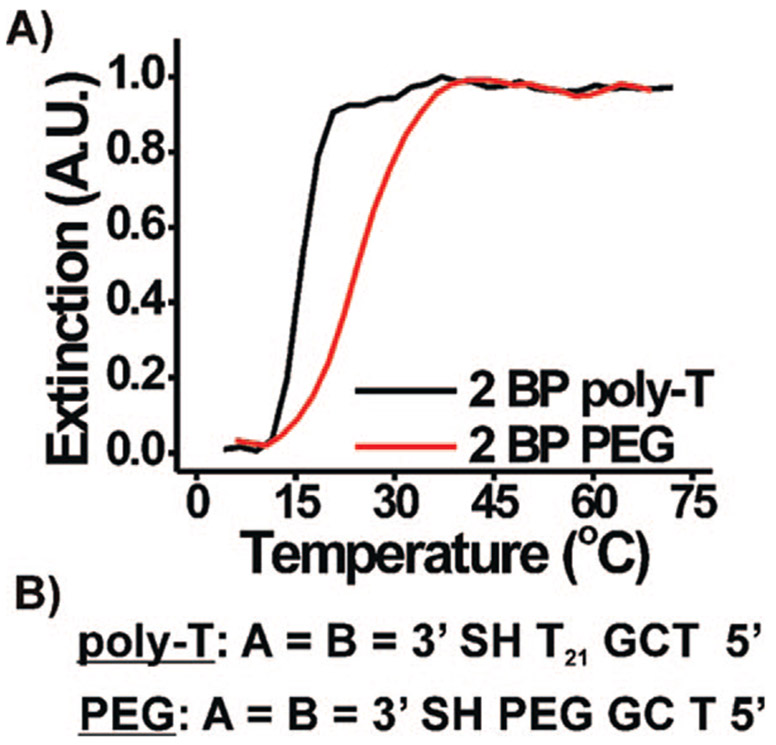
As a final confirmation that these melting transitions are base pair mediated, we designed a DNA sequence with a PEG spacer (3′ SH [PO3(OCH2CH2)3]12 GC T 5′), comparable in length to the poly-T spacer sequences we have been using (Figure 7). A sharp melting transition was observed for aggregates of 60 nm DNA–Au NPs functionalized with this PEG sequence. Because the PEG moiety is not capable of base pairing interactions, we conclude that the aggregates are stabilized by only the two possible base pairs per strand in the overlap region. The Tm of the PEG sequence was actually higher than that of the same sequence with the poly-T spacer (T10, Tm = 15.6 °C; PEG, Tm = 24.4 °C, 60 nm DNA–Au NPs). We attribute this difference to the increased loading of the PEG–DNA (~1600 strands, PEG vs ~900 strands, poly-T) on the same size nanoparticle.15 This increase in melting temperature then can be attributed in part to the greater number of DNA connections linking these particles, in the same way that the melting temperature increases for nanoparticles of increasing size.19 In fact, if we dilute the DNA sequences on the 60 nm particles with a diluent strand (i.e., 3′ SH T24 5′, the control sequence), we see a gradual decrease in the Tm of the nanoparticle aggregate system (Supporting Information, Figure S9). Eventually, if the relative concentration of the diluent strand on the nanoparticle surface is increased enough (~90% of the complementary strand), the density of complementary DNA on the particle is decreased such that the DNA–Au NPs no longer exhibit hybridization/melting behavior.
Figure 7.
(A) Normalized melting curves (monitored at 260 nm) for 60 nm DNA–Au NPs aggregates at 1.0 M NaCl for the two DNA sequences shown in (B).
Conclusion
This study has explored in detail the relationship between the size of a DNA–Au NP and the cooperative melting transition of DNA–Au NP aggregates formed from such structures. We have determined the minimum number of base pairings necessary to effect aggregate formation based on the size of the nanoparticle over a range of salt concentrations. Significantly, we find that a single G–C base pairing per DNA connection is capable of stabilizing aggregates of 150 nm DNA–Au NPs. We propose that the three-dimensional DNA hybridization at the nanoparticle surface makes these transitions, involving small numbers of base pairings, possible. Finally, these studies have given us the opportunity to compare the relative stability of duplex DNA in the context of the free and nanoparticle bound systems. We estimate that between 4–8, 6–19, or 8–33 additional DNA bases (depending on G–C content) must be added to the free DNA duplex to achieve melting temperatures equivalent to those of aggregates comprised of 15, 60, or 150 nm DNA–Au NPs (functionalized with 3 BP), respectively. Indeed, an interesting issue pertains to how the equilibrium binding constant of a DNA nanoparticle conjugate for a complementary particle conjugate compares to the equilibrium binding constant for the same strands free in solution. On the basis of modeling data (Supporting Information),12,30 we estimate that the equilibrium binding constant (Keq) for 15 nm DNA–Au NPs functionalized with complementary 3 base DNA is ~3 orders of magnitude higher than the Keq for the same DNA strands free in solution [Keqfree = 7 × 101, Keq15nm = 1 × 10⁴ (298 K, 1.0 M NaCl)]. Last, Keq significantly increases with increasing nanoparticle size. Indeed, we calculate at 298 K and 0.25 M NaCl concentration with 3 BP DNAs that Keq increases from 2 × 100 for 15 nm DNA–Au NPs to 2 × 10⁶ and 9 × 10⁸ for 60 and 150 nm DNA–Au NPs, respectively.
Supplementary Material
Acknowledgment.
We acknowledge Prof. George C. Schatz for helpful discussions. C.A.M. acknowledges the NSF-NSEC, the AFOSR, and the NCI CCNE. He also is grateful for a NIH Director’s Pioneer Award. H.D.H. acknowledges the U.S. Department of Homeland Security (DHS) for a Graduate Fellowship under the DHS Scholarship and Fellowship Program.
Footnotes
Supporting Information Available: Supplemental figures as referenced in the text and details concerning the thermodynamic calculations. This material is available free of charge via the Internet at http://pubs.acs.org.
References
- (1).Mirkin CA; Letsinger RL; Mucic RC; Storhoff JJ Nature 1996, 382, 607–609. [DOI] [PubMed] [Google Scholar]
- (2).Rosi NL; Giljohann DA; Thaxton CS; Lytton-Jean AKR; Han MS; Mirkin CA Science 2006, 312, 1027–1030. [DOI] [PubMed] [Google Scholar]
- (3).Seferos DS; Giljohann DA; Rosi NL; Mirkin CA ChemBioChem 2007, 8, 1230–1232. [DOI] [PubMed] [Google Scholar]
- (4).Seferos DS; Giljohann DA; Hill HD; Prigodich AE; Mirkin CA J. Am. Chem. Soc 2007, 129, 15477–15479. [DOI] [PMC free article] [PubMed] [Google Scholar]
- (5).Alivisatos AP; Johnsson KP; Peng X; Wilson TE; Loweth CJ; Bruchez MP; Schultz PG Nature 1996, 382, 609–611. [DOI] [PubMed] [Google Scholar]
- (6).Alvarez MM; Khoury JT; Schaaff TG; Shafigullin MN; Vezmar I; Whetten RL J. Phys. Chem. B 1997, 101, 3706–3712. [Google Scholar]
- (7).Storhoff JJ; Elghanian R; Mucic RC; Mirkin CA; Letsinger RL J. Am. Chem. Soc 1998, 120, 1959–1964. [Google Scholar]
- (8).Elghanian R; Storhoff JJ; Mucic RC; Letsinger RL; Mirkin CA Science 1997, 277, 1078–1081. [DOI] [PubMed] [Google Scholar]
- (9).Reynolds RAI; Mirkin CA; Letsinger RL J. Am. Chem. Soc 2000, 122, 3795–3796. [Google Scholar]
- (10).Taton TA; Mirkin CA; Letsinger RL Science 2000, 289, 1757–1760. [DOI] [PubMed] [Google Scholar]
- (11).Lytton-Jean AKR; Mirkin CA J. Am. Chem. Soc 2005, 127, 12754–12755. [DOI] [PubMed] [Google Scholar]
- (12).Jin R; Wu G; Mirkin CA; Schatz GC J. Am. Chem. Soc 2003, 125, 1643–1654. [DOI] [PubMed] [Google Scholar]
- (13).Long H; Kudlay A; Schatz GC J. Phys. Chem. B 2006, 110, 2918–2926. [DOI] [PubMed] [Google Scholar]
- (14).Park SY; Gibbs-Davis JM; Nguyen ST; Schatz GC J. Phys. Chem. B 2007, 111, 8785–8791. [DOI] [PubMed] [Google Scholar]
- (15).Hurst SJ; Lytton-Jean AKR; Mirkin CA Anal. Chem 2006, 78, 8313–8318. [DOI] [PMC free article] [PubMed] [Google Scholar]
- (16).Nam J-M; Thaxton CS; Mirkin CA Science 2003, 301, 1884–1886. [DOI] [PubMed] [Google Scholar]
- (17).Nam J-M; Stoeva SI; Mirkin CA J. Am. Chem. Soc 2004, 126, 5932–5933. [DOI] [PubMed] [Google Scholar]
- (18).Rosi NL; Mirkin CA Chem. Rev. 2005, 105, 1547–1562. [DOI] [PubMed] [Google Scholar]
- (19).Lee J-S; Stoeva SI; Mirkin CA J. Am. Chem. Soc 2006, 128, 8899–8903. [DOI] [PubMed] [Google Scholar]
- (20).Mammen M; Choi S-K; Whitesides GM Angew. Chem., Int. Ed 1998, 37, 2754–2794. [DOI] [PubMed] [Google Scholar]
- (21).Kiessling LL; Gestwicki JE; Strong LE Curr. Opin. Chem. Biol 2000, 4, 696–703. [DOI] [PubMed] [Google Scholar]
- (22).Saenger W Principles of Nucleic Acid Structure; Springer-Verlag: New York, NY, 1984. [Google Scholar]
- (23).Stryer L Biochemistry; W. H. Freeman and Co.: New York, NY, 1995. [Google Scholar]
- (24).Li Z; Mirkin CA J. Am. Chem. Soc 2005, 127, 1170–1178. [DOI] [PubMed] [Google Scholar]
- (25).Wu Z-S; Guo M-M; Shen G-L; Yu R-Q Anal. Bioanal. Chem 2007, 387, 2623–2626. [DOI] [PubMed] [Google Scholar]
- (26).Clint JH Surfactant Aggregation; Chapman and Hall: New York, NY, 1992. [Google Scholar]
- (27).Bloomfield VA; Crothers DM; Tinoco I Jr. Nucleic Acids: Structures, Properties, and Functions; University Science Books: Sausalito, CA, 2000. [Google Scholar]
- (28).Deleted in proof. [Google Scholar]
- (29).Demers LM; Mirkin CA; Mucic RC; Reynolds RA III; Letsinger RL; Elghanian R; Viswanadham G Anal. Chem 2000, 72, 5535–5541. [DOI] [PubMed] [Google Scholar]
- (30).Sugimoto N; Nakano S; Yoneyama M; Honda K Nucleic Acids Res. 1996, 24, 4501–4505. [DOI] [PMC free article] [PubMed] [Google Scholar]
Associated Data
This section collects any data citations, data availability statements, or supplementary materials included in this article.


