

Abstract
Background
Oral mucositis (OM) is a debilitating sequela for patients treated for squamous cell carcinoma of the head and neck (HNSCC). We investigated whether oral microbial features prior to treatment, or during treatment, are associated with time to onset of severe OM in patients with HNSCC.
Methods
Cohort study of newly diagnosed patients with loco-regional HNSCC, who received chemo+/− radiotherapy from April 2016 to September 2017.OM was based on NCI Common Terminology Criteria for Adverse Events Version 4.0. Oral microbiome was characterized based on 16S rRNA V4 region using the Illumina platform. Mixture cure model was used to generate Hazard Ratios (HRs) for onset of severe OM.
Results:
Eighty six percent of the patients developed OM (n=57; non-severe=33; severe=24) with a median time to onset of OM at 21 days. Adjusting for age, gender and smoking status, we found that genera abundance was associated with hazard for onset of severe OM as follows: 1) At baseline (n=66), Cardiobacterium (P value = 0.03) and Granulicatella (P value = 0.04); 2) Immediately prior to the development of OM (n = 57), Prevotella (P value = 0.03), Fusobacterium (P value = 0.03), Streptococcus (P value = 0.01); and 3) Immediately prior to the development of severe OM (n=24), Megasphaera (P value = 0.0001) and Cardiobacterium (P value = 0.03). There were no differences in α-diversity between our baseline samples and the Human Microbiome Project data.
Conclusions
Changes in the abundance of the genera over the course of treatment were associated with onset of severe OM. The mechanism and therapeutic implications of these findings need to be investigated in future studies.
Keywords: oral mucositis, oral microbiome, squamous cell carcinoma of the head and neck, time at onset of severe oral mucositis, mixture cure model
Precis:
Oral mucositis is a debilitating sequela for patients treated for squamous cell carcinoma of the head and neck. Specific genera may be targeted for probiotic or antibiotic therapy for the prevention and treatment of OM.
Introduction
Oral mucositis (OM), the inflammation and/or ulceration of the oral mucosa produced by chemotherapeutic agents or radiation, is a complication experienced by as many as 66% of patients being treated for squamous cell carcinoma of the head and neck (HNSCC).1–3 HNSCC patients present to the emergency department (ED) with OM-related complaints including pain, dehydration, fatigue, weight loss, nausea, and vomiting as early as 7 days to 3 weeks from the start of cancer treatment. OM interferes with oral intake and can lead to a reduction in treatment dose, unplanned hospitalizations thereby increasing cost of care, breaks in treatment regimen,1,4,5 reduced quality of life and impact on overall survival. Subsequent ED visits for OM-related complaints are common, persisting as a chief complaint for 15%–23% of patients across ED visits.6 Standard treatment for OM focuses on pain control, rehydration, and oral hygiene. Although treatment and prevention strategies are evolving (including Phase II multicenter trials),7 the therapeutic benefit is limited.8
In the current model of alimentary-tract mucositis, cancer therapy induces production of reactive oxygen species that in turn incite an inflammatory response through activation of nuclear-factor kappa B and amplification of tumor necrosis factor-α, which results in disruption of the epithelial cell barrier and translocation of colonizing bacteria. 9 The microbiome plays a passive role in this model. However, the last several years have seen a dramatic shift in the understanding of epithelial cell–microbiota interaction, as the commensal microflora are now known to be critical to epithelial cell health and to local and systemic immune function. 10–12 Recent technological advances have allowed researchers to investigate host-microbial interactions and evaluate the role of the microbiome in human health and disease. 13,14 Cancer therapy-induced myelosuppression is followed by microbial dysbiosis (microbial imbalance). Shifts in the oral microbiome can affect innate immune response, a known stimulator of the mucositis pathway. 15
Therefore, shifts in oral microbial composition could potentially affect the trajectory of OM by playing a critical role in its development and the duration of existing ulcerations. Several studies of the microbiome during cancer treatment have shown that the microbiome changes significantly during cancer therapy—e.g. via a shift to pathogenic species or reduction in oral microbial diversity, suggesting that loss of specific commensal flora essential for the health of the oral epithelium may also be important to OM pathophysiology. 16–18
The human microbiota encompasses 10 –100 trillion symbiotic microbes that live in and on the human body; they outnumber somatic and germ cells by an estimated 10-fold.19 Advances in high-throughput technologies (e.g., 16S rRNA technology) have made it possible to characterize the human microbiome more completely and to better understand how the composition and diversity of the endogenous flora of the human body are associated with health.20, 21 Studies suggest that the health of the mucosal epithelium—a critical aspect of OM—is directly and consistently affected by its interaction with commensal microflora in the mouth, pharynx, and their contiguous extensions, such as the esophagus (together, the oral microbiome).22,23 To date, however, no studies have evaluated dense (weekly) temporal changes in the oral microbiome in HNSCC patients over the course of treatment and correlated these findings with OM. Given that OM is associated with long term oral morbidities (i.e., dysphagia, dysphonia, alterations in taste, poor dental health 24,25 and mandibular osteoradionecrosis 26) and may compromise oncologic outcomes 27–29, understanding the role of the oral microbiome in the development of OM may lead to targeted therapy for its prevention and treatment (such as with probiotic or antibiotic regimen). In this study, we investigated whether oral microbial features (e.g., diversity, abundance) prior to treatment, or changes in oral microbial features during treatment are associated with the time to onset of severe OM in patients with HNSCC.
Patients and Methods
Patients.
The analysis included 66 newly diagnosed patients (> 18 years of age) with loco-regional HNSCC, who received cancer treatment, including chemotherapy, radiation or combined therapy of chemotherapy and radiation, at MD Anderson Cancer Center (MDACC) from April 2016 to September 2017. All participants signed an informed consent form prior to enrollment that permitted us to collect buccal mucosa samples, as well as demographic and clinical information. The study protocol (PA15-1113 Temporal Changes in Oral Microbial Composition in Head and Neck Cancer Patients at High Risk for Oral Mucositis) was approved by the Institutional Review Board of MDACC in accordance with HIPAA and tenets of the Declaration of Helsinki.
OM in a patient was defined according to clinician rating based on NCI-CTC Grading Scale (Common Terminology Criteria for Adverse Events Version 4.0). The NCI-CTC v. 4 captures clinician-reported ratings of OM: 1 = asymptomatic or mild symptoms, intervention not indicated; 2 = Moderate pain; not interfering with oral intake, modified diet indicated; 3 = severe pain, interfering with oral intake; 4 = life threatening consequences, urgent intervention indicated; and 5 = death. The primary outcome of interest in this study is the time to onset of severe OM (≥ grade 3), which is defined as the number of days from cancer treatment (chemotherapy, radiation or combined therapy of chemotherapy and radiation) to the date of development of severe OM or the date of last follow-up (censored observation).
Specimen Collection and Process, and 16S rRNA Sequencing.
Buccal mucosa samples were collected using Catch-All ™ Sample Collection swabs. Samples were collected prior to cancer treatment, during cancer treatment, and at the end of cancer treatment. Bacterial genomic DNA was extracted from patient samples using MoBIO PowerSoil DNA Isolation Kit (MO BIO Laboratories). The 16S rRNA V4 region was amplified by PCR and sequenced in the Illumina MiSeq platform using the 2×250 bp paired-end protocol yielding pair-end reads that overlap almost completely, adapted from the methods developed for the NIH-Human Microbiome Project.30,31 The read pairs were demultiplexed on the basis of the unique molecular barcodes and merged using USEARCH.32 16S rRNA gene sequences were clustered into Operational Taxonomic Units (OTUs) at a similarity cutoff value of 97% using the UPARSE algorithm,33 which were mapped to an optimized version of the SILVA Database.34 An OTU table was constructed from the output files generated in the previous two steps for downstream analyses. Assessment and visualization of microbiome communities were conducted using package “phyloseq”35 in R software program (R Core Team 2017, version 3.3.2) to import data, normalize and filter data, calculate diversities, and establish microbiome community profiles.
Statistical Analyses.
Statistical analyses were conducted using R software (R Core Team 2017). The OTU matrices were normalized by rarefying number 4524 such that all samples have the same number of total read counts, 36,37 which was decided based on the rarefaction curves.38 Microbial α-diversity was calculated using the Shannon Diversity Index.39 For the association study of genera and time-to onset of severe OM, we focused on 37 most prevalent genera with relative abundance > 0.1% in at least 10% of all samples.40
It is important to note that some patients may never develop severe OM. Therefore, the standard models for time-to-onset variable analysis (e.g., Cox proportional hazards model) are not appropriate for our data analyses because these models assume that all patients in the s6tudy population will experience the event of interest if longitudinally followed.41 Therefore, in this study, we considered a special type of survival model, called the mixture cure model,41–43 to associate the microbiome features (i.e., α-diversity and genera abundance) and the primary outcome, time-to-onset of severe OM, accounting for the susceptible patients who may develop severe OM as well as the non-susceptible patients who will never develop severe OM. Specifically, we employed a semiparametric mixture cure model,41 that separately models the proportion of patients who will never develop severe OM (logit link function) and the survival distribution of those who may develop severe OM (proportional hazards model). The parameters of interest are evaluated based on the likelihood function using the expectation-maximization algorithm, and the standard errors of estimated parameters are calculated using Jackknife resampling.41 Hazard ratios (HRs) and corresponding P values were reported for the patients’ population who may develop severe OM (i.e., non-cure population). As in the standard analysis for time-to-onset models, HR > 1 means higher hazard rate with one unit increase in α-diversity or genera abundance (individuals with higher α-diversity or genera abundance have an increased hazard for early onset of severe OM); while HR value < 1 means lower hazard rate with one unit increase in α-diversity or genera abundance (individuals with higher α-diversity or genera abundance have a decreased hazard for early onset of severe OM). The mixture cure model for the association test was conducted using the R package “smcure.”41
For the association study of time to onset of severe OM, we considered α-diversity and genera abundance proportions using different sets of samples: (1) samples collected prior to treatment (baseline); (2) samples collected immediately prior to the development of OM of any grade; and (3) samples collected immediately prior to the development of severe OM. All the association tests were adjusted for the patients’ age, gender and smoking status.
We also investigated the association between β-diversity, which measures distance between samples from different time points, and time to onset of severe OM using the commonly used distance measures including Bray-Curtis dissimilarity index, unique fraction (UniFrac) and weighted Unifrac.20,21 In particular, for each patient involved in the analysis, we calculated the aforementioned distance measures between (1) baseline sample and sample collected immediately prior to development of OM of any grade (βOM-baseline) and (2) baseline sample and sample collected immediately prior to development of severe OM (βservere_OM-baseline); and applied the same analysis as described above.
Results
Patient Characteristics.
Patient characteristics, treatment and OM grades are reported in Table 1. Longitudinal data for oral microbiome samples and OM from 66 oral cancer patients were collected (mean age = 59, standard deviation [sd] = 8.25). The majority of patients were male (89.39%) and HPV positive (83.64%). About half of patients were ever-smoker (51.52%). Only 6 patients (9%) reported antibiotic use during the course of their cancer treatment. A majority of the patients received combined chemotherapy and radiation therapy (86.36%). Among 66 patients, 24 patients (36.36%) developed severe OM at the time of analyzing the data. OM significantly varied by HPV (P value = 0.029) and treatment status (P value = 0.004).
Table 1.
Patient characteristics, treatment and oral mucositis (OM) grades.
| Characteristics | Number of patients (%) | P values | |||
|---|---|---|---|---|---|
| All Patients (n=66) | Patients with no OM (n=9) | Patients with non-severe OM (n=33) | Patients with severe OM (n=24) | ||
| Demographic | |||||
| Mean age (sd) | 59 (8.25) | 58 (8.14) | 59 (8.81) | 60 (7.94) | 0.882 |
| Male (%) | 59 (89.39) | 7 (77.78) | 30 (90.91) | 22 (91.67) | 0.477 |
| Ever smoker (%) | 34 (51.52) | 5 (55.56) | 14 (42.42) | 15 (62.5) | 0.340 |
| HPV + (%) | 46 (83.64) | 3 (50.00) | 23 (82.14) | 20 (95.24) | 0.029 |
| Antibiotics Yes (%) | 6 (9.09) | 1 (11.11) | 3 (9.09) | 2 (8.33) | 1.000 |
| Treatment | |||||
| Chemo only (%) | 2 (3.03) | 2 (22.22) | 0 (0.00) | 0 (0.00) | 0.004 |
| Radiation only (%) | 7 (10.61) | 1 (11.11) | 6 (18.18) | 0 (0.00) | |
| Chemo+Rediation (%) | 57 (86.36) | 6 (66.67) | 27 (81.82) | 24 (100.00) | |
P values were assessed using ANOVA for the continuous variable and Fisher’s exact test for the categorical variables.
The median follow-up time is 169 days for the 66 patients. The median time to onset of OM of any grade was 21 days; and to non-severe and severe OM were 21.5 days and 49 days respectively. Swimmer plot shows the length of time to onset of event for each subject, classified by OM stages (No OM, Non-severe OM and Severe OM) in Figure 1. The number of censored subjects is more than the number of the subjects that develop severe OM which supports our strategy of using a cure rate model. Kaplan-Meier plots showing the time to onset of severe OM are given in Figure 2; the flattening of the curve after ~10 weeks in Figures 2 (A) and (B) illustrates the need to apply a cure-rate model, as subjects are no longer at risk for severe OM beyond this time frame.
Figure 1. Swimmer plot showing the length of time to onset of OM for each subject, classified by OM stages (No OM, Non-severe OM and Severe OM).
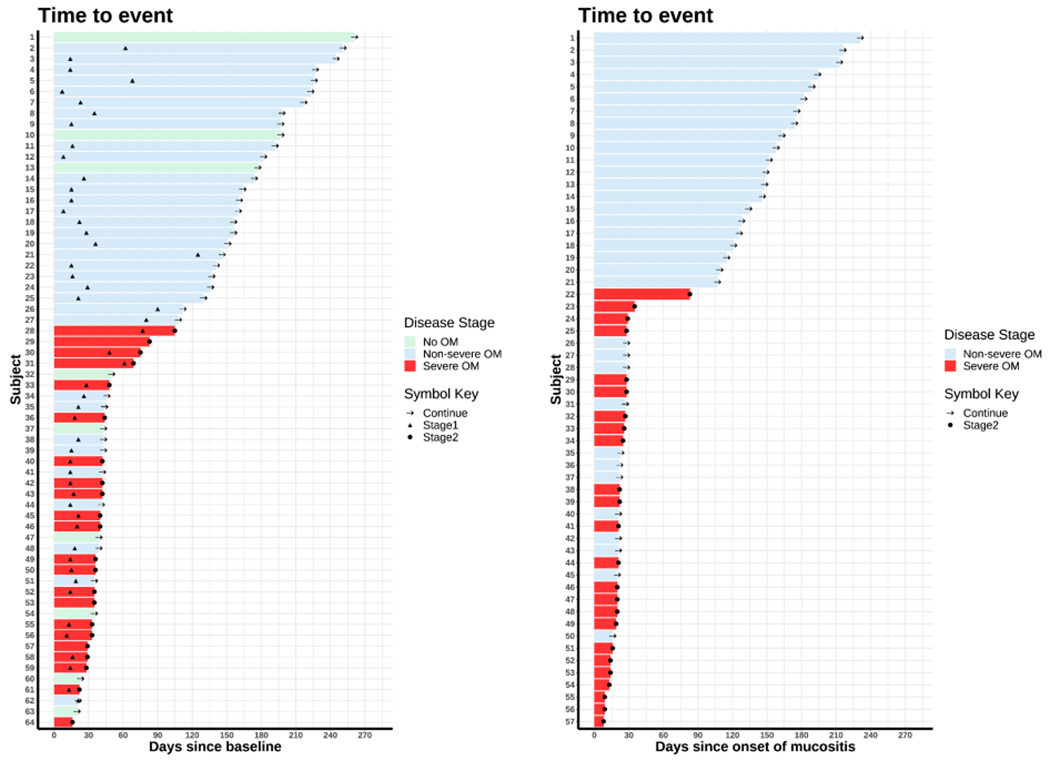
The bars are ordered by the length of time to onset. In both figures, the black “arrow” denotes the censoring time (Continue). The black “triangle” denotes the development of non-serve OM (Stage1). The black “dot” denotes the development of severe OM (Stage2). The left panel includes all subjects with a baseline sample available (n = 64). The bar denotes the time length since the baseline. The right panel includes all subjects that developed OM of any grade (n = 57). The bar denotes the time length since onset of OM of any grade.
Figure 2. Kaplan-Meier (KM) plot of time to onset of severe OM.
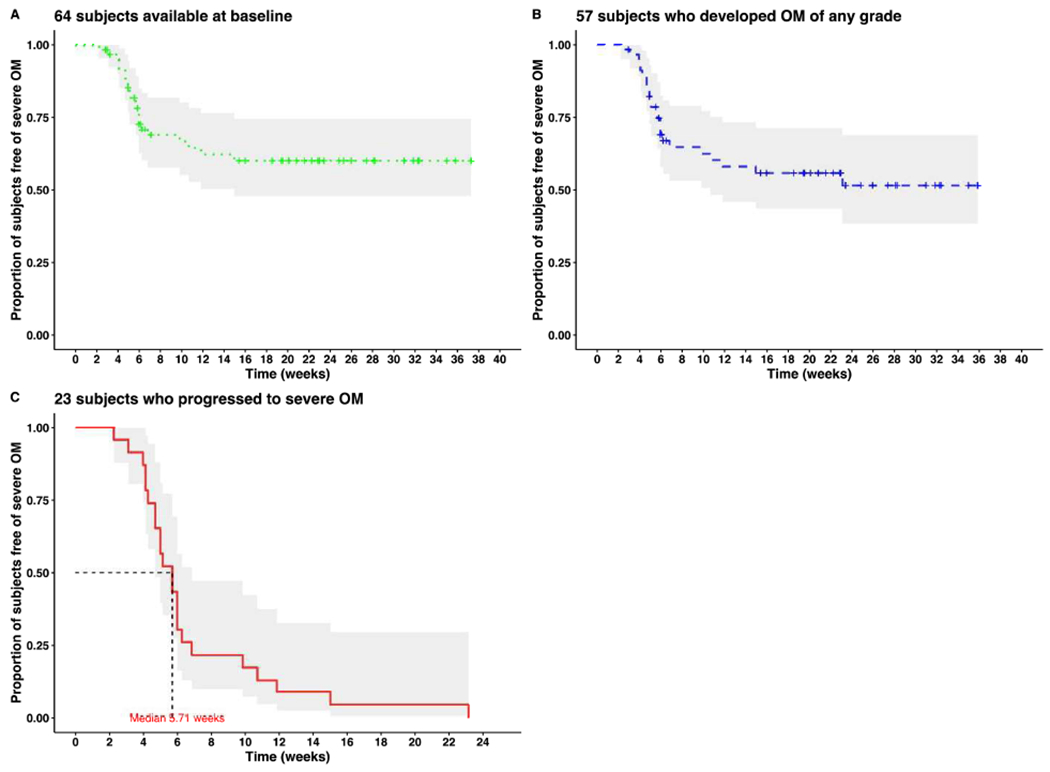
(A) KM plot of time to severe OM for all subjects with a baseline sample available (n = 64)
(B) KM plot of time to severe OM for all subjects that developed OM of any grade (n = 57)
(C) KM plot of time to severe OM for all subjects that developed severe OM (n = 23)
Sample Collection and Baseline Sample Characteristics.
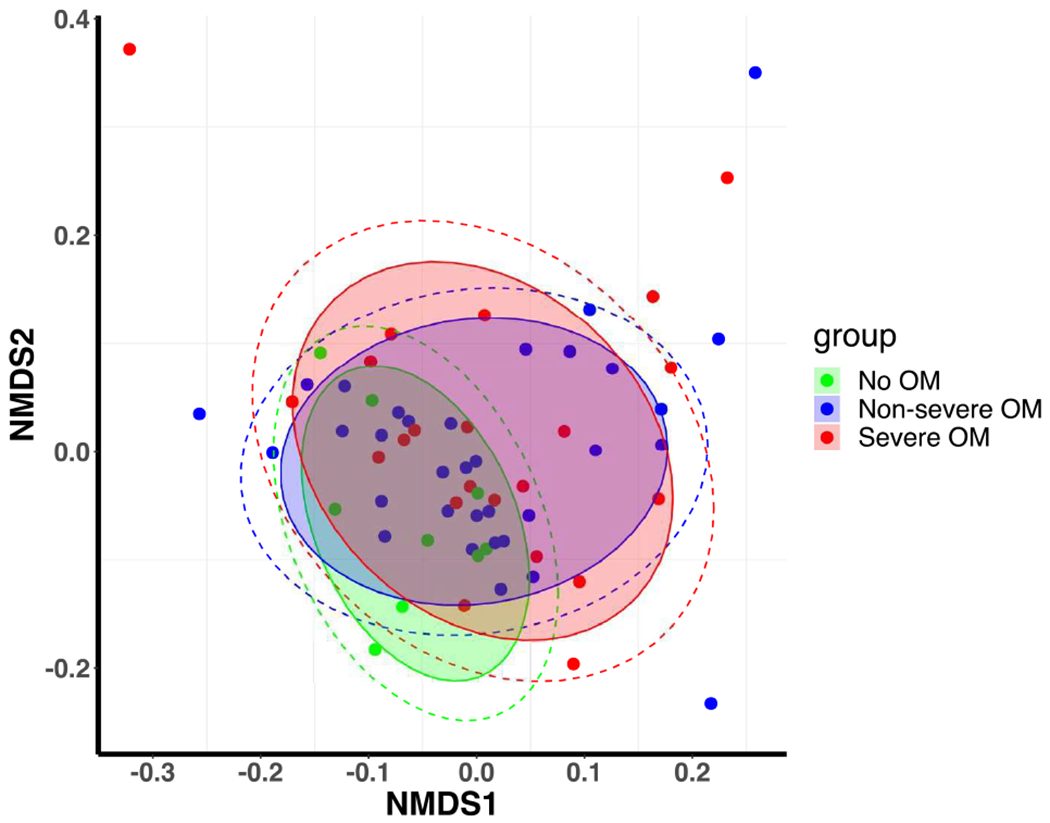
On average, 8 oral samples were collected for each patient. A total number of 9,994,057 high-quality 16S rRNA-encoding reads were sequenced with an average of 16,629 reads per sample. We first assessed the baseline α-diversity for our sample and compared it with the data from the Human Microbiome Project (HMP).30 There were no differences in α-diversity (mean and median) of our baseline samples from HMP data (t-test for equality of mean, P value = 0.1559 and Wilcoxon rank-rum test for equality of medians, P value = 0.4236; Fig. 3A), suggesting that the microbial diversity of our patient population at baseline is similar to healthy adults. Figure 3B shows the ordination of samples using unweighted Unifrac distance, and does not reveal strong global differences across groups in microbiome composition. Figure 3C provides a stacked bar plot illustrating the heterogeneity in terms of genus-level microbiome composition within the set of patients who did not develop OM; who developed non-severe OM; and those who developed severe OM.
Figure 3. Baseline sample characteristics.
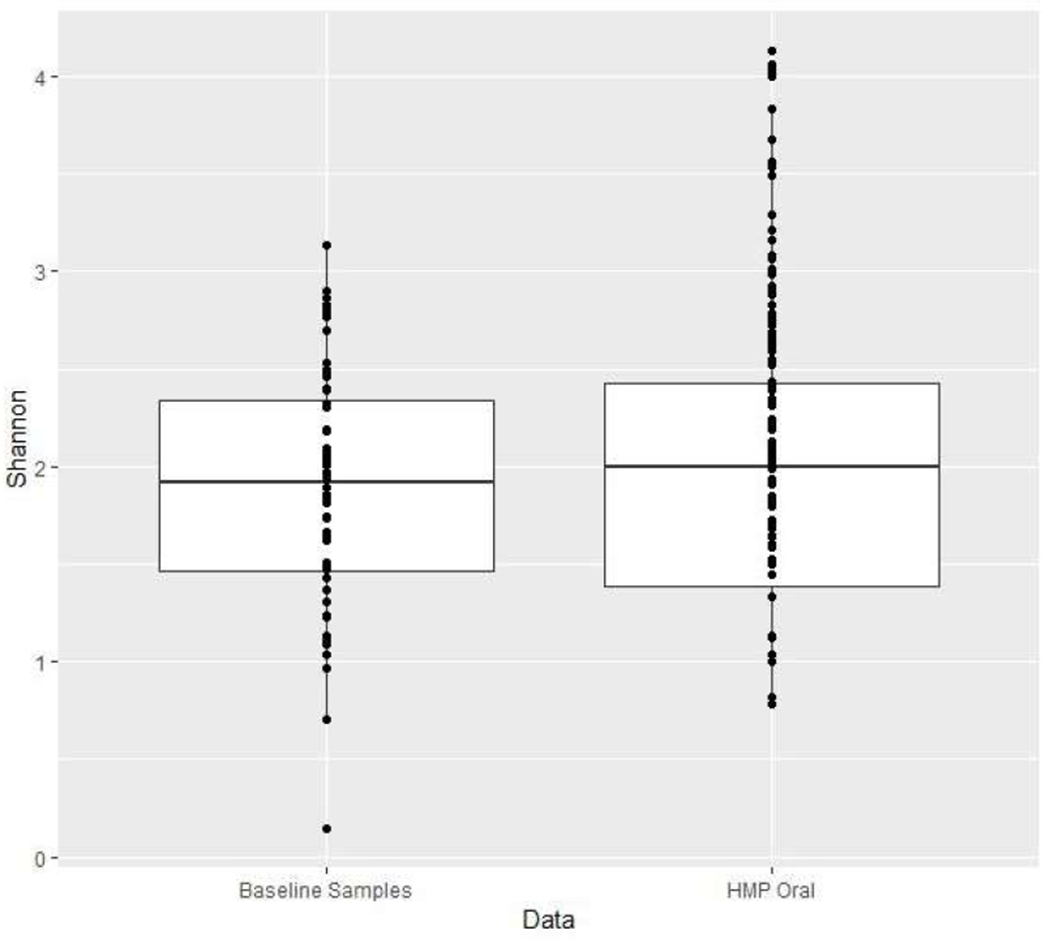
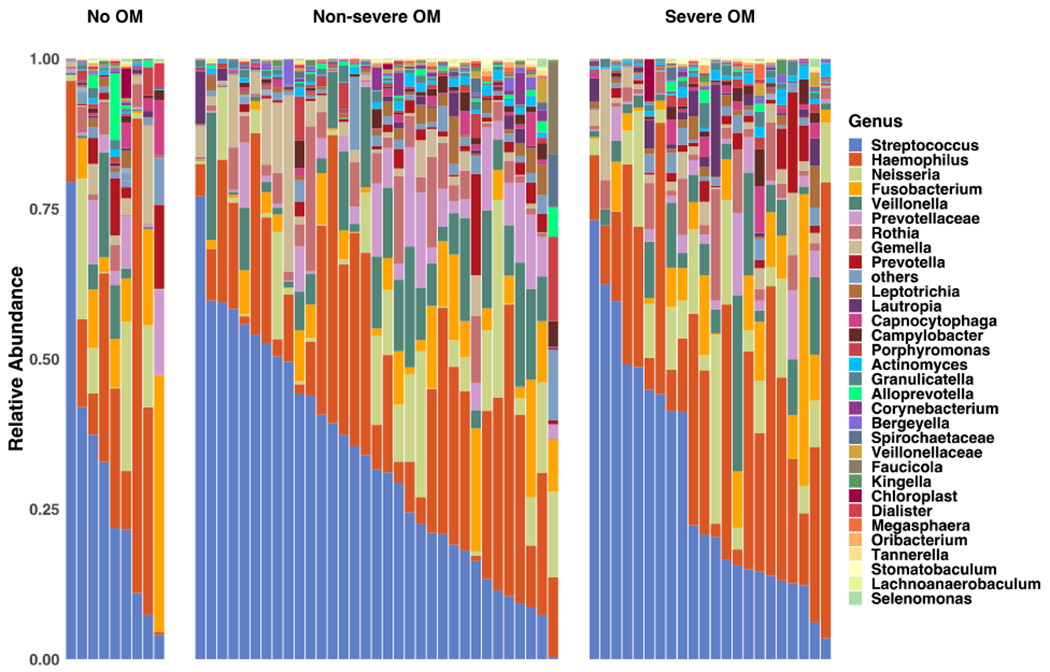
(A) Boxplots of α-diversity as measured by Shannon index in baseline samples from our study, as well as that assessed from data from the Human Microbiome Project (HMP) using buccal swab samples.
(B) Non-metric multi-dimensional scaling (nm-MDS) plot of the baseline samples using unweighted Unifrac distances.
(C) Genera composition of baseline oral samples in patients who did not develop oral mucositis (No OM), those who developed grade 1 or 2 OM (Non-severe OM) and those who developed grade 3 OM (Severe OM).
Association Analysis of Genera Abundance.
The results for the significant association between genera abundance (rarefied counts) and time to onset of severe OM (P value < 0.05) using the mixture cure model are reported in Table 2. All the results for the association tests of α-diversity, measured using Shannon Diversity Index, as well as genera abundance (rarefied counts) were reported in Supplementary Tables S1–S3. For the convenience of interpretation and replicability of the linear coefficients and the corresponding hazard ratios, we divided the rarefied counts by the rarefying count 4524 to obtain the proportional abundance and standardized them with a 1% scale. In other words, the new coefficient will be 4524/100 times larger than the original coefficient. So in the mixture model results, we report the p-values for the genera which showed significant association to the outcome. For genera with higher abundance, we also report hazard ratios, which reflect the increase in the hazard for a 1% increase in the genera abundance. For very low abundance features, which correspond to small counts in the original sample, increases on the percent scale result in very large hazard ratio estimates; for this reason, we only report the p-values, which are invariant to scaling of the predictors.
Table 2. Genera associated with time to onset of severe oral mucositis (OM) at a nominal significance level of 0.05.
HRs represented by “+” were positive associations where reliable coefficient estimates could not be obtained from the cure rate model.
| Coeff | SE | TS | HR | P value | |
|---|---|---|---|---|---|
| Baseline | |||||
| Cardiobacterium | + | + | 0.03 | ||
| Granulicatella | 0.995 | 0.480 | 2.083 | 2.71 | 0.04 |
| Prior to developing OM | |||||
| Streptococcus | −0.045 | 0.018 | −2.461 | 0.96 | 0.01 |
| Prevotella | 0.362 | 0.163 | 2.183 | 1.44 | 0.03 |
| Fusobacterium | 0.104 | 0.050 | 2.113 | 1.11 | 0.03 |
| Prior to developing severe OM | |||||
| Megasphaera | + | + | 0.0001 | ||
| Cardiobacterium | + | + | 0.03 | ||
SE: Standard error; TS: Test statistics; HR: Hazard ratio
Baseline samples and Time to Onset of Severe OM:
When analyzing the baseline samples (prior to treatment), patients with higher genera abundance of Cardiobacterium had a significantly increased hazard for early onset of severe OM (P value = 0.03). The HR for Cardiobacterium could not be reliably estimated using the cure-rate model due to the zero-inflation of the predictor variable (see Figure 4); however, its effect was positive, in that non-zero abundances were associated with increased hazard. Similarly patients with a 1% increase (relative to its original proportion) in genera abundance of Granulicatella had a significantly increased hazard for early onset of severe OM (HR = 2.71; P value = 0.04). The swimmer plot of the abundance of genera associated with time to onset of severe OM for each subject helps us to visualize and verify the findings. As shown in Figure 5 (A) and (B), larger amount of Cardiobacterium and Granulicatella is associated with shorter time to onset of severe OM.
Figure 4.
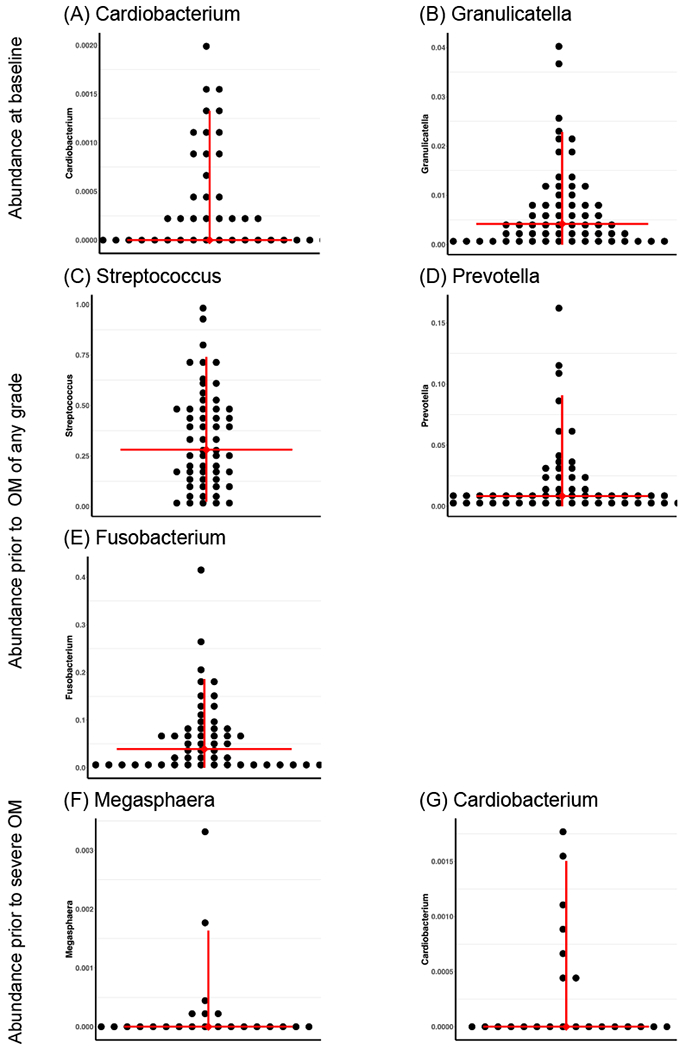
Abundance of genera associated with onset of severe OM.
Figure 5. Swimmer plot shows abundance of genera associated with time to onset of severe OM for each subject.
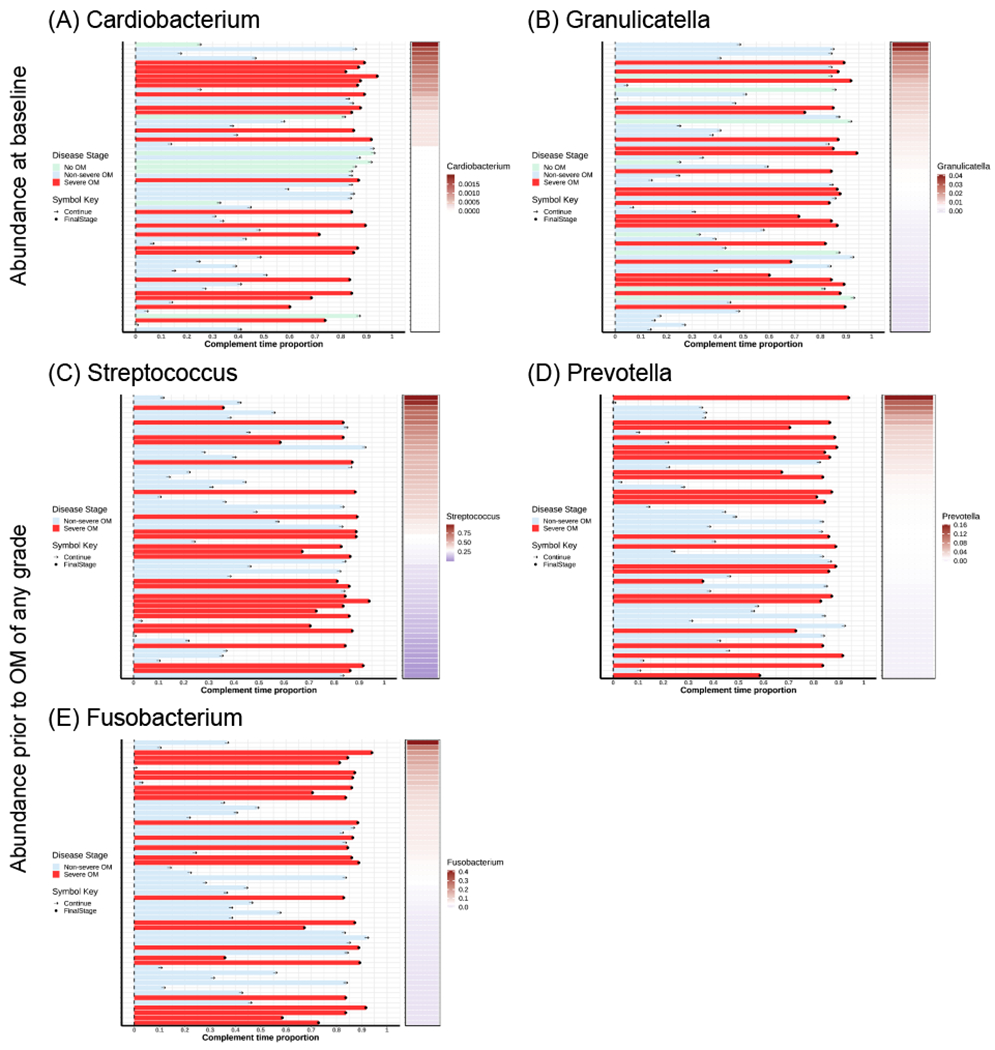
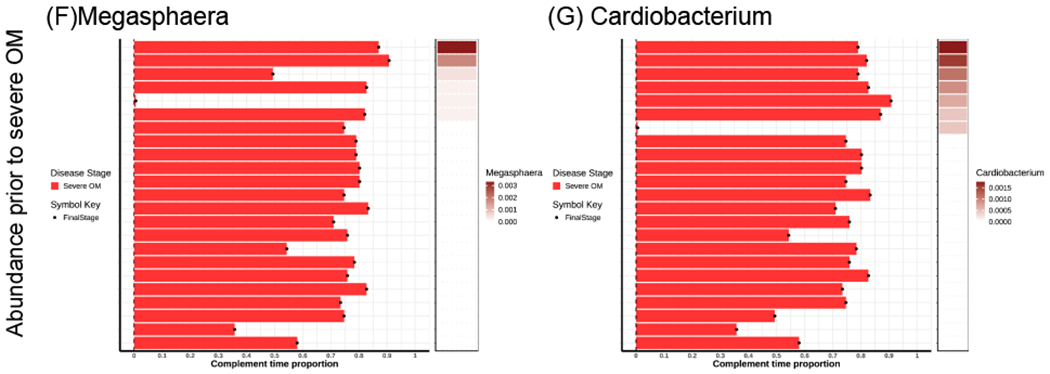
The subjects are ordered by the abundance of genera from the highest to the lowest. All the subjects are classified by OM stages (No OM, Non-severe OM and Severe OM). In each plot, the horizontal bar on the left shows the complement time proportion which is defined as 1- time_to_event/maximal_time. Thus, the longer bar means shorter time to event. The colored bar on the right shows the abundance of genera ordered from the highest to the lowest. The white color describes the median abundance. The black “arrow” denotes the censored time (Continue). The black “dot” denotes the event of severe OM (Stage2).
During treatment samples and Time to Onset of Severe OM:
We analyzed the samples collected immediately prior to the development of OM of any grade and found that patients with a 1% increase in abundance of Streptococcus had a significantly decreased hazard for early onset of severe OM (HR = 0.96; P value = 0.01); while those with a 1% increase in abundance of Prevotella (HR = 1.44; P value = 0.03) and Fusobacterium (HR = 1.11; P value = 0.03) had a significantly increased hazard for early onset of severe OM. As shown in Figure 5 (C), smaller amount of Streptococcus is associated with shorter average time to onset of severe OM. As shown in Figure 5 (D) and (E), larger amount of Prevotella and Fusobacterium is associated with shorter average time to onset of severe OM.
Among those who developed severe OM, we analyzed the samples collected prior to the development of severe OM and found that patients with higher genera abundance of Megasphaera (P value = 0.0001) and Cardiobacterium (P value = 0.03) had a significantly increased hazard for early onset of severe OM. As in the result for Cardiobacterium above, HRs could not be reliably estimated for these genera; however, both were associated with increased hazard. As shown in Figure 5 (F) and (G), larger amount of Megasphaera and Cardiobacterium is associated with shorter average time to onset of severe OM.
Association Analysis of α-diversity and β-diversity.
For any of the analyses described above, α-diversity (i.e., Shannon index) was not statistically significantly associated with the time to severe OM. Also, we did not observe significant association between β-diversity, including βOM-baseline and βsevere_oM-baseline calculated using different distance measures, and time to onset of severe OM (Supplementary Table S4).
Discussion
OM is a debilitating complication experienced by patients with HNSCC. In this longitudinal study, we found that as many as 86% of our patients developed OM despite standard oral preventive and prophylactic care. Based on samples collected at different time (points prior to and during treatment), we identified abundance of the genera that exist as part of the normal oral flora to be associated with time to onset of severe OM including Cardiobacterium, Granulicatella, Streptococcus, Prevotella, Fusobacterium, Cardiobacterium and Megasphaera.
Studies suggest that risk factors such as dose, duration, intensity of treatment1 only explain partial variation observed in the severity and duration of OM3. In our study, body mass index, radiation cumulative dose, duration and intensity were not associated with the time to onset of severe OM. To our knowledge, our study is among the first longitudinal study with a large sample to explore whether oral microbial diversity and genera abundance prior to treatment, or change over the course of treatment, are associated with the onset of severe OM in HNSCC patients.
At baseline, we identified that increased abundance of Cardiobacterium and Granulicatella is associated with increased hazard of early onset of severe OM. These genera are Gramnegative anaerobic bacteria and exist as part of the normal oral flora, and do not cause disease under normal circumstances. 44,45,46 Cardiobacterium is normally present in the mouth and upper part of the respiratory tract (e.g., nose and throat) and it may also be associated with endocarditis.47,48 While Granulicatella genus is known to be a normal component of the oral flora, which does not cause disease under normal circumstances,44 the species of Granulicatella, G.adiacens, G. elegans and G. balaenopterae, have been associated with a variety of invasive infections and diseases like endocarditis, bacteremia and septic arthritis.44,49,50 Zhu et al. identified that abundance of the normally existing anaerobic oral flora increased the risk and severity of OM in nasopharyngeal carcinoma patients. 51These opportunistic pathogens induce mucosal injury. 44,49,50 Therefore, resuming the balance of oral microbiome, pre-treatment, may serve as a proactive solution to minimize the risk and severity of OM in this population.
During treatment (immediately prior to the development of OM), we found that smaller amount of Streptococcus is associated with shorter average time to onset of sever OM and increased abundance of Fusobacterium and Prevotella is associated with an increased hazard of onset of severe OM. Indeed, studies show that cancer treatment alters the profile of Streptococcus within the oral cavity 52 and has been found to be associated with OM in HNSCC 51 and other cancer patients after cancer treatment. 53 Streptococcus is a genus of spherical bacteria in which over 50 species are recognized. Some species can cause many diseases such as strep throat, carries, pink eye, bacterial pneumonia, endocarditis etc. However many streptococcal species are not pathogenic and form part of the commensal human microbiota of the mouth, skin, intestine and upper respiratory tract.
Further, Zhu et al found that there is intra- and inter-individual variations in the abundance of Fusobacterium and Streptococcus during the cancer treatment of HNSCC patients. 51 As a mucin-degrading bacteria which could promote ulcer formation, 54 Streptococcus subsequently initiates an inflammatory cascade within the deeper tissues, 55 which increases the risk of chronic oral morbidities. Fusobacterium is widely known as a pathogen, which inhabits the mucous membranes of humans, and has been associated with oral morbidities, such as periodontal diseases and topical skin ulcers. Whereas, Prevotella constitutes a major part of the normal flora of mouth and vagina. It is considered as an indicator of a plant-rich diet; however, it is also associated with some health conditions, such as periodontal disease and abscesses.56 It should be noted that in a recent study, Ganly et al57 found in many cases of oral cavity squamous cell carcinoma, pathogens including Fusobacterium, Prevotella, and Alloprevotella were enriched while commensal Streptococcus was depleted. This finding may suggest that the microbiome profile that predisposes a patient to the development HNSCC may also be relevant for toxicity outcomes. Additional studies are needed to explore these relationships.
Later in the treatment course (immediately prior to the development of severe OM), the oral microbiota profile of the patients with severe OM were found to be characterized by increased abundance of Megasphaera and Cardiobacterium, and such unique profile was significantly associated with a higher hazard of early onset of severe OM. Megasphaera is a genus belonging to the phylum Firmicutes, which dominates the human gut microbiota.58 Additionally, Megasphaera and Cardiobacterium species are major groups of the normal oral habitat 46 and found to be overrepresented in periodontal disease. 45
It is important to note that the microbial diversity of our patient population at baseline is similar to healthy adults. However, change in the abundance of the genera over the course of treatment were associated with onset of severe OM. These results suggest that modifying the genera abundance at specific time points may help in prevention and/or treatment of severe OM. However, this hypothesis remains to be tested in future prospective clinical trial with larger samples. Also, additional studies are needed to further explore the extent to which cancer treatment may have an influence on the changes in genera and species-level abundance over the course of treatment.
Among the strengths of our study is that we considered several measures of quality control. For example, when analyzing the genera abundance data, we considered prevalent genera with relative abundance > 0.1% in at least 10% of all samples. We also considered prevalent genera with relative abundance > 0.1% in at least 20% of all samples, and found our analyses were robust to different filters.40
There are limitations to our study. We did not assess dietary changes during the course of therapy which may influence the microbial environment as well as ph (acidity/alkalinity). Further, while this may be the largest study of the impact of microbiome composition in the development of OM, we may have failed to identify additional genera that may be associated with time to onset of severe OM in patients with HNSCC because of our limited sample size. Moreover, the small sample size may also introduce false positive signals. Therefore, our findings that changes in the abundance of the genera over the course of treatment were associated with the onset of severe OM should be viewed as preliminary and exploratory. Future independent studies with larger sample sizes will be necessary to validate the findings and possibly identify additional signals. We also acknowledge that using 16S rRNA sequencing limits the analysis at phyla or genera level.59,60 Species-level analyses using whole genome shotgun sequencing or functional analysis is a potential next step to fully investigate the relationships between oral microbiome community and cancer treatment-related severe OM in cancer patients.
Supplementary Material
Acknowledgements
This work was supported by National Institutes of Health through grants R01DE022891 (CCR and SS), 1R01CA131324 (SS), CPRIT grant RP170259 (SS), SPORE grant P50CA140388 (KAD), CCTS grant 5UL1TR0003167(KAD), and CPRIT grant RP160693 (KAD). This research was also supported in part by the Betty B. Marcus Chair in Cancer Prevention (SS) and the National Cancer Institute grant CA016672 (SS, JW, KAD, CP).
Footnotes
Conflict of interest statement
The authors declare no competing financial interests.
References
- 1.Naidu MU, Ramana GV, Rani PU, Mohan IK, Suman A, Roy P. Chemotherapy-induced and/or radiation therapy-induced oral mucositis--complicating the treatment of cancer. Neoplasia. 2004;6(5):423–431. [DOI] [PMC free article] [PubMed] [Google Scholar]
- 2.Peterson DE, Cariello A. Mucosal damage: a major risk factor for severe complications after cytotoxic therapy. Semin Oncol. 2004;31(3 Suppl 8):35–44. [DOI] [PubMed] [Google Scholar]
- 3.Lalla RV, Sonis ST, Peterson DE. Management of oral mucositis in patients who have cancer. Dent Clin North Am. 2008;52(1):61–77, viii. [DOI] [PMC free article] [PubMed] [Google Scholar]
- 4.Cella D, Pulliam J, Fuchs H, et al. Evaluation of pain associated with oral mucositis during the acute period after administration of high-dose chemotherapy. Cancer. 2003;98(2):406–412. [DOI] [PubMed] [Google Scholar]
- 5.Peterson DE, Boers-Doets CB, Bensadoun RJ, Herrstedt J, Committee EG. Management of oral and gastrointestinal mucosal injury: ESMO Clinical Practice Guidelines for diagnosis, treatment, and follow-up. Ann Oncol. 2015;26 Suppl 5:v139–151. [DOI] [PubMed] [Google Scholar]
- 6.Reyes-Gibby CC, Melkonian SC, Hanna EY, et al. Cohort study of oncologic emergencies in patients with head and neck cancer. Head & neck. 2017;39(6):1195–1204. [DOI] [PMC free article] [PubMed] [Google Scholar]
- 7.Rao NG, Trotti A, Kim J, et al. Phase II multicenter trial of Caphosol for the reduction of mucositis in patients receiving radiation therapy for head and neck cancer. Oral oncology. 2014;50(8):765–769. [DOI] [PMC free article] [PubMed] [Google Scholar]
- 8.Shannon B, Yi TJ, Thomas-Pavanel J, et al. Impact of asymptomatic herpes simplex virus type 2 infection on mucosal homing and immune cell subsets in the blood and female genital tract. J Immunol. 2014;192(11):5074–5082. [DOI] [PubMed] [Google Scholar]
- 9.Sonis ST. The pathobiology of mucositis. Nat Rev Cancer. 2004;4(4):277–284. [DOI] [PubMed] [Google Scholar]
- 10.van Vliet MJ, Harmsen HJ, de Bont ES, Tissing WJ. The role of intestinal microbiota in the development and severity of chemotherapy-induced mucositis. PLoS Pathog. 2010;6(5):e1000879. [DOI] [PMC free article] [PubMed] [Google Scholar]
- 11.Sano T, Huang W, Hall JA, et al. An IL-23R/IL-22 circuit regulates epithelial serum amyloid A to promote local effector Th17 responses. Cell. 2015;163(2):381–393. [DOI] [PMC free article] [PubMed] [Google Scholar]
- 12.Atarashi K, Tanoue T, Ando M, et al. Th17 cell induction by adhesion of microbes to intestinal epithelial cells. Cell. 2015;163(2):367–380. [DOI] [PMC free article] [PubMed] [Google Scholar]
- 13.Bultman SJ. Emerging roles of the microbiome in cancer. Carcinogenesis. 2014;35(2):249–255. [DOI] [PMC free article] [PubMed] [Google Scholar]
- 14.MI Smith, Turpin W, Tyler AD, Silverberg MS, Croitoru K. Microbiome analysis - from technical advances to biological relevance. F1000Prime Rep. 2014;6:51. [DOI] [PMC free article] [PubMed] [Google Scholar]
- 15.Vasconcelos RM, Sanfilippo N, Paster BJ, et al. Host-microbiome cross-talk in oral mucositis. J Dent Res. 2016;95(7):725–733. [DOI] [PMC free article] [PubMed] [Google Scholar]
- 16.Montassier E, Gastinne T, Vangay P, et al. Chemotherapy-driven dysbiosis in the intestinal microbiome. Aliment Pharmacol Ther. 2015;42(5):515–528. [DOI] [PubMed] [Google Scholar]
- 17.Taur Y, Xavier JB, Lipuma L, et al. Intestinal domination and the risk of bacteremia in patients undergoing allogeneic hematopoietic stem cell transplantation. Clin Infect Dis. 2012;55(7):905–914. [DOI] [PMC free article] [PubMed] [Google Scholar]
- 18.Montassier E, Batard E, Massart S, et al. 16S rRNA gene pyrosequencing reveals shift in patient faecal microbiota during high-dose chemotherapy as conditioning regimen for bone marrow transplantation. Microb Ecol. 2014;67(3):690–699. [DOI] [PubMed] [Google Scholar]
- 19.Turnbaugh PJ, Ley RE, Hamady M, Fraser-Liggett CM, Knight R, Gordon JI. The human microbiome project. Nature. 2007;449(7164):804–810. [DOI] [PMC free article] [PubMed] [Google Scholar]
- 20.Zhu X, Wang J, Reyes-Gibby C, Shete S. Processing and Analyzing Human Microbiome Data. Methods Mol Biol. 2017;1666:649–677. [DOI] [PubMed] [Google Scholar]
- 21.Li HZ. Microbiome, Metagenomics, and High-Dimensional Compositional Data Analysis. Annu Rev Stat Appl. 2015;2:73–94. [Google Scholar]
- 22.Kelly CJ, Zheng L, Campbell EL, et al. Crosstalk between Microbiota-Derived Short-Chain Fatty Acids and Intestinal Epithelial HIF Augments Tissue Barrier Function. Cell Host Microbe. 2015;17(5):662–671. [DOI] [PMC free article] [PubMed] [Google Scholar]
- 23.Dewhirst FE, Chen T, Izard J, et al. The human oral microbiome. J Bacteriol. 2010;192(19):5002–5017. [DOI] [PMC free article] [PubMed] [Google Scholar]
- 24.Abendstein H, Nordgren M, Boysen M, et al. Quality of Life and Head and Neck Cancer: A 5 Year Prospective Study. The Laryngoscope. 2005;115(12):2183–2192. [DOI] [PubMed] [Google Scholar]
- 25.Hammerlid E, Bjordal K, Ahlner-Elmqvist M, et al. A Prospective Study of Quality of Life in Head and Neck Cancer Patients. Part I: At Diagnosis. The Laryngoscope. 2001;111(4):669–680. [DOI] [PubMed] [Google Scholar]
- 26.Bhide SA, Miah AB, Harrington KJ, Newbold KL, Nutting CM. Radiation-induced Xerostomia: Pathophysiology, Prevention and Treatment. Clinical Oncology. 2009;21(10):737–744. [DOI] [PubMed] [Google Scholar]
- 27.Dirix P, Nuyts S, Van den Bogaert W. Radiation-induced xerostomia in patients with head and neck cancer. Cancer. 2006;107(11):2525–2534. [DOI] [PubMed] [Google Scholar]
- 28.Cacicedo J, Casquero F, Martinez-Indart L, et al. A prospective analysis of factors that influence weight loss in patients undergoing radiotherapy. Chinese Journal of Cancer. 2014;33(4):204–210. [DOI] [PMC free article] [PubMed] [Google Scholar]
- 29.Cacicedo J, Dal Pra A, Alongi F, Navarro A. Impact of weight loss in patients with head and neck carcinoma undergoing radiotherapy: is it an underestimated phenomenon[quest] A radiation oncologist/’s perspective. Eur J Clin Nutr. 2015;69(7):757–760. [DOI] [PubMed] [Google Scholar]
- 30.Human Microbiome Project C. Structure, function and diversity of the healthy human microbiome. Nature. 2012;486(7402):207–214. [DOI] [PMC free article] [PubMed] [Google Scholar]
- 31.Human Microbiome Project C. A framework for human microbiome research. Nature. 2012;486(7402):215–221. [DOI] [PMC free article] [PubMed] [Google Scholar]
- 32.Edgar RC. Search and clustering orders of magnitude faster than BLAST. Bioinformatics. 2010;26(19):2460–2461. [DOI] [PubMed] [Google Scholar]
- 33.Edgar RC. UPARSE: highly accurate OTU sequences from microbial amplicon reads. Nat Methods. 2013;10(10):996–998. [DOI] [PubMed] [Google Scholar]
- 34.Quast C, Pruesse E, Yilmaz P, et al. The SILVA ribosomal RNA gene database project: improved data processing and web-based tools. Nucleic acids research. 2013;41(Database issue):D590–596. [DOI] [PMC free article] [PubMed] [Google Scholar]
- 35.McMurdie PJ, Holmes S. phyloseq: an R package for reproducible interactive analysis and graphics of microbiome census data. PloS one. 2013;8(4):e61217. [DOI] [PMC free article] [PubMed] [Google Scholar]
- 36.McMurdie PJ, Holmes S. Waste not, want not: why rarefying microbiome data is inadmissible. Plos Comput Biol. 2014;10(4):e1003531. [DOI] [PMC free article] [PubMed] [Google Scholar]
- 37.Weiss S, Xu ZZ, Peddada S, et al. Normalization and microbial differential abundance strategies depend upon data characteristics. Microbiome. 2017;5(1):27. [DOI] [PMC free article] [PubMed] [Google Scholar]
- 38.Research CfMaM. ATIMA (Agile Toolkit for Incisive Microbial Analyses). 2017;http://atima.jplab.net.
- 39.Morgan XC, Huttenhower C. Chapter 12: Human microbiome analysis. PLoS computational biology. 2012;8(12):e1002808. [DOI] [PMC free article] [PubMed] [Google Scholar]
- 40.Zhang Y, Han SW, Cox LM, Li H. A multivariate distance-based analytic framework for microbial interdependence association test in longitudinal study. Genetic epidemiology. 2017;41(8):769–778. [DOI] [PMC free article] [PubMed] [Google Scholar]
- 41.Cai C, Zou Y, Peng Y, Zhang J. smcure: an R-package for estimating semiparametric mixture cure models. Comput Methods Programs Biomed. 2012;108(3):1255–1260. [DOI] [PMC free article] [PubMed] [Google Scholar]
- 42.Berkson J, Gage RP. Survival Curve for Cancer Patients Following Treatment. J Am Stat Assoc. 1952;47(259):501–515. [Google Scholar]
- 43.Boag JW. Maximum Likelihood Estimates of the Proportion of Patients Cured by Cancer Therapy. J Roy Stat Soc B. 1949;11(1):15–53. [Google Scholar]
- 44.Cargill JS, Scott KS, Gascoyne-Binzi D, Sandoe JA. Granulicatella infection: diagnosis and management. J Med Microbiol. 2012;61(Pt 6):755–761. [DOI] [PubMed] [Google Scholar]
- 45.Peterson SN, Snesrud E, Liu J, et al. The dental plaque microbiome in health and disease. PloS one. 2013;8(3):e58487–e58487. [DOI] [PMC free article] [PubMed] [Google Scholar]
- 46.Nallabelli N, Patil PP, Pal VK, et al. Biochemical and genome sequence analyses of Megasphaera sp. strain DISK18 from dental plaque of a healthy individual reveals commensal lifestyle. Scientific reports. 2016;6:33665–33665. [DOI] [PMC free article] [PubMed] [Google Scholar]
- 47.Malani AN, Aronoff DM, Bradley SF, Kauffman CA. Cardiobacterium hominis endocarditis: Two cases and a review of the literature. Eur J Clin Microbiol Infect Dis. 2006;25(9):587–595. [DOI] [PMC free article] [PubMed] [Google Scholar]
- 48.Chen M, Kemp M, Bruun NE, et al. Cardiobacterium valvarum infective endocarditis and phenotypic/molecular characterization of 11 Cardiobacterium species strains. J Med Microbiol. 2011;60(Pt 4):522–528. [DOI] [PubMed] [Google Scholar]
- 49.Collins MD, Lawson PA. The genus Abiotrophia (Kawamura et al.) is not monophyletic: proposal of Granulicatella gen. nov., Granulicatella adiacens comb, nov., Granulicatella elegans comb. nov. and Granulicatella balaenopterae comb. nov. Int J Syst Evol Microbiol. 2000,50 Pt 1:365–369. [DOI] [PubMed] [Google Scholar]
- 50.Bizzarro MJ, Callan DA, Farrel PA, Dembry LM, Gallagher PG. Granulicatella adiacens and early-onset sepsis in neonate. Emerg Infect Dis. 2011;17(10):1971–1973. [DOI] [PMC free article] [PubMed] [Google Scholar]
- 51.Zhu X-X, Yang X-J, Chao Y-L, et al. The Potential Effect of Oral Microbiota in the Prediction of Mucositis During Radiotherapy for Nasopharyngeal Carcinoma. EBioMedicine. 2017;18:23–31. [DOI] [PMC free article] [PubMed] [Google Scholar]
- 52.Tong HC, Gao XJ, Dong XZ. Non-Mutans Streptococci in Patients Receiving Radiotherapy in the Head and Neck Area. Caries Research. 2003;37(4):261–266. [DOI] [PubMed] [Google Scholar]
- 53.Napeñas JJ, Brennan MT, Bahrani-Mougeot FK, Fox PC, Lockhart PB. Relationship between mucositis and changes in oral microflora during cancer chemotherapy. Oral Surgery, Oral Medicine, Oral Pathology, Oral Radiology, and Endodontology. 2007;103(1):48–59. [DOI] [PubMed] [Google Scholar]
- 54.Donnelly JP, Bellm LA, Epstein JB, Sonis ST, Symonds RP. Antimicrobial therapy to prevent or treat oral mucositis. Lancet Infectious Diseases. 2003;3(7):405–412. [DOI] [PubMed] [Google Scholar]
- 55.Deplancke B, Gaskins HR. Microbial modulation of innate defense: goblet cells and the intestinal mucus layer. The American Journal of Clinical Nutrition. 2001;73(6):1131S–1141S. [DOI] [PubMed] [Google Scholar]
- 56.Tanaka S, Yoshida M, Murakami Y, et al. The relationship of Prevotella intermedia, Prevotella nigrescens and Prevotella melaninogenica in the supragingival plaque of children, caries and oral malodor. J Clin Pediatr Dent. 2008;32(3):195–200. [DOI] [PubMed] [Google Scholar]
- 57.Ganly I, Yang L, Giese RA, et al. Periodontal pathogens are a risk factor of oral cavity squamous cell carcinoma, independent of tobacco and alcohol and human papillomavirus. Int J Cancer. 2019. [DOI] [PMC free article] [PubMed] [Google Scholar]
- 58.Shetty SA, Marathe NP, Lanjekar V, Ranade D, Shouche YS. Comparative genome analysis of Megasphaera sp. reveals niche specialization and its potential role in the human gut. PloS one. 2013;8(11):e79353. [DOI] [PMC free article] [PubMed] [Google Scholar]
- 59.Ho NT, Li F, Wang S, Kuhn L. metamicrobiomeR: an R package for analysis of microbiome relative abundance data using zero-inflated beta GAMLSS and meta-analysis across studies using random effects models. BMC Bioinformatics. 2019;20(1):188. [DOI] [PMC free article] [PubMed] [Google Scholar]
- 60.Li H, Li C, Zhang C, Chen B, Hui L, Shen Y. Compositional and gastrointestinal prokinetic studies of Pugionium (L.). Food chemistry. 2015;186:285–291. [DOI] [PubMed] [Google Scholar]
Associated Data
This section collects any data citations, data availability statements, or supplementary materials included in this article.