

Abstract
Scope:
New biomarkers are needed that are representative of dietary intake.
Methods and results:
We assessed metabolites associated with Southern dietary patterns in 1,401 Jackson Heart Study participants. Three dietary patterns were empirically derived using principal component analysis: meat and fast food, fish and vegetables, and starchy foods. We randomly selected two subsets of the study population: 2/3 sample for discovery (n=934) and 1/3 sample for replication (n=467). Among the 327 metabolites analyzed, 14 were significantly associated with the meat and fast food dietary pattern, four were significantly associated with the fish and vegetables dietary pattern, and none were associated with the starchy foods dietary pattern in the discovery sample. In the replication sample, nine remained associated with the meat and fast food dietary pattern (indole-3-propanoic acid, C24:0 LPC, N-methyl proline, proline betaine, C34:2 PE plasmalogen, C36:5 PE plasmalogen, C38:5 PE plasmalogen, cotinine, hydroxyproline) and three remained associated with the fish and vegetables dietary pattern [1,7-dimethyluric acid, C22:6 lysophosphatidylethanolamine, docosahexaenoic acid (DHA)].
Conclusion:
Twelve metabolites were discovered and replicated in association with dietary patterns detected in a Southern U.S. African-American population, which could be useful as biomarkers of Southern dietary patterns.
Keywords: African Americans, biomarkers, dietary intake, dietary patterns, metabolomics
Graphical Abstract - Text
New biomarkers are needed for the objective assessment of dietary intake. Eleven metabolites were discovered and replicated in association with dietary patterns detected in a Southern U.S. African-American population, which could be useful as biomarkers of Southern dietary patterns.

1. INTRODUCTION
Diet is an important modifiable risk factor for hypertension, cardiovascular disease, and other chronic diseases.[1,2] Dietary patterns in southern regions of the U.S. are distinct from other geographic regions. In the Reasons for Geographic and Racial Differences in Stroke (REGARDS) study, individuals who consumed a Southern dietary pattern, characterized by a high intake of added fats, fried food, eggs, organ and processed meats, and sugar-sweetened beverages, were found to have an increased risk for coronary heart disease.[3] In a separate analysis of the REGARDS study, out of 12 social and clinical factors examined, the Southern diet was the largest mediator of racial disparities between black and white adults in the incidence of hypertension, explaining 52% of the excess risk in black vs. white men and 29% of the excess risk in black vs. white women.[4]
Dietary intake is typically assessed in research settings by self-report through the use of well-established tools such as the 24-hour diet recall, diet records/diaries, or food frequency questionnaires. However, these methods are limited by bias (e.g. recall bias and social desirability bias) and other sources of measurement error.[5,6] Existing biomarkers of dietary intake represent single nutrients, such as 24-hour urine excretion of urea nitrogen as a marker of protein consumption.[7] Dietary patterns are a more holistic measure of dietary intake, in that they account for interactions between nutrients and food items.[8] Furthermore, studying dietary patterns is worthwhile as they are recommended in the current dietary guidelines and patterns better reflect how food is purchased, prepared, and consumed.[9] Using biomarkers may provide a more objective and reproducible assessment of overall dietary patterns versus using tools based on self-report.[10,11] Recent research has documented biomarkers associated with selected healthy dietary patterns and indices representing adherence to dietary guidelines, such as the Dietary Approaches to Stop Hypertension (DASH) diet, the Mediterranean diet, the Healthy Eating Index, and the Alternative Healthy Eating Index.[12–16] However, there are no known biomarkers of Southern dietary patterns.
Metabolomics allows for the comprehensive characterization of small metabolic compounds in biological specimens.[17] The metabolome is responsive to dietary intake and, therefore, is a useful method for detecting biomarkers of dietary intake and metabolic pathways that are potentially modifiable by diet.[18] Currently available metabolomic platforms allow for the efficient detection of hundreds of metabolites that have been accurately identified which optimizes the opportunity for discovery of novel biomarkers.[19,20]
The objective of the current study was to use a broad metabolomic platform to discover and replicate candidate plasma biomarkers of data-derived dietary patterns in a community-based population of African-American adults in the U.S. South.
2. EXPERIMENTAL SECTION
Study Population
The Jackson Heart Study is a large, community-based cohort of African American men and women residing in the Jackson, Mississippi metropolitan area with extensive available information on sociodemographic factors, clinical characteristics, dietary intake, and the plasma metabolome.[21,22] The Jackson Heart Study dataset was selected to investigate the study question given the clinical importance of Southern dietary patterns and availability of metabolomics data. Furthermore, African-Americans experience a disproportionate burden of diet-related diseases and are under-represented in the scientific literature.[2,23] From the original sample of 5,306, we excluded those participants without metabolomic data (n=2,556); those who were not included in the randomly selected metabolomics sample, i.e., cases from a case-cohort study (n=821); those with missing dietary data, implausible energy intake (<600 kcal or >4800 kcal), or outliers (% of energy intake for food group >5 standard deviations from the mean) (n=483); and those with missing information for covariates [age, sex, education, smoking, physical activity, alcohol consumption, estimated glomerular filtration rate (eGFR), multivitamin use, and body mass index] (n=45). After applying these exclusion criteria, the analytic sample consisted of 1,401 Jackson Heart Study participants. Approval was provided by the institutional review board and procedures were followed in accordance with the Declaration of Helsinki.
Dietary Assessment
A modified version of the Lower Mississippi Delta Nutrition Intervention Research Initiative (Delta NIRI) food frequency questionnaire (FFQ), consisting of 158 items, was administered in person to participants by trained and certified research personnel. The Delta NIRI FFQ was designed to assess dietary intake of individuals residing in the lower Mississippi Delta region of the U.S., and it has been validated for use in the Jackson Heart Study by demonstrating associations between FFQ data, 24-hour dietary recall data (specifically with respect to estimation of macronutrient intake), and blood biomarkers of antioxidants.[24,25] Total energy intake was derived from responses on the Delta NIRI FFQ using the University of Minnesota Data System for Research database, which contains nutrient composition information for food and beverages.
Derivation of Dietary Patterns
Principal components analysis (PCA) was used to empirically derive patterns of diets in the study population, given that no a priori indices exist for the assessment of Southern diets.[8] For the analysis, the 158 food items assessed on the FFQ were aggregated into 36 food groups based on similarities or differences in nutrient content and general usage (Supplemental Table 1). Individual food items were preserved if they constituted distinct items or if they were thought to represent particular dietary habits. PCA was performed using the SAS factor procedure with the principal axis method for components extraction (method=principal) and the prior communality estimate of each variable equal to one (priors=one) followed by a varimax (orthogonal) rotation. Principal components with eigenvalues >1.5 were retained. Each component was a distinctive dietary pattern characterized by high or low intake of different food groups. Each food group received a component loading score for each component representing the correlation between the food group and the component. When naming each of the components or dietary patterns, we considered the largest positive component loadings (>0.2) and the largest negative component loadings (<−0.2) as representative of the most influential food groups for a component (dietary pattern). A continuous score was calculated for each participant based on their reported consumption of food groups and weights (component loadings) for each food group within the overall pattern or component. Dietary patterns were assessed among all Jackson Heart Study participants with dietary data, after excluding participants with implausible energy intake (<600 kcal or >4800 kcal) and outliers, defined as percent of energy intake of any food group >5 standard deviations from the mean. Subsequent analyses of metabolites were restricted to the analytic study population described above.
Metabolomic Profiling
Metabolomic profiling was conducted in plasma from fasting blood samples collected at baseline (2000-2004). Metabolites were measured using two complementary, targeted methods of positive ion mode [hydrophilic interaction liquid chromatography (HILIC)] and negative ion mode (amide) ionization. The HILIC method is able to measure polar and water soluble metabolites, including amino acids, amines, acylcarnitines, and a subset of lipids.[26] The second method, the amide method, was utilized to measure central metabolites including sugars, sugar phosphates, organic acids, purine, and pyrimidines.[27] These two methods were chosen to provide a reasonably wide breadth of metabolite classes. Furthermore, by leveraging authentic standards, these methods offer excellent reproducibility with coefficients of variation <10% on average.[27,28]
The first method was HILIC mass spectrometry (MS) detection in the positive ionization mode, which was conducted using a liquid chromatography (LC)-MS system comprised of a Shimadzu Nexera X2 U-HPLC (Shimadzu Corp.) coupled to a Q-Exactive hybrid quadrupole Orbitrap mass spectrometer (Thermo Fisher Scientific). Plasma samples (10 μL) were prepared via protein precipitation with the addition of nine volumes of 74.9:24.9:0.2 v/v/v acetonitrile/methanol/formic acid containing stable isotope-labeled internal standards (valine-d8, Sigma-Aldrich; St. Louis, MO; and phenylalanine-d8, Cambridge Isotope Laboratories; Andover, MA). The samples were centrifuged (10 min, 9,000 x g, 4°C), and the supernatants were injected directly onto a 150 x 2 mm, 3 μm Atlantis HILIC column (Waters). The column was eluted isocratically at a flow rate of 250 μL/min with 5% mobile phase A (10 mM ammonium formate and 0.1% formic acid in water) for 0.5 minute followed by a linear gradient to 40% mobile phase B (acetonitrile with 0.1% formic acid) over 10 minutes. MS analyses were carried out using electrospray ionization in the positive ion mode using full scan analysis over 70-800 m/z at 70,000 resolution and 3 Hz data acquisition rate. Other MS settings were: sheath gas 40, sweep gas 2, spray voltage 3.5 kV, capillary temperature 350°C, S-lens RF 40, heater temperature 300°C, microscans 1, automatic gain control target 1e6, and maximum ion time 250 ms. Metabolite identities were confirmed using authentic reference standards.
With the second method, the amide method, metabolites were extracted from 30 μL of plasma using acetonitrile and methanol and separated using a 100 x 2.1 mm XBridge Amide column (Waters). A high sensitivity Agilent 6490 QQQ mass spectrometer (Agilent) was used to profile metabolites in the negative ion mode via multiple reaction monitoring (MRM) scanning. MRM parameters have been optimized by infusing authentic reference standards for approximately 200 metabolites. Raw data were processed using MassHunter Quantitative Analysis Software (Agilent).
The analytical performance of the LC-MS system and the quality of the metabolomics data are assured using several strategies. Before analyses of the study samples are initiated, mixtures of synthetic reference standards, containing ~150 metabolites each, are analyzed to assure reproducibility of chromatographic retention times, quality of chromatographic peak shapes, and the sensitivity of the MS system.[26] These samples are also monitored periodically during the analysis queue and at the end of the queue to assure that analytical performance is maintained and to confirm compound IDs. On a daily basis throughout the analytical run, internal standard signals are monitored in each sample to ensure proper injection and to monitor MS sensitivity. In addition, pairs of pooled reference samples are inserted in the analysis queue at intervals of 20 study samples for determination of reproducibility and data standardization. The pooled reference sample is created using small aliquots from each study sample at the time the samples are aliquoted. One pooled reference sample from each pair is used to calculate coefficients of variation (CVs) for every metabolite measured throughout the analysis and the second pooled reference sample is used to standardize data across the run using “nearest-neighbor” normalization. The metabolite signals are also evaluated to assure LC retention times and peak shapes. Outlier samples that show peak retention time drift and/or poor peaks shapes upon manual inspection of the data are flagged for re-extraction and re-analysis.
A total of 359 metabolites were detected by these two methods in the JHS specimens. We excluded metabolites with missing data for >75% participants (n=8), medications (n=12), or metabolites with a coefficient of variation >30% (n=12). After applying these exclusions, 327 metabolites were included in the analysis. Values were imputed to half of the lower limit of detection for the metabolites with missing data (i.e. the remaining metabolites with missing data for ≤75% participants).
Statistical Analysis
We calculated descriptive statistics for baseline characteristics according to tertiles of the dietary patterns using means (standard deviations) for continuous variables and n (%) for categorical variables. We tested for differences in baseline characteristics across tertiles of the dietary patterns using linear regression for continuous variables and chi-square tests for categorical variables.
We conducted a cross-sectional analysis using data from baseline (study visit 1) using multivariable linear regression models to estimate β coefficients and 95% confidence intervals for the association between the empirically-derived Southern dietary patterns and standardized log-transformed metabolites after adjusting for age, sex, education, smoking status, physical activity, alcohol consumption, multi-vitamin use, kidney function (estimated glomerular filtration rate), body mass index (kg/m2), and batch. Physical activity level was categorized as poor (0 minutes/week of moderate and physical activity), intermediate (0-150 minutes/week of moderate physical activity or 0-75 minutes/week of vigorous physical activity), and ideal (≥150 minutes/week of moderate physical activity or ≥75 minutes/week of vigorous physical activity).
From the overall sample of 1,401, we designated a 2/3 random sub-sample for discovery (n=934) and used the remaining 1/3 sub-sample for replication purposes (n=467). To account for multiple testing with the large number of metabolites, false discovery rate (FDR) was used in the analysis of the discovery sample. We tested for replication in the replication sample by analyzing only those metabolites that were statistically significantly associated with dietary patterns in the discovery sample. In the replication sample, a conventional threshold of P<0.05 was used to assess statistical significance.
To provide further confirmation of the validity of the detected biomarkers, we decided a posteriori to analyze the association between the candidate biomarkers and the purported food groups that they represent based on a review of the literature, i.e., citrus juice; fruit juice, excluding citrus juice; citrus fruit; fruit, excluding citrus fruit; and fish, excluding fried fish. This analysis was limited to compounds for which there was substantial evidence in the literature. Regression models were adjusted for the same covariates as the main analysis.
We used Spearman rank correlation coefficients (ρ) to assess the magnitude of associations between the replicated metabolites. Stata statistical software version 16.0 was used for the analysis (StataCorp, College Station, Texas).
3. RESULTS
Derived Dietary Patterns
Three distinct dietary patterns were empirically derived using principal component analysis (Table 1). The three dietary patterns explained 17.3% of the total variance. We named the first component the meat and fast food dietary pattern since it had high component loadings, representing higher intake, for fast food, beef, pork, organ meat, processed meat and poultry, and rice and pasta and low component loadings, representing lower intake, for cold cereal (whole grains), fish (excluding fried fish), fruit, fruit juice, hot cereal, milk and dairy, nuts and seeds, and vegetables. The second component, named the fish and vegetables dietary pattern, had strong positive loadings for beans and legumes, fish (excluding fried fish), fruit, hot cereal, potato, soup, and vegetables and strong negative component loadings for baked desserts, non-diet (regular) soft drinks, salty snacks, and sugar and candy. The third component had high component loadings for fast food, fried fish, beef, and salty snacks and low component loadings for bread, corn and corn products, and hot cereal. To focus the interpretation of the third component on starchy food, which was a distinguishing characteristic relative to the other two dietary patterns, we named it the starchy foods dietary pattern and analyzed the inverse of the third component. Whereas the original form of the third component was characterized by low loadings for starchy foods, the transformed component was characterized by high loadings for starchy foods.
Table 1.
Component Loadingsa for Food Groups by Three Southern Dietary Patterns
| Food Groups | Component 1 (Meat and Fast Food) | Component 2 (Fish and Vegetables) | Component 3 (Starchy Foods)b |
|---|---|---|---|
| Alcohol | 0.155 | 0.049 | 0.162 |
| Baked desserts | 0.014 | −0.233 | −0.049 |
| Beans and legumes | 0.113 | 0.231 | −0.075 |
| Bread | −0.006 | 0.089 | −0.238 |
| Cold cereal--sweetened | −0.006 | −0.019 | −0.090 |
| Cold cereal--whole grain | −0.305 | 0.049 | −0.025 |
| Corn and corn products | 0.062 | 0.010 | −0.377 |
| Dairy desserts | −0.027 | −0.131 | −0.080 |
| Eggs | 0.100 | 0.080 | −0.003 |
| Fast food | 0.337 | −0.168 | 0.443 |
| Fish, excluding fried fish | −0.235 | 0.356 | 0.196 |
| Fried fish | −0.044 | 0.182 | 0.344 |
| Fruit | −0.446 | 0.349 | −0.173 |
| Fruit juice | −0.246 | 0.085 | −0.057 |
| Fruit drinks | −0.013 | −0.165 | 0.025 |
| Hot cereal | −0.209 | 0.220 | −0.304 |
| Butter | 0.067 | 0.045 | 0.064 |
| Margarine | 0.053 | 0.106 | −0.177 |
| Beef | 0.441 | −0.020 | 0.266 |
| Pork | 0.370 | 0.021 | 0.120 |
| Game meat | 0.069 | 0.080 | 0.005 |
| Milk and dairy | −0.267 | −0.002 | 0.011 |
| Miscellaneous fats | 0.160 | 0.158 | −0.155 |
| Non-diet soft drink | 0.111 | −0.289 | −0.026 |
| Nuts and seeds | −0.229 | −0.021 | 0.078 |
| Oils and salad dressing | −0.194 | 0.042 | 0.068 |
| Organ meat | 0.262 | 0.111 | −0.099 |
| Potato | 0.162 | 0.223 | −0.081 |
| Poultry | 0.054 | 0.111 | 0.096 |
| Processed meat and poultry | 0.296 | 0.010 | 0.028 |
| Rice and pasta | 0.272 | 0.144 | 0.027 |
| Salty snacks | −0.009 | −0.295 | 0.216 |
| Soup | −0.055 | 0.217 | −0.056 |
| Sugar and candy | −0.099 | −0.308 | −0.004 |
| Tea and coffee | 0.005 | −0.142 | −0.006 |
| Vegetables | −0.249 | 0.413 | −0.197 |
Component loading values above 0.200 and below −0.200 appear in bold font.
We analyzed the inverse of the third component and called it the starchy food dietary pattern.
Characteristics of the Study Population
Those participants with greater adherence to the meat and fast food dietary pattern were younger, consumed more alcohol, and were less likely to have diabetes (Table 2). Those in the highest tertile of the meat and fast food dietary pattern were twice as likely to be current smokers compared to those in the lowest tertile (16% vs. 8%, P<0.001). Participants in higher tertiles of the fish and vegetables dietary pattern were older, had higher systolic blood pressure and were more likely to be taking anti-hypertensive medications, were more likely to have diabetes and had higher fasting plasma glucose. For the starchy foods dietary pattern, those with higher adherence were younger, consumed more alcohol, were less likely to have a history of cardiovascular disease, had lower systolic blood pressure, were less likely to be using anti-hypertensive medications, less likely to have diabetes, and had lower fasting plasma glucose and total cholesterol (Supplemental Table 2).
Table 2.
Baseline Characteristics by Tertiles of Two Southern Dietary Patterns: Meat and Fast Food Dietary Pattern and Fish and Vegetables Dietary Pattern
| Meat and Fast Food | Fish and Vegetables | |||||||
|---|---|---|---|---|---|---|---|---|
| Characteristica | Tertile 1 (n=467) |
Tertile 2 (n=467) |
Tertile 3 (n=467) |
P-value | Tertile 1 (n=467) |
Tertile 2 (n=467) |
Tertile 3 (n=467) |
P-value |
| Age, years | 57.2 (12.3) | 53.3 (11.8) | 49.8 (12.7) | <0.001 | 50.4 (12.8) | 53.6 (12.9) | 56.2 (11.4) | <0.001 |
| Education, n (%) | ||||||||
| <High school | 74 (16%) | 75 (16%) | 80 (17%) | 0.39 | 71 (15%) | 81 (17%) | 77 (16%) | 0.94 |
| High school/GED | 76 (16%) | 96 (21%) | 94 (20%) | 90 (19%) | 87 (19%) | 89 (19%) | ||
| Attended vocational school, trade school, or college | 317 (68%) | 296 (63%) | 293 (63%) | 306 (66%) | 299 (64%) | 301 (64%) | ||
| Current smoker, n (%) | 37 (8%) | 52 (11%) | 77 (16%) | <0.001 | 56 (12%) | 61 (13%) | 49 (10%) | 0.48 |
| Physical activity level category, n (%) | ||||||||
| Poor | 199 (43%) | 242 (52%) | 225 (48%) | 0.03 | 215 (46%) | 236 (51%) | 215 (46%) | 0.35 |
| Intermediate | 163 (35%) | 129 (28%) | 158 (34%) | 163 (35%) | 137 (29%) | 150 (32%) | ||
| Ideal | 105 (22%) | 96 (21%) | 84 (18%) | 89 (19%) | 94 (20%) | 102 (22%) | ||
| Alcohol consumption, drinks per week | 0.6 (2.9) | 1.3 (4.2) | 2.2 (5.5) | <0.001 | 1.3 (4.1) | 1.4 (4.8) | 1.3 (4.2) | 0.83 |
| History of cardiovascular disease, n (%) | 63 (13%) | 36 (8%) | 45 (10%) | 0.01 | 42 (9%) | 38 (8%) | 64 (14%) | 0.01 |
| Systolic blood pressure, mmHg | 126 (16) | 126 (17) | 125 (15) | 0.67 | 125 (15) | 125 (15) | 128 (18) | 0.008 |
| Blood pressure lowering medication use, n (%) | 264 (57%) | 236 (51%) | 188 (40%) | <0.001 | 180 (39%) | 220 (47%) | 288 (62%) | <0.001 |
| Diabetes, n (%) | 118 (25%) | 89 (19%) | 75 (16%) | 0.002 | 79 (17%) | 90 (19%) | 113 (24%) | 0.02 |
| Fasting plasma glucose, mg/dL | 104 (42) | 97.2 (23.7) | 98.5 (33.9) | 0.006 | 97.8 (32.1) | 99.4 (32.5) | 103 (37) | 0.09 |
| Total cholesterol, mg/dL | 201 (40) | 196 (41) | 196 (38) | 0.12 | 194 (36) | 199 (38) | 200 (44) | 0.06 |
| Statin medication use, n (%) | 73 (16%) | 42 (9%) | 38 (8%) | <0.001 | 33 (7%) | 44 (9%) | 76 (16%) | <0.001 |
| Estimated glomerular filtration rate, mL/min/1.73 m2 | 92.2 (23.5) | 94.9 (22.9) | 99.6 (20.9) | <0.001 | 98.3 (21.7) | 96.4 (22.6) | 91.9 (23.2) | <0.001 |
| Body mass index, kg/m2 | 31.8 (7.1) | 32.4 (7.7) | 31.9 (7.8) | 0.49 | 32.2 (7.6) | 32.0 (7.7) | 31.9 (7.3) | 0.87 |
| Multivitamin use, n (%) | 142 (30%) | 132 (28%) | 96 (21%) | 0.002 | 116 (25%) | 128 (27%) | 126 (27%) | 0.63 |
GED, general education development, equivalent to a high school graduate.
Means (standard deviations) are presented for continuous variables and n (%) are presented for categorical variables.
Association between Metabolites and Southern Dietary Patterns
Among the 327 metabolites analyzed, 14 were significantly (FDR<0.05) associated with the meat and fast food dietary pattern in the discovery sample: indole-3-propanoic acid, C18:0 LPE_B, C22:6 LPC, C24:0 LPC, C34:2 PE plasmalogen, C36:5 plasmalogen, C38:5 plasmalogen, cotinine, creatine, diacetylspermine, hydroxyproline, N-methyl proline, and proline betaine (Table 3). Nine out of the 14 metabolites were statistically significantly associated with the meat and fast food dietary pattern in the replication sample at a conventional threshold (P<0.05) (Figure 1). Indole-3-propanoic acid, C24:0 LPC, N-methyl proline, and proline betaine were inversely associated with the meat and fast food dietary pattern. C34:2 PE plasmalogen, C36:5 PE plasmalogen, C38:5 PE plasmalogen, cotinine, and hydroxyproline were positively associated with the meat and fast food dietary pattern.
Table 3.
Metabolites Significantly Associated with Southern Dietary Patterns in the Discovery and Replication Samplesa
| Discovery Sample | Replication Sample | |||
|---|---|---|---|---|
| Dietary Patternb | Metabolite | β (95% CI)c | β (95% CI)c | P-value |
| Meat and fast food | indole-3-propanoic acid | −0.170 (−0.253, −0.087) | −0.143 (−0.274, −0.013) | 0.03 |
| C18:0 LPE B | −0.138 (−0.222, −0.054) | |||
| C22:6 LPC | −0.142 (−0.226, −0.059) | |||
| C24:0 LPC | −0.132 (−0.212, −0.051) | −0.139 (−0.263, −0.014) | 0.02 | |
| C34:2 PE plasmalogen | 0.139 (0.055, 0.224) | 0.218 (0.085, 0.351) | 0.001 | |
| C36:5 PE plasmalogen | 0.127 (0.043, 0.211) | 0.236 (0.106, 0.366) | 0.0004 | |
| C38:5 PE plasmalogen | 0.173 (0.090, 0.257) | 0.311 (0.179, 0.444) | 4.6×10⁻⁶ | |
| cotinine | 0.102 (0.043, 0.160) | 0.117 (0.029, 0.205) | 0.01 | |
| creatine | 0.120 (0.044, 0.196) | |||
| diacetylspermine | 0.155 (0.075, 0.236) | |||
| hydroxyproline | 0.167 (0.085, 0.248) | 0.250 (0.127, 0.373) | 7.6×10⁻⁵ | |
| N-acetylleucine | 0.139 (0.058, 0.220) | |||
| N-methyl proline | −0.149 (−0.233, −0.066) | −0.143 (−0.274, −0.012) | 0.03 | |
| proline betaine | −0.156 (−0.238, −0.074) | −0.248 (−0.369, −0.126) | 7.5×10⁻⁵ | |
| Fish and vegetables | DHA | 0.148 (0.072, 0.224) | 0.217 (0.113, 0.321) | 4.9×10⁻⁵ |
| 1,7-dimethyluric acid | −0.233 (−0.302, −0.165) | −0.132 (−0.230, −0.034) | 0.009 | |
| caffeine | −0.239 (−0.308, −0.170) | |||
| C22:6 lysophosphatidylethanolamine (LPE) | 0.137 (0.072, 0.201) | 0.148 (0.050, 0.245) | 0.003 | |
CI, confidence interval
Metabolites that were significantly associated with Southern dietary patterns in the discovery sample using a false discovery rate (FDR) <0.05 to determine statistical significance. The table also presents results for metabolites that were statistically significantly associated with Southern dietary patterns in the replication sample using P<0.05 to determine statistical significance.
No metabolites were statistically significantly associated with the starchy foods dietary pattern.
Multivariable linear regression models, adjusted for age, sex, education, smoking, physical activity, alcohol, estimated glomerular filtration rate, multivitamin use, batch, and body mass index, were used to calculate β coefficients and 95% confidence intervals for the association between metabolites and dietary patterns.
Figure 1. Scatterplot of β Coefficients and P-Values for the Association between Metabolites and the Meat and Fast Food Dietary Pattern in the Discovery and Replication Samples.

Black dots represent metabolites in the discovery sample that were not statistically significant (false discovery rate ≥0.05). Red dots represent metabolites in the discovery sample that were statistically significant (false discovery rate <0.05). Grey dots represent metabolites in the replication sample that were not statistically significant (false discovery rate ≥0.05 or replication p-value ≥0.05). Green dots represent metabolites in the replication sample that were statistically significant (false discovery rate <0.05 and replication p-value <0.05).
Four metabolites were significantly (FDR<0.05) associated with the fish and vegetables dietary pattern in the discovery sample: docosahexaenoic acid (DHA), 1,7-dimethyluric acid, caffeine, and C22:6 lysophosphatidylethanolamine (LPE). Three of them remained statistically significantly associated with the fish and vegetables dietary pattern in the replication sample: DHA, 1,7-dimethyluric acid, and C22:6 LPE (Figure 2).
Figure 2. Scatterplot of β Coefficients and P-Values for the Association between Metabolites and the Fish and Vegetables Dietary Pattern in the Discovery and Replication Samples.
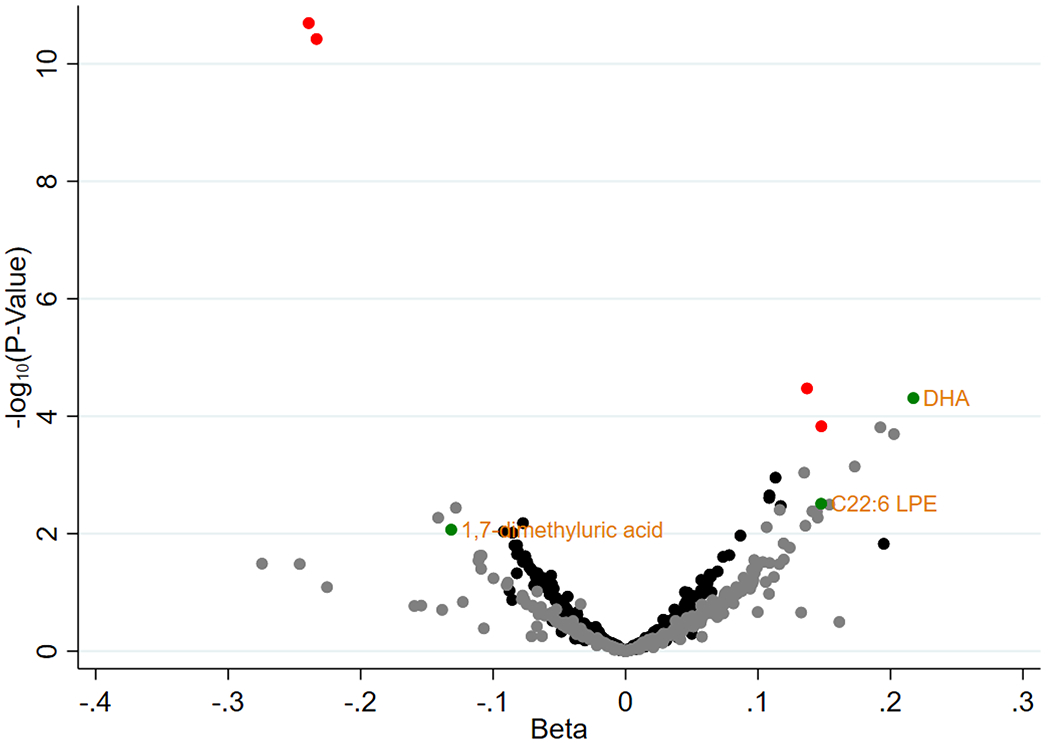
Black dots represent metabolites in the discovery sample that were not statistically significant (false discovery rate ≥0.05). Red dots represent metabolites in the discovery sample that were statistically significant (false discovery rate <0.05). Grey dots represent metabolites in the replication sample that were not statistically significant (false discovery rate ≥0.05 or replication p-value ≥0.05). Green dots represent metabolites in the replication sample that were statistically significant (false discovery rate <0.05 and replication p-value <0.05).
None of the metabolites was associated with the starchy foods dietary pattern at a FDR threshold of 0.05 (Figure 3).
Figure 3. Scatterplot of β Coefficients and P-Values for the Association between Metabolites and the Starchy Foods Dietary Pattern in the Discovery and Replication Samples.

Black dots represent metabolites in the discovery sample that were not statistically significant (false discovery rate ≥0.05). Red dots represent metabolites in the discovery sample that were statistically significant (false discovery rate <0.05). Grey dots represent metabolites in the replication sample that were not statistically significant (false discovery rate ≥0.05 or replication p-value ≥0.05). Green dots represent metabolites in the replication sample that were statistically significant (false discovery rate <0.05 and replication p-value <0.05).
For the metabolites that replicated in the discovery and replication samples, the direction of the association was the same and the magnitude of the association was similar in the two samples.
Association between Selected Metabolites and Individual Food Items and Health Behaviors
Proline betaine was positively associated with consumption of citrus juice (β: 0.356, 95% CI: 0.309, 0.403, P<1.0×10−40), other fruit juice (β: 0.066, 95% CI: 0.004, 0.128, P=0.04), and citrus fruit (β: 1.815, 95% CI: 1.322, 2.309, P=8.4×10⁻¹³). C22:6 LPE (β: 0.086, 95% CI: 0.043, 0.129, P=1.0×10⁻⁴) and DHA (β: 0.198, 95% CI: 0.149, 0.247, P=5.5×10⁻¹⁵) were positively associated with fish consumption.
Correlation between Metabolites
For the 12 metabolites that replicated in the discovery and replication samples, there was a wide range in the correlation between metabolites from −0.278 (between C22:6 LPE and DHA, P<0.001) to 0.942 (between C36:5 PE plasmalogen and C38:5 PE plasmalogen, P<0.001) (Table 4). All three forms of PE plasmalogen (C34:2, C36:5, and C38:5) were strongly positively correlated with each other (ρ=0.900 to 0.942), strongly positively correlated with hydroxyproline (ρ=0.750 to 0.769), and moderately positively correlated with C22:6 LPE (ρ=0.624 to 0.641). N-methyl proline was strongly positively correlated with proline betaine (ρ=0.890).
Table 4.
Spearman Correlation Coefficients (ρ) between 12 Replicated Metabolites
| indole-3-propanoic acid | C24:0 LPC | C34:2 PE plasmalogen | C36:5 PE plasmalogen | C38:5 PE plasmalogen | cotinine | hydroxyproline | N-methyl proline | proline betaine | 1,7-dimethyluric acid | C22:6 LPE | DHA | |
|---|---|---|---|---|---|---|---|---|---|---|---|---|
| indole-3-propanoic acid | 1 | |||||||||||
| C24:0 LPC | 0.101a | 1 | ||||||||||
| C34:2 PE plasmalogen | −0.059 | 0.022 | 1 | |||||||||
| C36:5 PE plasmalogen | −0.075a | −0.053 | 0.900a | 1 | ||||||||
| C38:5 PE plasmalogen | −0.084a | −0.039 | 0.913a | 0.942a | 1 | |||||||
| cotinine | −0.181a | −0.049 | 0.376a | 0.376a | 0.400a | 1 | ||||||
| hydroxyproline | −0.116a | −0.089a | 0.750a | 0.769a | 0.759a | 0.487a | 1 | |||||
| N-methyl proline | 0.052 | 0.045 | 0.421a | 0.407a | 0.392a | 0.175a | 0.428a | 1 | ||||
| proline betaine | 0.048 | 0.025 | 0.411a | 0.403a | 0.398a | 0.168a | 0.449a | 0.890a | 1 | |||
| 1,7-dimethyluric acid | −0.028 | −0.084a | 0.365a | 0.374a | 0.377a | 0.216a | 0.373a | 0.210a | 0.232a | 1 | ||
| C22:6 LPE | −0.069a | −0.046 | 0.624a | 0.632a | 0.641a | 0.397a | 0.607a | 0.414a | 0.466a | 0.385a | 1 | |
| DHA | 0.064a | 0.0003 | −0.039 | 0.021 | −0.021 | −0.143a | −0.081a | 0.076a | 0.083a | −0.027 | −0.278a | 1 |
P-value<0.05
4. DISCUSSION
In this study population of 1,401 African-American men and women residing in Jackson, Mississippi, we discovered and validated biomarkers of two Southern dietary patterns. We detected 9 metabolites as candidate markers of the meat and fast food dietary pattern: indole-3-propanoic acid, C24:0 LPC, N-methyl proline, proline betaine, C34:2 PE plasmalogen, C36:5 PE plasmalogen, C38:5 PE plasmalogen, cotinine, and hydroxyproline. In addition, we found three candidate biomarkers of the fish and vegetables dietary pattern: docosahexaenoic acid (DHA), 1,7-dimethyluric acid, and C22:6 lysophosphatidylethanolamine (LPE). Results were consistent in magnitude of association and direction in both sub-samples designated for discovery and replication efforts. These associations were independent of socio-demographic characteristics, health behaviors, and clinical factors.
N-methyl proline and proline betaine (also referred to as stachydrine), which are known biomarkers of citrus, were inversely associated with the meat and fast food dietary pattern.[29,30] Fruit and fruit juice had strong negative component loadings for this dietary pattern. The observation that these metabolites were positively associated with citrus juice, other fruit juice, and citrus fruit in our study provides further support for lower concentrations of these proline derivatives being representative of higher adherence to a meat and fast food dietary pattern. Higher concentrations of both N-methyl proline and proline betaine were found to be two of the ten most influential metabolites for distinguishing between the Dietary Approaches to Stop Hypertension (DASH) diet and the control diet in the original DASH trial.[31] Proline betaine has been documented as an osmoprotective agent, and could be beneficial for promoting kidney health.[32]
Another metabolite inversely associated with the meat and fast food dietary pattern was indole-3-propanoic acid (IPA). This compound, the deamination product of tryptophan, is endogenously produced by the microbiota.[33,34] Indole-3-propanoic acid has been associated with cardiometabolic health (i.e., weight, diabetes).[35,36] Furthermore, indole-3-propanoic acid is a powerful antioxidant, and has been reported to suppress inflammation and fibrosis in proximal tubular cells of the kidneys.[37,38] In a blood metabolomics analysis of the Modification of Diet in Renal Disease (MDRD) study and the African-American Study of Kidney Disease and Hypertension (AASK), indolepropionate and a related compound, indolepropionylglycine, were inversely associated with dietary acid load. Higher dietary acid load results from the consumption of acid-producing foods (e.g. meat and cheese) and is associated with higher risk of incident kidney disease.[39,40] Indole-3-propanoic acid may be indicative of metabolic pathways relevant to diet-disease relationships.
Lysophosphatidylcholine (LPC) C24:0 was also inversely associated with the meat and fast food dietary pattern. This specific fatty acid contains a chain of lignoceric acid, which is derived from groundnut oil (also referred to as peanut oil).[41] This finding is consistent with the derived meat and fast food dietary pattern which includes a negative component loading for oils and salad dressings.
Three phosphatidylethanolamine (PE) plasmalogens (C34:2, C36:5, and C38:5) were positively associated with the meat and fast food dietary pattern. Food sources of these lipids include chicken, pork, beef, fish, and milk.[42] The detection of plasmalogens in this study may be more representative of meat consumption than fish and milk, given that there were positive component loadings for a variety of meat groups (beef, pork, processed meat and poultry) and negative component loadings for milk (and other dairy products) and fish (excluding fried fish). Plasmalogens serve as structural lipids, are involved in cellular signaling, and may function as antioxidants.[43,44]
In our study, hydroxyproline was positively related to the meat and fast food dietary pattern. This compound is found in higher concentrations in sausages and hamburgers. Hydroxyproline predominates in collagen, a protein found in animals.[45] In a randomized trial with an intervention consisting of beef-based meals, hydroxyproline was significantly increased.[46] In a blood metabolomics study conducted in the TwinsUK cohort, hydroxyproline was discovered and replicated as a marker of red meat intake.[47] Taken together, these findings provide support for hydroxyproline as a marker of a Southern meat and fast food dietary pattern.
Cotinine is a metabolite of nicotine and, as such, is an established blood biomarker of exposure to tobacco.[48] We observed higher cotinine among those with higher adherence to the meat and fast food dietary pattern. In addition, those with higher adherence to this dietary pattern were more likely to be current cigarette smokers. This finding highlights the relationship between poor diet quality and unfavorable health behaviors, i.e., smoking.
Three metabolites were associated with the fish and vegetables dietary pattern in both the discovery and replication samples. 1,7-dimethyluric acid, a xanthine metabolite and downstream product of caffeine metabolism, was inversely associated with this dietary pattern.[49] Tea and coffee and baked desserts food groups, which are potential dietary sources of caffeine, had negative component loadings for the fish and vegetables dietary pattern in our study.
C22:6 lysophosphatidylethanolamine (LPE) was positively associated with the fish and vegetables dietary pattern in our study. This compound is used in agriculture to regulate the growth of fruits and vegetables, to stimulate ripening, to increase color and sugar content, and to preserve harvested crops by delaying senescence.[50–52] For the fish and vegetables dietary pattern, fruits and vegetables had positive component loadings, which aligns with our interpretation of this compound as representative of these food items.
Docosahexaenoic acid (DHA), a well-known essential omega-3 fatty acid, was positively associated with the fish and vegetables dietary pattern. The main food source of this long-chain, polyunsaturated fatty acid is fatty fish and seafood.[53] This metabolite was positively associated with fish consumption in our study, and the fish and vegetables dietary pattern had a strong positive component loading for fish. This finding was expected and adds to the validity of our overall study.
The present study has several notable strengths. We were able to detect a broad array of metabolites (n=327) in a relatively large sample (n=1,401). Two methods were used to identify both polar and non-polar compounds. Reference standards were used to confirm the identity of the compounds, thus providing greater validity for this high-throughput technology. We purposefully conducted this study in the Jackson Heart Study cohort and derived dietary patterns empirically, given the lack of a standardized definition of Southern diets and the importance of Southern diets with respect to chronic disease outcomes, which have been reported to, in part, explain racial disparities.[3,4] Dietary intake was assessed using a food frequency questionnaire that was designed for the Mississippi Delta region and validated in the Jackson Heart Study population.[24,25] We accounted for confounding factors in multivariable regression models, using extensive data collected in a standardized manner by trained personnel, thereby minimizing the potential for residual confounding. We not only conducted the initial analysis to discover novel markers of the dietary pattern, but also conducted a second analysis to replicate the associations in a separate subset of the overall study population. In the discovery analysis, we accounted for multiple testing using the false discovery rate to assess statistical significance.
Certain limitations should also be acknowledged. One of the main limitations is the lack of replication in an external study population. We created two random subsets of the Jackson Heart Study population for discovery and internal replication. However, it was not possible to conduct external validation, as dietary patterns were derived in our own study population. Future research is warranted to develop standardized indices of Southern dietary patterns. As with any observational study, there is the possibility that residual confounding, due to unmeasured or imprecisely measured confounders, partially explains the findings. Lastly, to follow-up on these initial discovery findings detected using a broad metabolomic platform incorporating two methods, it would be useful to develop targeted, quantitative assays of candidate diet biomarkers for use in other study populations.
In summary, we found a total of 12 metabolites from a broad metabolomic platform associated with Southern dietary patterns, which replicated internally in a population of community-dwelling African-American adults. These compounds are candidate biomarkers that could be used to assess adherence to two distinct Southern dietary patterns, i.e. meat and fast food dietary pattern as well as fish and vegetables dietary pattern. Further research is needed to examine whether these candidate biomarkers represent Southern dietary patterns in a feeding study, in which dietary intake is known and well-controlled. In addition, these findings provide new insights about potential mechanisms linking Southern dietary patterns to chronic disease outcomes.
Supplementary Material
ACKNOWLEDGEMENTS
The authors also wish to thank the staff and participants of the Jackson Heart Study (JHS). The views expressed in this manuscript are those of the authors and do not necessarily represent the views of the National Heart, Lung, and Blood Institute; the National Institutes of Health; or the U.S. Department of Health and Human Services.
The JHS is supported and conducted in collaboration with Jackson State University (HHSN268201800013I), Tougaloo College (HHSN268201800014I), the Mississippi State Department of Health (HHSN268201800015I), and the University of Mississippi Medical Center (HHSN268201800010I, HHSN268201800011I, and HHSN268201800012I) contracts from the National Heart, Lung, and Blood Institute (NHLBI) and the National Institute on Minority Health and Health Disparities (NIMHD). Dr. Rebholz is supported by a mentored research scientist development award from the National Institute of Diabetes and Digestive and Kidney Diseases (K01 DK107782) and grants from the National Heart, Lung, and Blood Institute (R21 HL143089, R56 HL153178). Dr. Colantonio receives research support from Amgen, Inc., unrelated to the current study.
Abbreviations:
- AASK
African-American Study of Kidney Disease and Hypertension
- CI
confidence interval
- DASH
Dietary Approaches to Stop Hypertension
- Delta NIRI
Lower Mississippi Delta Nutrition Intervention Research Initiative
- eGFR
estimated glomerular filtration rate
- FDR
false discovery rate
- FFQ
food frequency questionnaire
- GED
general education development
- HILIC
hydrophilic interaction liquid chromatography
- IPA
indole-3-propanoic acid
- JHS
Jackson Heart Study
- LC
liquid chromatography
- LPC
lysophosphatidylcholine
- LPE
lysophosphatidylethanolamine
- MDRD
Modification of Diet in Renal Disease study
- MRM
multiple reaction monitoring
- MS
mass spectrometry
- NHLBI
National Heart, Lung, and Blood Institute
- NIMHD
National Institute on Minority Health and Health Disparities
- PCA
principal components analysis
- PE
phosphatidylethanolamine
- REGARDS
Reasons for Geographic and Racial Differences in Stroke
Footnotes
CONFLICT OF INTEREST
The authors have no conflicts of interest to declare.
REFERENCES
- [1].Mozaffarian D, Appel LJ, Van Horn L, Circulation. 2011, 123, 2870–2891. [DOI] [PMC free article] [PubMed] [Google Scholar]
- [2].Micha R, Penalvo JL, Cudhea F, Imamura F, Rehm CD, Mozaffarian D, JAMA : the journal of the American Medical Association. 2017, 317, 912–924. [DOI] [PMC free article] [PubMed] [Google Scholar]
- [3].Shikany JM, Safford MM, Newby PK, Durant RW, Brown TM, Judd SE, Circulation. 2015, 132, 804–814. [DOI] [PMC free article] [PubMed] [Google Scholar]
- [4].Howard G, Cushman M, Moy CS, Oparil S, Muntner P, Lackland DT, Manly JJ, Flaherty ML, Judd SE, Wadley VG, Long DL, Howard VJ, JAMA : the journal of the American Medical Association. 2018, 320, 1338–1348. [DOI] [PMC free article] [PubMed] [Google Scholar]
- [5].Freedman LS, Schatzkin A, Midthune D, Kipnis V, Journal of the National Cancer Institute. 2011, 103, 1086–1092. [DOI] [PMC free article] [PubMed] [Google Scholar]
- [6].Kipnis V, Midthune D, Freedman L, Bingham S, Day NE, Riboli E, Ferrari P, Carroll RJ, Public health nutrition. 2002, 5, 915–923. [DOI] [PubMed] [Google Scholar]
- [7].Bingham SA, J Nutr. 2003, 133 Suppl 3, 921S–924S. [DOI] [PubMed] [Google Scholar]
- [8].Hu FB, Curr Opin Lipidol. 2002, 13, 3–9. [DOI] [PubMed] [Google Scholar]
- [9].US Department of Agriculture and US Department of Health and Human Services. Dietary Guidelines for Americans, 2015–2020. (U.S. Government Printing Office, Washington, DC, 2015). [Google Scholar]
- [10].Hedrick VE, Dietrich AM, Estabrooks PA, Savla J, Serrano E, Davy BM, Nutrition journal. 2012, 11, 109. [DOI] [PMC free article] [PubMed] [Google Scholar]
- [11].Jenab M, Slimani N, Bictash M, Ferrari P, Bingham SA, Human genetics. 2009, 125, 507–525. [DOI] [PubMed] [Google Scholar]
- [12].Kim H, Lichtenstein AH, Wong KE, Appel LJ, Coresh J, Rebholz CM, Mol Nutr Food Res. 2020, e2000695. [DOI] [PMC free article] [PubMed] [Google Scholar]
- [13].Kim H, Hu EA, K EW, Yu B, Steffen LM, Seidelmann SB, Boerwinkle E, Coresh J, Rebholz CM, J Nutr. 2021, 151, 40–49. [DOI] [PMC free article] [PubMed] [Google Scholar]
- [14].Rebholz CM, Lichtenstein AH, Zheng Z, Appel LJ, Coresh J, The American journal of clinical nutrition. 2018. [DOI] [PMC free article] [PubMed] [Google Scholar]
- [15].Bagheri M, Willett W, Townsend MK, Kraft P, Ivey KL, Rimm EB, Wilson KM, Costenbader KH, Karlson EW, Poole EM, Zeleznik OA, Eliassen AH, The American journal of clinical nutrition. 2020, 112, 1613–1630. [DOI] [PMC free article] [PubMed] [Google Scholar]
- [16].McCullough ML, Maliniak ML, Stevens VL, Carter BD, Hodge RA, Wang Y, The American journal of clinical nutrition. 2019, 109, 1439–1451. [DOI] [PubMed] [Google Scholar]
- [17].Tzoulaki I, Ebbels TM, Valdes A, Elliott P, Ioannidis JP, American journal of epidemiology. 2014, 180, 129–139. [DOI] [PubMed] [Google Scholar]
- [18].Guasch-Ferre M, Bhupathiraju SN, Hu FB, Clinical chemistry. 2018, 64, 82–98. [DOI] [PMC free article] [PubMed] [Google Scholar]
- [19].Mahieu NG, Patti GJ, Anal Chem. 2017, 89, 10397–10406. [DOI] [PMC free article] [PubMed] [Google Scholar]
- [20].Schrimpe-Rutledge AC, Codreanu SG, Sherrod SD, McLean JA, J Am Soc Mass Spectrom. 2016, 27, 1897–1905. [DOI] [PMC free article] [PubMed] [Google Scholar]
- [21].Taylor HA, Ethnic Dis. 2005, 15, S1–S3. [Google Scholar]
- [22].Taylor HA Jr., Ethn Dis. 2012, 22, S1–49-54. [PubMed] [Google Scholar]
- [23].Jones BL, Vyhlidal CA, Bradley-Ewing A, Sherman A, Goggin K, J Racial Ethn Health Disparities. 2017, 4, 735–745. [DOI] [PubMed] [Google Scholar]
- [24].Talegawkar SA, Johnson EJ, Carithers TC, Taylor HA Jr., Bogle ML, Tucker KL, Journal of the American Dietetic Association. 2008, 108, 2013–2020. [DOI] [PMC free article] [PubMed] [Google Scholar]
- [25].Carithers T, Dubbert PM, Crook E, Davy B, Wyatt SB, Bogle ML, Taylor HA Jr., Tucker KL, Ethn Dis. 2005, 15, S6–49-55. [PubMed] [Google Scholar]
- [26].O’Sullivan JF, Morningstar JE, Yang Q, Zheng B, Gao Y, Jeanfavre S, Scott J, Fernandez C, Zheng H, O’Connor S, Cohen P, Vasan RS, Long MT, Wilson JG, Melander O, Wang TJ, Fox C, Peterson RT, Clish CB, Corey KE, Gerszten RE, The Journal of clinical investigation. 2017, 127, 4394–4402. [DOI] [PMC free article] [PubMed] [Google Scholar]
- [27].Kimberly WT, O’Sullivan JF, Nath AK, Keyes M, Shi X, Larson MG, Yang Q, Long MT, Vasan R, Peterson RT, Wang TJ, Corey KE, Gerszten RE, JCI insight. 2017, 2. [DOI] [PMC free article] [PubMed] [Google Scholar]
- [28].Mayers JR, Wu C, Clish CB, Kraft P, Torrence ME, Fiske BP, Yuan C, Bao Y, Townsend MK, Tworoger SS, Davidson SM, Papagiannakopoulos T, Yang A, Dayton TL, Ogino S, Stampfer MJ, Giovannucci EL, Qian ZR, Rubinson DA, Ma J, Sesso HD, Gaziano JM, Cochrane BB, Liu S, Wactawski-Wende J, Manson JE, Pollak MN, Kimmelman AC, Souza A, Pierce K, Wang TJ, Gerszten RE, Fuchs CS, Vander Heiden MG, Wolpin BM, Nature medicine. 2014, 20, 1193–1198. [DOI] [PMC free article] [PubMed] [Google Scholar]
- [29].Servillo L, Giovane A, Balestrieri ML, Cautela D, Castaldo D, J Agric Food Chem. 2011, 59, 274–281. [DOI] [PubMed] [Google Scholar]
- [30].Atkinson W, Downer P, Lever M, Chambers ST, George PM, Eur J Nutr. 2007, 46, 446–452. [DOI] [PubMed] [Google Scholar]
- [31].Rebholz CM, Lichtenstein AH, Zheng Z, Appel LJ, Coresh J, The American journal of clinical nutrition. 2018, 108, 243–255. [DOI] [PMC free article] [PubMed] [Google Scholar]
- [32].Chambers ST, Kunin CM, The Journal of clinical investigation. 1987, 79, 731–737. [DOI] [PMC free article] [PubMed] [Google Scholar]
- [33].Wikoff WR, Anfora AT, Liu J, Schultz PG, Lesley SA, Peters EC, Siuzdak G, Proc Natl Acad Sci U S A. 2009, 106, 3698–3703. [DOI] [PMC free article] [PubMed] [Google Scholar]
- [34].Menni C, Hernandez MM, Vital M, Mohney RP, Spector TD, Valdes AM, Gut microbes. 2019, 10, 688–695. [DOI] [PMC free article] [PubMed] [Google Scholar]
- [35].Konopelski P, Konop M, Gawrys-Kopczynska M, Podsadni P, Szczepanska A, Ufnal M, Nutrients. 2019, 11. [DOI] [PMC free article] [PubMed] [Google Scholar]
- [36].Tuomainen M, Lindstrom J, Lehtonen M, Auriola S, Pihlajamaki J, Peltonen M, Tuomilehto J, Uusitupa M, de Mello VD, Hanhineva K, Nutrition & diabetes. 2018, 8, 35. [DOI] [PMC free article] [PubMed] [Google Scholar]
- [37].Hardeland R, Zsizsik BK, Poeggeler B, Fuhrberg B, Holst S, Coto-Montes A, Advances in experimental medicine and biology. 1999, 467, 389–395. [DOI] [PubMed] [Google Scholar]
- [38].Yisireyili M, Takeshita K, Saito S, Murohara T, Niwa T, Nagoya journal of medical science. 2017, 79, 477–486. [DOI] [PMC free article] [PubMed] [Google Scholar]
- [39].Rebholz CM, Coresh J, Grams ME, Steffen LM, Anderson CA, Appel LJ, Crews DC, American journal of nephrology. 2015, 42, 427–435. [DOI] [PMC free article] [PubMed] [Google Scholar]
- [40].Rebholz CM, Surapaneni A, Levey AS, Sarnak MJ, Inker LA, Appel LJ, Coresh J, Grams ME, J Nutr. 2019, 149, 578–585. [DOI] [PMC free article] [PubMed] [Google Scholar]
- [41].Wang ML, Khera P, Pandey MK, Wang H, Qiao L, Feng S, Tonnis B, Barkley NA, Pinnow D, Holbrook CC, Culbreath AK, Varshney RK, Guo B, PloS one. 2015, 10, e0119454. [DOI] [PMC free article] [PubMed] [Google Scholar]
- [42].Yamashita S, Kanno S, Honjo A, Otoki Y, Nakagawa K, Kinoshita M, Miyazawa T, Lipids. 2016, 51, 199–210. [DOI] [PubMed] [Google Scholar]
- [43].Messias MCF, Mecatti GC, Priolli DG, Carvalho PD, Lipids Health Dis. 2018, 17. [DOI] [PMC free article] [PubMed] [Google Scholar]
- [44].Wu Y, Chen Z, Darwish WS, Terada K, Chiba H, Hui SP, J Agric Food Chem. 2019, 67, 7716–7725. [DOI] [PubMed] [Google Scholar]
- [45].Stoilov I, Starcher BC, Mecham RP, Broekelmann TJ, Methods in cell biology. 2018, 143, 133–146. [DOI] [PubMed] [Google Scholar]
- [46].Ross AB, Svelander C, Undeland I, Pinto R, Sandberg AS, J Nutr. 2015, 145, 2456–2463. [DOI] [PubMed] [Google Scholar]
- [47].Pallister T, Jennings A, Mohney RP, Yarand D, Mangino M, Cassidy A, MacGregor A, Spector TD, Menni C, PloS one. 2016, 11, e0158568. [DOI] [PMC free article] [PubMed] [Google Scholar]
- [48].Massadeh AM, Gharaibeh AA, Omari KW, J Chromatogr Sci. 2009, 47, 170–177. [DOI] [PubMed] [Google Scholar]
- [49].Rybak ME, Sternberg MR, Pao CI, Ahluwalia N, Pfeiffer CM, J Nutr. 2015, 145, 766–774. [DOI] [PMC free article] [PubMed] [Google Scholar]
- [50].Farag KM, Palta JP, Physiol Plantarum. 1993, 87, 515–521. [Google Scholar]
- [51].Ryu SB, Karlsson BH, Ozgen M, Palta JP, Proc Natl Acad Sci U S A. 1997, 94, 12717–12721. [DOI] [PMC free article] [PubMed] [Google Scholar]
- [52].Cowan AK, Plant signaling & behavior. 2009, 4, 324–327. [DOI] [PMC free article] [PubMed] [Google Scholar]
- [53].Cholewski M, Tomczykowa M, Tomczyk M, Nutrients. 2018, 10. [DOI] [PMC free article] [PubMed] [Google Scholar]
Associated Data
This section collects any data citations, data availability statements, or supplementary materials included in this article.