Abstract
Obesity has been followed with interest as a risk factor for COVID-19, with triglycerides as one of four common criteria used to define obesity, which have been used to study the mechanism of obesity. In this study, we showed that angiotensin-converting enzyme-2 (ACE2) is widely expressed in the mouse body, including the kidney, spleen, brain, heart, lung, liver, and testis, and that ACE2 levels increased after a high-fat diet. The ACE2 levels were recorded at 0 days, 3 days, 7 days, and 14 days after a high-fat diet, and they increased at 14 days after high-fat diet initiation. In addition, triglyceride levels were also significantly increased at 14 days after high-fat diet initiation, but body weight was not changed. Furthermore, we examined the ACE2 levels in Calu3 cells (a lung cancer cell line) after triglyceride treatment, and the results indicated that ACE2 levels were increased at 25 μM and reached their peak at 200 μM. Finally, we found that the mRNA level of mthfd1 was significantly increased in the high-fat diet group. Given these findings, we hypothesize that triglycerides can regulate the expression of ACE2 and Mthfd1.
Keywords: Triglyceride, COVID-19, Obesity, ACE2, Mthfd1
Introduction
The COVID-19 pandemic is bringing public health to the forefront, and it is thought to be related to the SARS virus. Currently, more than 5 million people have contracted COVID-19, and cumulative deaths exceed 340,000 (WHO Coronavirus Disease (COVID-19) Dashboard, published 24 May 2020). There are many risk factors for virus infection, and an increasing number of studies have found that obesity is one of the major risk factors for COVID-19 (Kassir 2020; Lighter et al. 2020; Zhang et al. 2020).
Triglycerides (TGs) are mainly synthesized in the liver and adipose tissue, often as biomarkers for obesity. Following an increasing number of studies, TGs have been reported to play an important role in many diseases, including those in various tissues and organs, such as the brain(Croteau et al. 2018), heart (Goldberg 2018), liver (Alves-Bezerra and Cohen 2017), lung (Zuber et al. 2016), kidney (Bobulescu et al. 2014), spleen (Portois et al. 2007), and testis (Wang et al. 2019). We know that SARS-CoV-2 not only causes lung injury but also causes complications in most other organs, and additional studies have found that obesity increases the mortality of infected people and serves as one of the risks of viral infection (Jose and Manuel 2020; Peng et al. 2020; Simonnet et al. 2020; Zheng et al. 2020). Thus, we hypothesize that TGs may be involved in these processes, which will contribute to research on the mechanism of the novel coronavirus.
Angiotensin-converting enzyme-2 (ACE2) receptors are widely expressed in the heart, vessels, gut, lung, testis, and brain and are also present in lung alveolar epithelial cells, small intestine enterocytes, arterial and venous endothelial cells and arterial smooth muscle cells (Harmer et al. 2002; Hamming et al. 2004). The ACE2 structure includes an N-terminal and a C-terminal domain with a single transmembrane helix and an intracellular segment (Ye et al. 2017). The pathological function of ACE2 is to mediate entry into the cells of some coronaviruses (Verdecchia et al. 2020). Recently, ACE2 receptors have been shown to be functional receptors for SARS-CoV-2 to enter host target cells (Kai and Kai 2020). SARS-CoV-2, through the viral structural spike (S) protein, binds to the ACE2 receptor to target cells (Sanders, Monogue et al. 2020). The mechanism is that SARS-CoV-2 attaches to cells through ACE2. Then, the type II transmembrane protease serine 2 (TMPRSS2) processes SARS‑CoV‑2‑S to expose a cell‑membrane fusion peptide. Once membrane fusion occurs, viral RNA is released into the infected host cell and begins viral replication (Nitulescu et al. 2020). Currently, it has been proposed that inhibiting this interaction might be used in treating patients with COVID-19 (Jackson et al. 2020). In this study, we will study the relationship between triglycerides and ACE2 in mice and cells to explain the specific mechanism by which obesity leads to increased viral infections.
Materials and methods
Animals and cells
Male C57BL/6 mice were purchased from SLAC Company (Shanghai, China) in this study. All procedures performed in these studies involving animals were in accordance with the ethical standards of the University Committee on Animal Care of Soochow University and the Guidelines of Animal Use and Care of the National Institutes of Health (NIH). The number and date for ethical approval was 202005A033. Calu3 cells (ATCC: HTB-55) were purchased from FuHeng BioLogy Company (Shanghai, China).
Western blot analysis
After high-fat diet consumption, the whole lungs of mice were collected, ground in liquid nitrogen and stored at −80°C. Approximately 100 mg of tissue was added to 200 µl of lysis buffer for 30 min on ice and centrifuged for 30 min at 4°C and 16,000 ×g. The supernatants were mixed with loading buffer and boiled for 10 min at 96°C for Western blot analysis after cooling. Approximately 30 μg samples were separated by sodium dodecyl sulfate-polyacrylamide gel electrophoresis and then transferred to nitrocellulose membranes. Membranes were blocked, incubated with the primary antibody, incubated with the secondary antibody, and then developed. The densitometry of the bands was analysed with Alpha Ease Image Analysis Software V3.1.2. Anti-ACE2 (CY5787) antibodies were purchased from Abways Technology Company (Shanghai, China); mouse monoclonal anti-Actin (ER62585) antibodies were purchased from HUABIO Company (Hangzhou, China).
Reverse transcription polymerase chain reaction
Total RNA was extracted from lung tissues. Reverse transcription of cDNA was conducted with SYBR green for reverse transcription PCR (RT-PCR). GAPDH (forward: CATGGCCTTCCGTGTTCCTA; reverse: CTTCACCACCTTCTTGATGTCATC) was used as a control. Mthfd1 (forward: AGAGGGCGAGCTTTATCACG; reverse: CCAGGTTCCCGATGAGCTTT) was detected.
Cell viability and triglyceride detection
Cell viability was detected by a CCK8 Assay Kit (CK04, DOJINDO Co., Ltd., Shanghai, China) in a 96-well cell culture plate, 10 µl per well was added, and the OD value was measured after 2 h. Serum triglycerides (TGs) in mice were measured by using a Triglyceride Colorimetric Assay Kit (E-BC-K261-M, Elabscience Biotechnology Co., Ltd., Wuhan, China) according to the manufacturer’s instructions.
Statistical analysis
All data are expressed as the means ± SEMs. GraphPad Prism 6 (GraphPad Software Inc., La Jolla, CA, USA) was used for statistical analysis. In figure 3E Student’s t-test was used to determine the differences. In figure 2A, B, and D one-way analysis to compare differences was used. P<0.05 was considered statistically significant.
Figure 3.
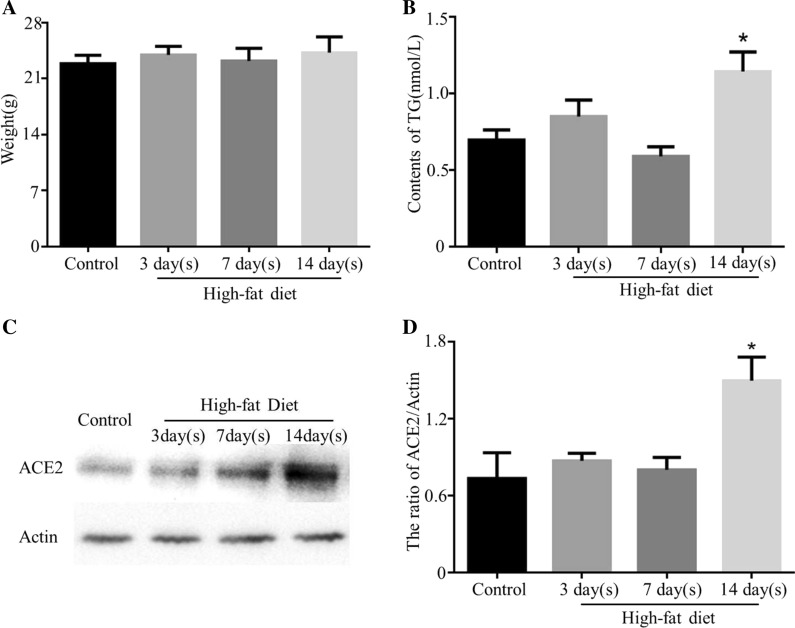
The levels of ACE2 in mouse lung tissue after the high-fat diet. Mice were fed with high-fat diet 3 days, 7 days, and 14 days, the control group was feed with Normal diet. The weight of mice was examined after high-fat diet. The representative photograph (A). The concentration of TG was tested after High-fat Diet. Representative photograph (B). ACE2 levels were evaluated according to Western blot (C) and the quantitative analysis was performed on the ratio of ACE2 to Actin (D). Mean with SEM, N=6, *P<0.05, versus the control group.
Figure 2.
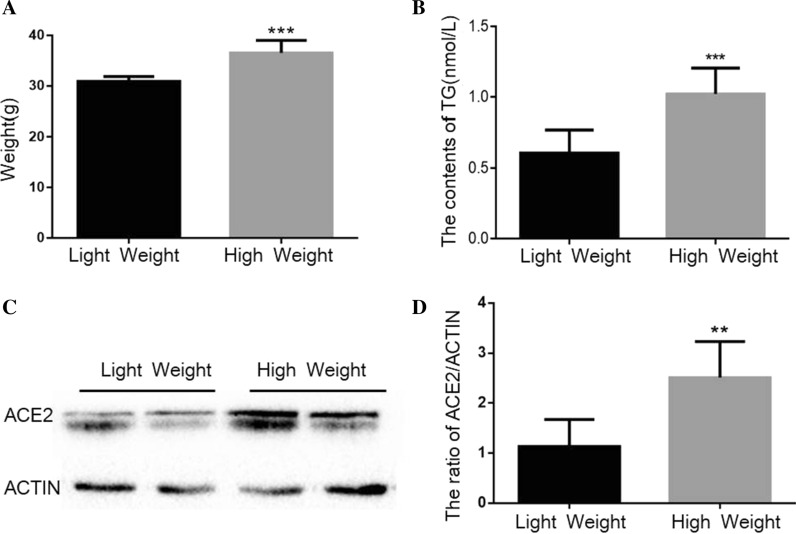
The levels of TG and ACE2 in fat mouse. The same age mice were divided two groups, high weight and light weight. Weight of mice (A). The triglyceride concentration was detected by ELISA kit in mouse serum (B). ACE2 levels were determined by Western blot (C). Quantitative analysis of ACE2 levels was performed (D). Mean with SEM, N=6, *P<0.05, versus the light weight group.
Results
Levels of ACE2 in mouse tissues
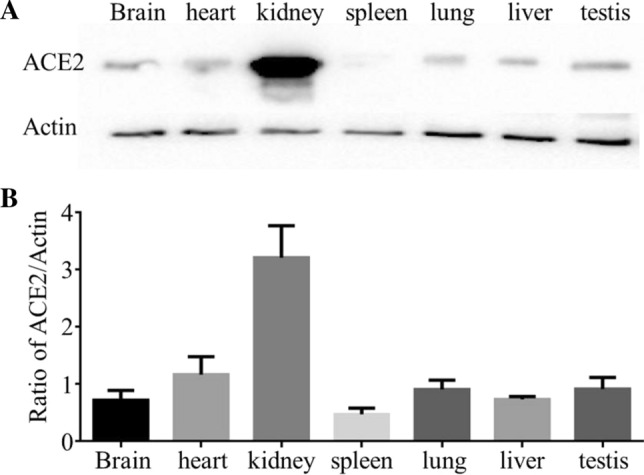
Previous studies reported that ACE2 exists in various tissues and cells (Hamming et al. 2004), and we examined the distribution of ACE2 in different tissues of mice by Western blot. We found that ACE2 was highly expressed in the kidney and lowly in the spleen (figure 1A); there was a similar expression level in the brain, heart, lung, liver, and testis (figure 1A). Quantitative analysis confirmed the expression of ACE2 in different tissues (figure 1B).
Figure 1.

The distribution of ACE2 in mouse tissue. ACE2 levels were determined by Western blot in different tissue of mice. The representative photographs showed ACE2; Actin was used as a loading control (A). The quantitative analysis was performed on the ratio of ACE2 to Actin (B), mean with SEM, N=3.
Levels of ACE2 in mouse lung tissue in fat mice
To reveal the relationship between obesity and ACE2 protein, we selected 12 mice of the same age, and they were divided two groups, high weight and light weight. We tested the TG concentration in the different mice serum, and then took the lung tissue to test the expression of ACE2. The results showed that higher TG concentration in high weight mice (figure 2B), and the expression of ACE2 was also significantly increased in high weight mice (figure 2C and 2D).
To further prove the relationship between TG and ACE2,we established an obese mouse model by using a high-fat diet (60% fat) to feed mice and monitored body weight and triglycerides at 3, 7 and 14 days after the high-fat diet initiation. Although body weight did not change after the high-fat diet (P=0.1218, figure 3A), serum triglyceride levels significantly increased at 14 days after high-fat diet initiation (P=0.0145, figure 3B). To study the relationship between serum triglycerides and ACE2, we recorded ACE2 levels at 0 days, 3 days, 7 days, and 14 days after high-fat diet initiation. ACE2 expression increased at 14 days after high-fat diet initiation (figure 3C-DAYS). These results suggest that triglycerides may be an important factor in regulating the expression of ACE2.
Levels of ACE2 in Calu3 cells after triglyceride treatment
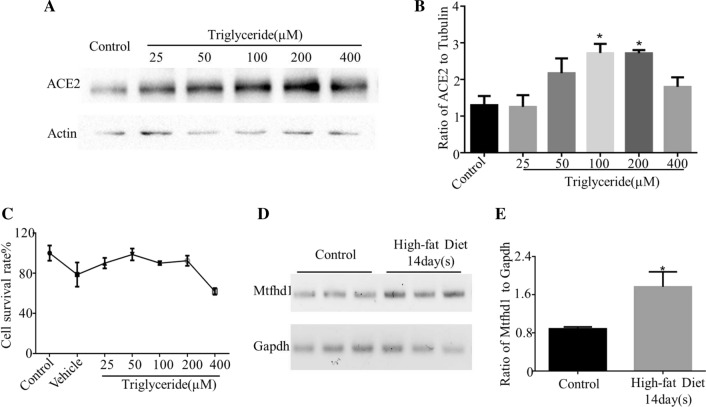
To further prove that the expression of ACE2 was regulated by serum triglycerides, we examined ACE2 levels in Calu3 cells, a lung cancer cell line, after TG treatment. We treated cells with TGs (25 μM, 50 μM, 100 μM, 200 μM, and 400 μM) and cultured them for 48 hours in an incubator (37 °C, 5% CO2). First, we detected the expression of ACE2 by Western blot. The results showed that ACE2 levels increased at 25 μM and reached their peak at 200 μM TG (figures 4A and 3B). Then, a CCK8 Assay Kit was used to test the activity of the cells after TG treatment. The results showed that a low concentration of TGs did not affect cell survival (figure 4C).
Figure 4.
The levels of ACE2 in Calu3 cell after triglyceride treatment and the mRNA levels of Mtfhd1 in mouse lung tissue after high-fat diet. Calu3 cells were administered with TG (25, 50, 100, 200, and 400 μM) 48 h, ACE2 levels were determined by Western blot (A). Quantitative analysis of ACE2 levels was performed (B). The cell survival rate was showed after TG treatment (C). The mRNA level of Mtfhd1 was detected by RT-PCR in fat mice (with high-fat diet 14 days). The representative photograph was shown (D) and the quantitative analysis was performed on the ratio of Mtfhd1 to Gapdh (E). Mean with SEM, N=6, *P<0.05, versus the control group.
mRNA levels of Mthfd1 in mouse lung tissue after a high-fat diet
Previous studies indicate that methylenetetrahydrofolate dehydrogenase (MTHFD1) is a protein that affects immune function and obesity (Christensen et al. 2014; Vohra et al. 2020). To explore the mechanism by which TG leads to increased ACE2, we examined the expression of MTHFD1 by RT-PCR in mice after a high-fat diet. We extracted RNA from mouse lung tissue and detected the level of the mthfd1 gene. As shown in figure 4D, the mRNA level of mthfd1 was significantly increased in mice fed a high-fat diet compared with that in control mice. The statistical analysis is shown in figure 4E (p<0.05).
Discussion
Obesity has become a worldwide health concern because it increases the risk of some diseases (Wang et al. 2011). Scientists predict that 86% of adults will be overweight or obese in the USA by 2030 (Ginter and Simko 2014). At present, the number of COVID-19 viral infections is approximately 160 million people, and the number of deaths is over 3300,000 worldwide; the United States has the largest number of infections, which may be related to its high obesity rate. Most studies have confirmed that obesity can aggravate the condition of COVID-19 patients and increase the fatality rate (Finer et al. 2020; Kassir 2020; Stefan et al. 2020). Metabolically healthy obese (MHO) sets four common criteria used to define obesity, including blood pressure, HDL cholesterol, triglycerides, and plasma glucose (Bergman et al. 2011). Hypertriglyceridemia is the most prevalent metabolic change in obesity (Guijarro de Armas et al. 2012). Our results showed that the concentration of TGs was significantly increased in high weight mice (figure 2B) and high-fat diet (figure 3B), in accordance with the symptoms of obesity, although the body weight of mice did not change (figure 3A). Gillian et al. (Rice et al. 2006) showed a correlation between ACE2 and triglyceride levels, and our results confirmed that high triglycerides can cause ACE2, a protein that promotes the entry of viruses into cells, to be significantly increased in animal experiments (Figures 2C and 3C). In addition, ACE2 levels were significantly increased in Calu3 cells compared with those in control cells after TG treatment (figure 4A). Our results suggested that more serious illness may be caused by increased expression of ACE2 in high-triglyceride people with COVID-19.
ACE2 consists of an 805 amino acid type I transmembrane glycoprotein and contains a short intracellular cytoplasmic tail and a longer extracellular domain (Lambert et al. 2010). ACE2 was reported to be a potential receptor in infections with severe acute respiratory syndrome coronavirus (SARS-CoV) in 2003 (Li et al. 2003; Peiris et al. 2003). The mechanism is that SARS infections are initiated by the binding of the spike protein trimers of SARS-CoV to a hydrophobic pocket of the extracellular catalytic domain of ACE2 (Li et al. 2005). The novel coronavirus is a type of coronavirus that also plays an important role. Methylenetetrahydrofolate dehydrogenase 1 (MTHFD1) is a pivotal enzyme in the folic acid metabolic pathway. It can regulate nucleotide formation and DNA methylation. The average global DNA methylation was reduced by 40% in the mthfd1 mutant phenotype compared with that in the WT, and MTHFD1 is required for epigenetic silencing (Groth et al. 2016). Obesity may also induce alterations in DNA methylation signatures in offspring (Samblas et al. 2019), and saturated fatty acids induce some gene hypermethylation, increasing or decreasing the expression of these genes (Flores-Sierra et al. 2016). In our studies, we found that the mRNA level of Mthfd1 was significantly increased after the high-fat diet (figure 4D), and we hypothesize that triglycerides regulate the expression of ACE2 through Mthfd1 and influence DNA methylation. Notably, this hypothesis needs additional experimental research to confirm. In the future, we will examine the transcription and protein expression levels of ACE2 after overexpression and knockout of MTHFD1 in cells, and clarify the relationship between ACE2 and Mthfd1. According to previous studies, we know that both triglycerides (Yu et al. 2018) and mthfd1 (Groth et al. 2016) are related to DNA methylation, we will test the levels of DNA methylation after used ACE2 inhibitors or Mthfd1 inhibitors under the TG treatment, to conform that TG regulates the expression of Ace2 through Mthfd1 affects the methylation levels of Ace2 gene.
In summary, we showed that the expression of ACE2 is closely related to the triglyceride content. In-depth studies have found that triglycerides can regulate the expression of Mthfd1, and previous studies have reported that Mthfd1 can affect DNA methylation. Therefore, we speculate that triglycerides can affect the expression of mthfd1 and regulate the ACE2 protein level by affecting the methylation of the Ace2 gene.
Acknowledgements
This study was supported by the grants the National Natural Science Foundation of China (81601154), Science and Technology to people’s livelihood Program of Suzhou (Grant no. sys2018012), Jiangsu Key Laboratory of Neuropsychiatric Diseases (BM2013003) and the Priority Academic Program Development of Jiangsu Higher Education Institutions of China.
Footnotes
Xiaohua Ma and Xiaojing Li are Co-first authors.
Corresponding editor: B J Rao
Contributor Information
Bo Wan, Email: bowan@fudan.edu.cn.
Zhigang Miao, Email: zgmiao@suda.edu.cn.
References
- Alves-Bezerra M, Cohen DE. Triglyceride metabolism in the liver. Compr. Physiol. 2017;8:1–8. doi: 10.1002/cphy.c170012. [DOI] [PMC free article] [PubMed] [Google Scholar]
- Bergman RN, Stefanovski D, Buchanan TA, Sumner AE, Reynolds JC, et al. A better index of body adiposity. Obesity. 2011;19:1083–1089. doi: 10.1038/oby.2011.38. [DOI] [PMC free article] [PubMed] [Google Scholar]
- Bobulescu IA, Lotan Y, Zhang J, Rosenthal TR, Rogers JT, et al. Triglycerides in the human kidney cortex: relationship with body size. PLoS One. 2014;9:e101285. doi: 10.1371/journal.pone.0101285. [DOI] [PMC free article] [PubMed] [Google Scholar]
- Christensen KE, Dahhou M, Kramer MS, Rozen R. The MTHFD1 1958G>A variant is associated with elevated C-reactive protein and body mass index in Canadian women from a premature birth cohort. Mol. Genet. Metab. 2014;111:390–392. doi: 10.1016/j.ymgme.2013.12.004. [DOI] [PubMed] [Google Scholar]
- Croteau E, Castellano CA, Richard MA, Fortier M, Nugent S, et al. Ketogenic medium chain triglycerides increase brain energy metabolism in Alzheimer's disease. J. Alzheimers Dis. 2018;64:551–561. doi: 10.3233/JAD-180202. [DOI] [PubMed] [Google Scholar]
- Finer N, Garnett SP, Bruun JM. COVID-19 and obesity. Clin. Obes. 2020;10:e12365. doi: 10.1111/cob.12365. [DOI] [PMC free article] [PubMed] [Google Scholar]
- Flores-Sierra J, Arredondo-Guerrero M, Cervantes-Paz B, Rodriguez-Rios D, Alvarado-Caudillo Y, et al. The trans fatty acid elaidate affects the global DNA methylation profile of cultured cells and in vivo. Lipids Health Dis. 2016;15:75. doi: 10.1186/s12944-016-0243-2. [DOI] [PMC free article] [PubMed] [Google Scholar]
- Ginter E, Simko V. Becoming overweight: is there a health risk? Bratisl. Lek. Listy. 2014;115:527–531. doi: 10.4149/bll_2014_102. [DOI] [PubMed] [Google Scholar]
- Goldberg IJ. 2017 George Lyman Duff Memorial Lecture: Fat in the blood, fat in the artery, fat in the heart: triglyceride in physiology and disease. Arterioscler. Thromb. Vasc. Biol. 2018;38:700–706. doi: 10.1161/ATVBAHA.117.309666. [DOI] [PMC free article] [PubMed] [Google Scholar]
- Groth M, Moissiard G, Wirtz M, Wang H, Garcia-Salinas C, et al. MTHFD1 controls DNA methylation in Arabidopsis. Nat. Commun. 2016;7:11640. doi: 10.1038/ncomms11640. [DOI] [PMC free article] [PubMed] [Google Scholar]
- Guijarro de Armas MA, Monereo Megias S, Merino Viveros M, Iglesias Bolanos P, Vega Pinero B. Prevalence of metabolic syndrome in a population of obese children and adolescents. Endocrinol. Nutr. 2012;59:155–159. doi: 10.1016/j.endonu.2012.01.003. [DOI] [PubMed] [Google Scholar]
- Hamming I, Timens W, Bulthuis ML, Lely AT, Navis G, et al. Tissue distribution of ACE2 protein, the functional receptor for SARS coronavirus. A first step in understanding SARS pathogenesis. J. Pathol. 2004;203:631–637. doi: 10.1002/path.1570. [DOI] [PMC free article] [PubMed] [Google Scholar]
- Harmer D, Gilbert M, Borman R, Clark KL. Quantitative mRNA expression profiling of ACE 2, a novel homologue of angiotensin converting enzyme. FEBS Lett. 2002;532:107–110. doi: 10.1016/S0014-5793(02)03640-2. [DOI] [PubMed] [Google Scholar]
- Jackson DJ, Busse WW, Bacharier LB, Kattan M, O'Connor GT, et al. Association of respiratory allergy, asthma and expression of the SARS-CoV-2 receptor, ACE2. J. Allergy Clin. Immunol. 2020 doi: 10.1016/j.jaci.2020.04.009. [DOI] [PMC free article] [PubMed] [Google Scholar]
- Jose RJ, Manuel A. Does COVID-19 Disprove the Obesity Paradox in ARDS? Obesity. 2020 doi: 10.1002/oby.22835. [DOI] [PMC free article] [PubMed] [Google Scholar]
- Kai H, Kai M. Interactions of coronaviruses with ACE2, angiotensin II, and RAS inhibitors-lessons from available evidence and insights into COVID-19. Hypertens Res. 2020 doi: 10.1038/s41440-020-0455-8. [DOI] [PMC free article] [PubMed] [Google Scholar]
- Kassir R. Risk of COVID-19 for patients with obesity. Obes. Rev. 2020;21:e13034. doi: 10.1111/obr.13034. [DOI] [PMC free article] [PubMed] [Google Scholar]
- Lambert DW, Clarke NE, Turner AJ. Not just angiotensinases: new roles for the angiotensin-converting enzymes. Cell Mol. Life Sci. 2010;67:89–98. doi: 10.1007/s00018-009-0152-x. [DOI] [PMC free article] [PubMed] [Google Scholar]
- Li F, Li WH, Farzan M, Harrison SC. Structure of SARS coronavirus spike receptor-binding domain complexed with receptor. Science. 2005;309:1864–1868. doi: 10.1126/science.1116480. [DOI] [PubMed] [Google Scholar]
- Li WH, Moore MJ, Vasilieva N, Sui JH, Wong SK, et al. Angiotensin-converting enzyme 2 is a functional receptor for the SARS coronavirus. Nature. 2003;426:450–454. doi: 10.1038/nature02145. [DOI] [PMC free article] [PubMed] [Google Scholar]
- Lighter J, Phillips M, Hochman S, Sterling S, Johnson D et al. 2020 Obesity in patients younger than 60 years is a risk factor for Covid-19 hospital admission. Clin. Infect. Dis.10.1093/cid/ciaa415 [DOI] [PMC free article] [PubMed]
- Nitulescu GM, Paunescu H, Moschos SA, Petrakis D, Nitulescu G, et al. Comprehensive analysis of drugs to treat SARSCoV2 infection: Mechanistic insights into current COVID19 therapies. Int. J. Mol. Med. 2020;46:467–488. doi: 10.3892/ijmm.2020.4608. [DOI] [PMC free article] [PubMed] [Google Scholar]
- Peiris JS, Yuen KY, Osterhaus AD, Stohr K. The severe acute respiratory syndrome. N Engl J Med. 2003;349:2431–2441. doi: 10.1056/NEJMra032498. [DOI] [PubMed] [Google Scholar]
- Peng YD, Meng K, Guan HQ, Leng L, Zhu RR, et al. Clinical characteristics and outcomes of 112 cardiovascular disease patients infected by 2019-nCoV. Zhonghua Xin Xue Guan Bing Za Zhi. 2020;48:E004. doi: 10.3760/cma.j.cn112148-20200220-00105. [DOI] [PubMed] [Google Scholar]
- Portois L, Sener A, Carpentier YA, Malaisse WJ. Fatty acid content and pattern of spleen phospholipids and triglycerides in normal and either type-1 or type-2 diabetic rats. Int. J. Mol. Med. 2007;19:523–528. [PubMed] [Google Scholar]
- Rice GI, Jones AL, Grant PJ, Carter AM, Turner AJ, et al. Circulating activities of angiotensin-converting enzyme, its homolog, angiotensin-converting enzyme 2, and neprilysin in a family study. Hypertension. 2006;48:914–920. doi: 10.1161/01.HYP.0000244543.91937.79. [DOI] [PubMed] [Google Scholar]
- Samblas M, Milagro FI, Martinez A. DNA methylation markers in obesity, metabolic syndrome, and weight loss. Epigenetics. 2019;14:421–444. doi: 10.1080/15592294.2019.1595297. [DOI] [PMC free article] [PubMed] [Google Scholar]
- Sanders JM, Monogue ML, Jodlowski TZ, Cutrell JB. Pharmacologic treatments for coronavirus disease 2019 (COVID-19): A review. JAMA. 2020;323:1824–1836. doi: 10.1001/jama.2019.20153. [DOI] [PubMed] [Google Scholar]
- Simonnet A, Chetboun M, Poissy J, Raverdy V, Noulette J, et al. High prevalence of obesity in severe acute respiratory syndrome coronavirus-2 (SARS-CoV-2) requiring invasive mechanical ventilation. Obesity. 2020 doi: 10.1002/oby.22831. [DOI] [PMC free article] [PubMed] [Google Scholar]
- Stefan N, Birkenfeld AL, Schulze MB and Ludwig DS 2020 Obesity and impaired metabolic health in patients with COVID-19. Nat. Rev. Endocrinol.10.1038/s41574-020-0364-6 [DOI] [PMC free article] [PubMed]
- Verdecchia P, Cavallini C, Spanevello A and Angeli F 2020 The pivotal link between ACE2 deficiency and SARS-CoV-2 infection. Eur. J. Intern. Med.10.1016/j.ejim.2020.04.037 [DOI] [PMC free article] [PubMed]
- Vohra M, Adhikari P, Souza SC, Nagri SK, Umakanth S et al. 2020 CpG-SNP site methylation regulates allele-specific expression of MTHFD1 gene in type 2 diabetes. Lab. Invest.10.1038/s41374-020-0422-7 [DOI] [PubMed]
- Wang F, Ren XF, Chen Z, Li XL, Zhu HJ, et al. The N-terminal His-tag affects the triglyceride lipase activity of hormone-sensitive lipase in testis. J. Cell Biochem. 2019;120:13706–13716. doi: 10.1002/jcb.28643. [DOI] [PubMed] [Google Scholar]
- Wang YC, McPherson K, Marsh T, Gortmaker SL, Brown M. Health and economic burden of the projected obesity trends in the USA and the UK. Lancet. 2011;378:815–825. doi: 10.1016/S0140-6736(11)60814-3. [DOI] [PubMed] [Google Scholar]
- WHO Coronavirus Disease (COVID-19) Dashboard 2020 https://covid19.who.int/
- Ye YH, Chen K, Jin KK, Zhang YF, Chen L. Progress on surgical treatment for femoral head-preservering in the precollapse stage of femoral head necrosis. Zhongguo Gu Shang. 2017;30:287–292. doi: 10.3969/j.issn.1003-0034.2017.03.021. [DOI] [PubMed] [Google Scholar]
- Yu JC, Hsu FC, Chiu YF. Assessment of fenofibrate-methylation interactions on triglycerides using longitudinal family data. BMC Proc. 2018;12:48. doi: 10.1186/s12919-018-0132-y. [DOI] [PMC free article] [PubMed] [Google Scholar]
- Zhang F, Xiong Y, Wei Y, Hu Y, Wang F, et al. Obesity predisposes to the risk of higher mortality in young COVID-19 patients. J. Med. Virol. 2020 doi: 10.1002/jmv.26039. [DOI] [PMC free article] [PubMed] [Google Scholar]
- Zheng KI, Gao F, Wang XB, Sun QF, Pan KH, et al. Obesity as a risk factor for greater severity of COVID-19 in patients with metabolic associated fatty liver disease. Metabolism. 2020 doi: 10.1016/j.metabol.2020.154244154244. [DOI] [PMC free article] [PubMed] [Google Scholar]
- Zuber V, Marconett CN, Shi J, Hua X, Wheeler W, et al. Pleiotropic analysis of lung cancer and blood triglycerides. J. Natl. Cancer Inst. 2016 doi: 10.1093/jnci/djw167. [DOI] [PMC free article] [PubMed] [Google Scholar]


