Abstract
The novel coronavirus disease (COVID-19) broke out worldwide in 2020. The purpose of this paper was to find out the impact of migrant population on the epidemic, aiming to provide data support and suggestions for control measures in various epidemic areas. Generalized additive model was utilized to model the relationship between migrant population and the cumulative number of confirmed cases of COVID-19. The difference of spatial distribution was analyzed through spatial autocorrelation and hot spot analysis. Generalized additive model demonstrated that the cumulative number of confirmed cases was positively correlated with migration index and population density. The predictive results showed that, if no travel restrictions are imposed on the migrant population as usual, this number of COVID-19 would have reached 27,483 (95% CI 16,074, 48,097; the actual number was 23,177). The increase in one city (Jian) would be 577.23% (95% CI 322.73%, 972.73%) compared with the real confirmed cases of COVID-19. The average increase in 73 cities was 85.53% (95% CI 19.53%, 189.81%). Among the migration destinations, the number of cases in cities of Hubei province, Chongqing, and Beijing was relatively high, and there were large-scale high-prevalence clusters in eastern Hubei province. Without restrictions on migration, the high prevalence areas in Hubei province and its surrounding areas will be further expanded. The reduced population mobility and population density can greatly slow down the spread of the epidemic. All epidemic areas should suspend the transportation between cities, strictly control the population travel, and decrease the population density, so as to reduce the spread of COVID-19.
Supplementary Information
The online version contains supplementary material available at 10.1007/s11356-021-13195-z.
Keywords: Coronavirus, COVID-19, Generalized additive model, Migration, Spatial distribution
Introduction
In 2020, a novel coronavirus disease (COVID-19) epidemic broke out in the world. This is a lung disease caused by novel coronavirus (SARS-CoV-2). Its incubation is 1–14 days (possibly longer, up to 24 days (Guan et al. 2020)), with an average of 3–7 days. Respiratory droplets and close contact transmission are the main transmission routes (fecal-oral transmission also exists (Wu et al. 2020c)). The majority symptoms are dry cough, fever, and fatigue (foundation et al. 2020; House and Association 2020). Although the fatality rate is slightly lower than that of SARS in 2003 (Cowling et al. 2006; Lau et al. 2010; Wu et al. 2020a), the risk of patients suffering from basic diseases and the elderly is higher than that of the general population (Wu et al. 2020a). Moreover, COVID-19 is extremely infectious (Riou and Althaus 2020; To et al. 2020; Wu et al. 2020b; Yang et al. 2020a), and 44% of human-to-human transmission may occur before symptoms appear (He et al. 2020).
According to research findings, the epidemic may have occurred in China by the end of 2019 (Li et al. 2020). Although the place where the disease initially began to spread is still unclear, it spread rapidly throughout China. As of January 31, the total number of confirmed cases nationwide had exceeded 10,000 (China 2020b).
On January 31, the World Health Organization (WHO) officially listed the epidemic in China as a “public health emergency of international concern (PHEIC).” Then, on March 11, COVID-19 was identified as a “pandemic.” This fully confirms the seriousness of the epidemic. Affected by the epidemic, all provinces in China have started the first-level response to the public health emergency, suspending or greatly reducing the transportation of passengers at the provincial and municipal levels, in order to reduce the personnel travel. Schools, enterprises, and institutions have also suspended work and postponed resumption of work. Research by Zifeng Yang and other scholars illustrated that Wuhan’s city closure measure can effectively slow down the growth of confirmed cases of COVID-19 epidemic (Yang et al. 2020b). Meanwhile, the article of Huaiyu Tian’s team also confirmed the effectiveness of measures such as city closure, suspension of public transportation, and prohibition of public gatherings (Tian et al. 2020).
This study hopes to find out the influence of migrant population on the number of confirmed cases of COVID-19 and the changes in spatial distribution. Besides, according to the prediction results and spatial analysis, epidemic prevention suggestions were provided for the global epidemic areas in terms of resuming work, personnel travel, etc., so as to control the spread of the epidemic in the world at an early date.
Methods
Data sources
Samples of cumulative confirmed cases of COVID-19 came from websites of the Health Commissions of all provinces in China (China 2020a). The migration data of relevant population (mainly covering the cities’ migration in Hubei province) were extracted from Baidu migration data platform (Maps 2020). Data on population density were collected from statistical yearbooks and bulletins of provinces and cities (Statistics 2020).
Migration and COVID-19 data
As the epidemic focus of this outbreak in China, Wuhan city was blockaded on January 23, 2020. According to this, the time range of migration data (model fitting part) in this study was set to January 1–23, 2020. We use these data to learn a generalized additive model (GAM). From January 23 to February 29, since the city was blockaded, we used the migration data of the last year to predict the number of confirmed cases of COVID-19 and then we compared the predicted numbers with the real numbers.
Migration data from December 29, 2018, to February 7, 2019, of the lunar year (consistent with the date of 2020 lunar year, i.e., January 23 to February 29, 2020, solar year) was included as the forecast. Baidu migration data platform provided migrant population (%) and emigration index for each city. Migrant population refers to the scale of migration flowing from epidemic area to destination during January 1–23, which is recorded in the form of percentage. Emigration index reflects the daily outflow intensity of population in different cities and can be used for horizontal comparison between cities (Maps 2020). Then, we define a variable called migration index (MI). The migration index (MI) reflects the scale of migrant population from one city to another (i.e., MI of city B indicates the scale of migrants from epidemic area A to city B), and all cities have migration indexes corresponding to one specific city. The formula for calculating the migration index variable of each city is as follows:
where n is the date (i.e., n = 1 represents January 1).
Since nearly 70% of the population (mean 66.75%) moved out of Wuhan to other cities in Hubei province, those cities’ data with the migrant population value of greater than 3% were also included in the analysis (a total of 9 cities in Hubei province, accounting for 56.57% of Wuhan’s migration population). Based on the migration destination of Wuhan, 75 cities were selected from the top 100 cities with the largest migrant population after matching (selecting the migrant destination cities shared by the above 9 cities). The specific list of cities was presented in Appendix A.
The incubation period of the COVID-19 is usually 1–14 days. In order to cover all cases affected by migration as fully as possible, the cumulative confirmed cases on February 6 (14 days apart from the Wuhan travel ban) were included in this study. This part of the data corresponded to MI dataset from January 1 to 23 and was used to learn the GAM model to evaluate the impact of migrant population, with a total of 16,094 cases, covering 75 cities. The data used in the comparative analysis of the prediction part were the cumulative number of confirmed cases in each city as of 24:00 on March 14, totaling 23,177 cases.
Other data
The urban travel intensity (UTI) refers to the exponentiation result of the ratio of the number of travelers (within one day) to the resident population in the city. The model’s fitting part was the sum of the data from January 1 to 23 (unit: city). Subsequent data (up to the end of February) were used as the construction variables for the prediction part. In view of the population density (PD), considering the influence of the Chinese Spring Festival custom, and in order to reduce the bias as much as possible, the census register population was utilized to fit the model, and the prediction part used the data of the resident population after resuming work.
Statistical analysis
In this study, R software was used for analysis and modeling. Generalized additive model was utilized to model the relationship between migrant population and the cumulative number of confirmed cases of COVID-19. Meanwhile, the difference of spatial distribution was analyzed through spatial autocorrelation and hot spot analysis in ArcGIS 10.2 software, and maps were drawn. A probability level of p < 0.05 represented the result with statistical significance.
GAM model
GAM was used in this study to study the relationship between the cumulative number of confirmed cases of COVID-19 and the migration data. Its principle is to minimize residual while maximizing simplicity. Some or all of the independent variables in the regression model adopt (spline) smoothing function to reduce the model risk caused by linear settings (Chiang 2007; Venables and Dichmont 2004; Wood and Augustin 2002). Because MI refers to migrants who have moved to other cities, there is no data representing migrants in their own cities; so, some variables (such as MI dataset of Xiaogan City) have missing data. Considering comprehensively, after transforming variables to a certain extent (through normal transformation), we used both Lasso and stepwise regression (backward) to screen a total of 12 variables (urban travel intensity (UTI), PD, Wuhan MI, and the MI of the other 9 cities mentioned above). By combining with the two results and the goodness of fit of the selected variables into the model, five variables were finally incorporated into GAM model, namely, Wuhan migration index (WhMI), Xiangyang migration index (XyMI), Huangshi migration index (HsMI), urban travel intensity (UTI), and population density (PD). The formula of the GAM model is:
where s( ) denotes a (spline) smooth transformation function, which is used to help set up a model using spline based smooths. We applied the above model and used the code “predict.gam” in R software to predict the cumulative number of regional confirmed cases.
Spatial analysis
ArcGIS software undertook the spatial analysis part of this study. The natural breaks (Jenks) method was used in the grading of the migrant population map (Chen et al. 2013). Spatial autocorrelation and hot spot analysis methods were applied to analyze the regional differences of confirmed cases.
Spatial autocorrelation (Global Moran’s I) is a method to judge whether there is spatial aggregation of data. When data tends to cluster spatially (high-value clustering or low-value clustering), Moran’s I index will be positive and vice versa (ESRI 2018b).
Hot spot analysis method is to calculate Getis-Ord Gi* statistics for each element in the dataset. Through the obtained z-score and p-value, it can be judged where features with either high or low values cluster spatially. When an element has a high value and is surrounded by other adjacent high-value features, the local sum for the feature and its neighbors is calculated. If this is so different from the expected local sum that it cannot be randomly generated, a statistically significant z-score will be produced. For statistically significant positive z-scores, the larger the z-score is, the more intense the clustering of high values (hot spot), and the smaller the z-score is, the more intense the clustering of low values (cold spot) (ESRI 2018a).
The Getis-Ord local statistic is given as:
where xj is the attribute value for feature j, wi, j is the spatial weight between features i and j , and:
Results
Epidemiological characteristics
The sample of this study was from the data of confirmed cases of COVID-19 shared by China in 2020. Statistics were made on two time nodes, respectively: the cumulative numbers of confirmed cases on February 6 and March 14. As of February 6, the cumulative number of confirmed cases in China has reached 31,161.
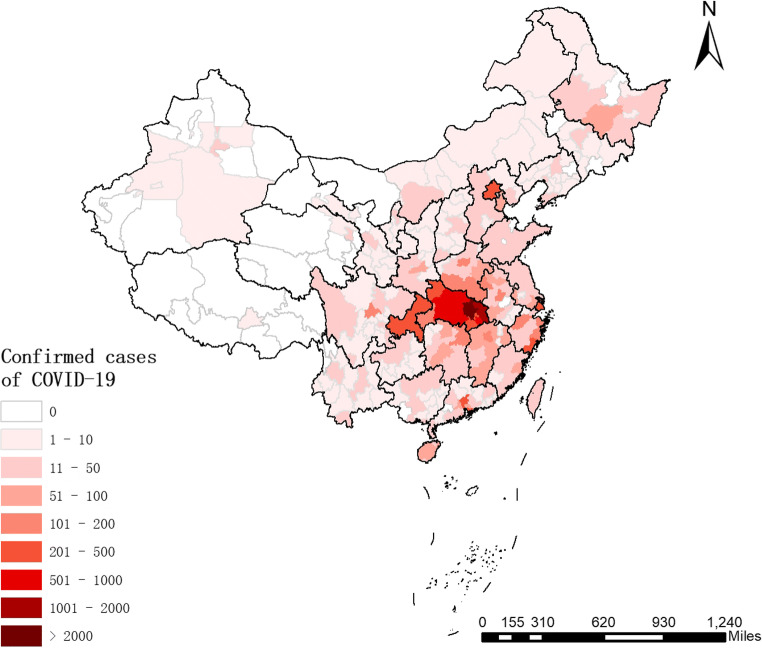
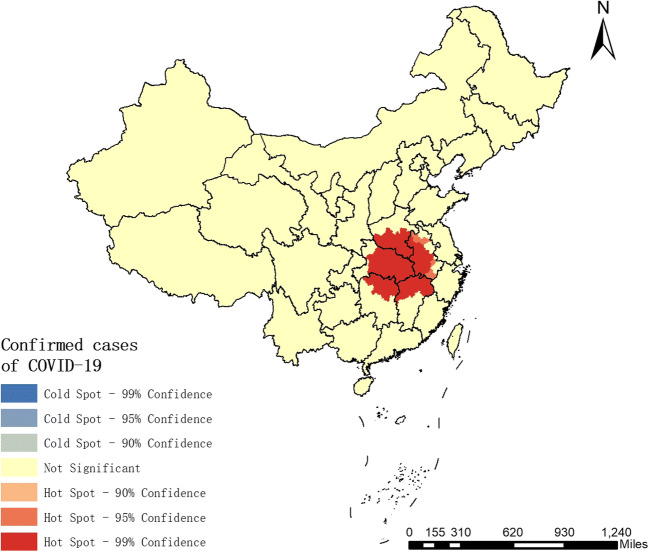
According to the spatial distribution map of the epidemic situation in the whole country (Fig. 1), the cumulative number of confirmed cases in Hubei province was much higher than that in other provinces and cities. Especially, Wuhan, the capital city of Hubei province has the most cumulative number of confirmed cases (up to 11,618 cases, accounting for 37.28% of the whole cumulative confirmed cases in China). In addition, the cumulative numbers of confirmed cases in Beijing, Chongqing, and some coastal areas of Zhejiang and Guangdong provinces were relatively high. The results of spatial analysis demonstrated that, as of February 6, the cumulative numbers of confirmed cases were aggregated in spatial distribution (Moran’s I Index = 0.07, z-score = 9.60, p-value = 0.000). Further hot spot analysis confirmed it: most of Hubei province and its neighbors (Henan, Anhui, Jiangsu, and parts of Hunan) were areas with high prevalence of COVID-19, and the degree of aggregation was extremely high. The results were shown in Fig. 2.
Fig. 1.
Spatial distribution of cumulative confirmed cases of coronavirus disease (COVID-19) in China (February 6)
Fig. 2.
Spatial aggregation of cumulative confirmed cases of Coronavirus Disease (COVID-19) in China (February 6)
Migration characteristics
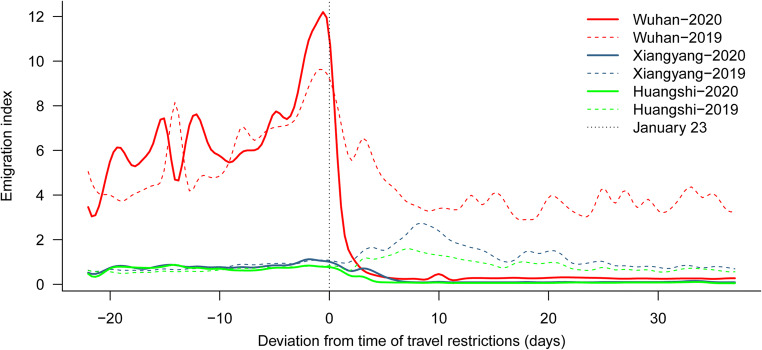
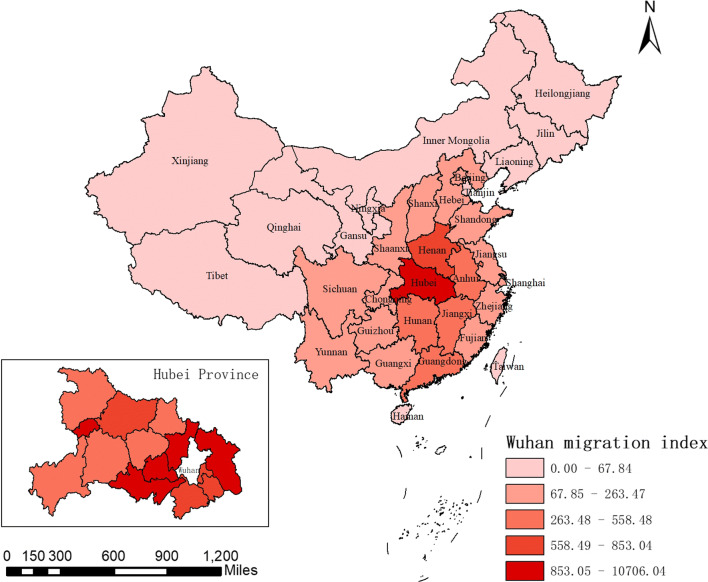
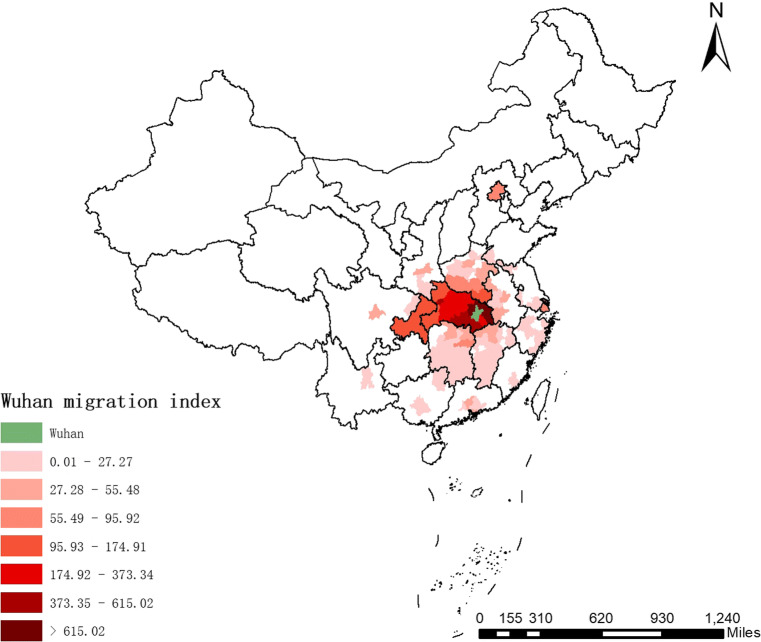
Statistics from Baidu Migration Data Platform showed that Wuhan’s emigration index on the 21st–23rd was much higher than that of the same period last year (up 23.31%, 23.33%, and 20.82%, respectively). Meanwhile, after travel restrictions, the emigration index dropped significantly. The emigration indexes of Wuhan, Xiangyang, and Huangshi were shown in Fig. 3. Among the many migration destinations, about 70% of the population were destined for other cities in Hubei province. The migration situation of each region can be found in Fig. 4.
Fig. 3.
Trends of emigration index in 2019 and 2020
Fig. 4.
Destination of Wuhan’s migrants (provincial level)
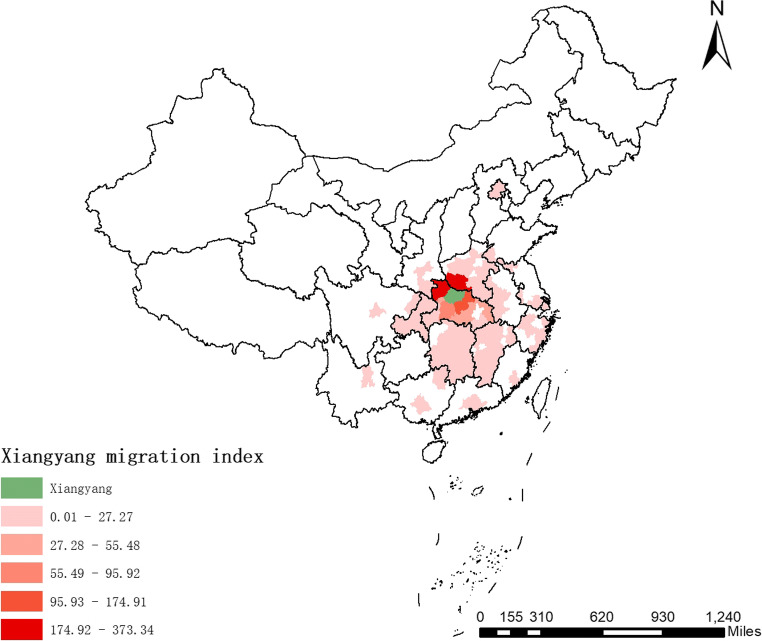
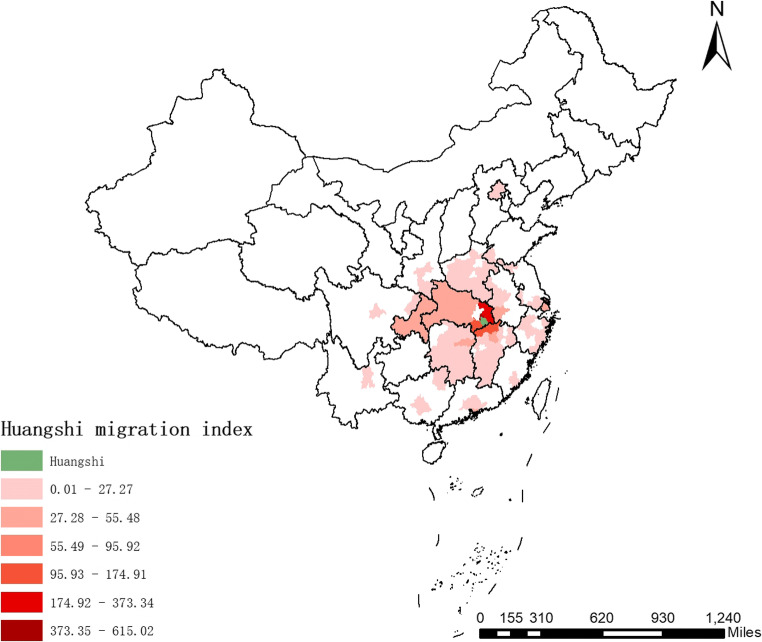
From the perspective of city level, Wuhan’s migration destinations (75 cities covered by the model) were also mostly cities in Hubei province. Besides, Beijing and Chongqing also had a large scale of immigrants. Xiangyang’s main migration destinations were concentrated in the northern part of Hubei province and the southern part of Henan, while that of Huangshi were mainly located in the eastern part of Hubei and the areas bordering Jiangxi province. The results were shown in Figs. 5, 6, and 7.
Fig. 5.
Major destination of Wuhan’s migrants (city level)
Fig. 6.
Major destination of Xiangyang’s migrants (city level)
Fig. 7.
Major destination of Huangshi’s migrants (city level)
GAM model
In this study, the cumulative confirmed cases in Wuhan’s main migration destination were selected for analysis (16,094 cases, covering 51.65%). The model fitting results (Tables 1 and 2) illustrated that the cumulative number of confirmed cases of COVID-19 was correlated with the migrant population (Wuhan, Xiangyang, and Huangshi) and regional population density (, deviance explained = 89.6%, GCV = 0.198), and the correlation was statistically significant.
Table 1.
Parametric coefficients of GAM model
| Variables | Estimate | Std. error | t-value | p-value |
|---|---|---|---|---|
| Intercept | 6.270 | 0.589 | 10.644 | 0.000 |
| (XyMI)−0.12 | −2.170 | 0.737 | −2.945 | 0.005 |
Table 2.
Approximate significance of GAM model smooth terms
| Variables | edf | Ref. df | F | p-value |
|---|---|---|---|---|
| s((WhMI)−0.33) | 4.611 | 5.572 | 5.528 | 0.000 |
| s((HsMI)−0.33) | 5.337 | 6.416 | 8.391 | 0.000 |
| s((UTI)5.22) | 1 | 1 | 1.227 | 0.273 |
| s(Log(PD)) | 1 | 1 | 7.332 | 0.009 |
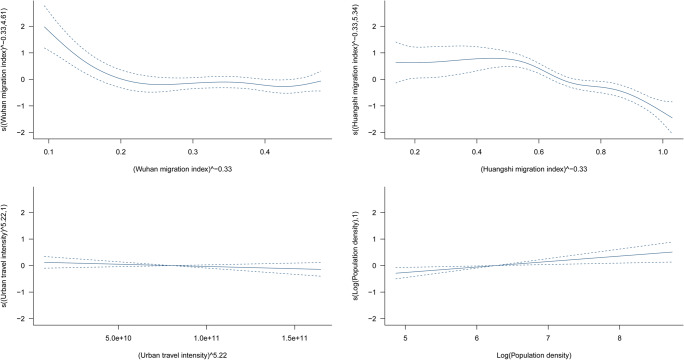
Figure 8 demonstrated the nonlinear (or linear) relationship between variables and the cumulative number of confirmed cases (please note that the variables WhMI, XyMI, and HsMI were all transformed to negative power): overall, there were concomitant upward trends between WhMI, HsMI, PD, and the cumulative number of regional confirmed cases. Among them, Wuhan and Huangshi rose in the curve. In the early stage of population migration in Wuhan, the cumulative number of cases caused by the expansion of migration scale was still relatively slow to rise, but when the migration scale continued to expand, the cumulative number of confirmed cases would increase dramatically. However, the result in Huangshi was just the opposite, and its early rising trend was higher than that in the later period. Furthermore, XyMI (Table 1) and PD were also positively associated with the cumulative number of confirmed cases.
Fig. 8.
Smooth function in GAM model
Predictive analysis
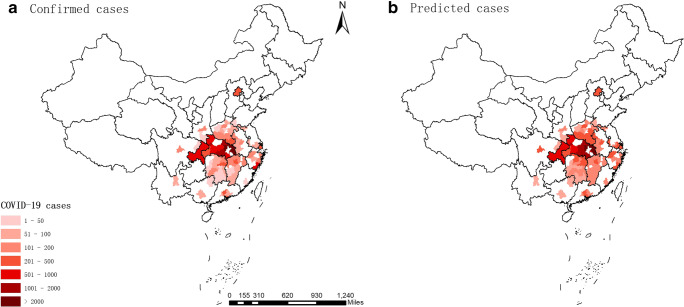
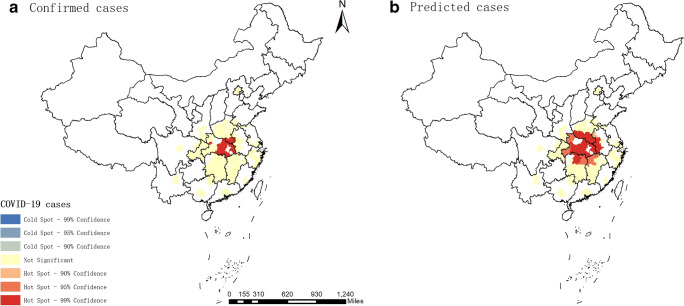
We adjusted the five independent variables included in the model and calculated the cumulative number of predicted cases in 73 cities (Xiangyang and Huangshi cannot be predicted without their own MI). The predictive results showed that the total cumulative number of confirmed cases of COVID-19 would have reached 27,483 (95% CI 16 074, 48 097) due to the population movement after returning to work (the actual number was 23,177). The average increase in 73 cities was 85.53% (95% CI 19.53%, 189.81%), while the highest increase (Jian City, Jiangxi province) reached 577.23% (95% CI 322.73%, 972.73%). The spatial aggregation range of epidemic in the surrounding areas of Hubei province was most prominent (Figs. 9 and 10).
Fig. 9.
Differences in spatial distribution of predicted cases of coronavirus disease (COVID-19) in China (March 14)
Fig. 10.
Spatial aggregation differences of predicted cases of coronavirus disease (COVID-19) in China (March 14)
Comparing the spatial distribution difference between the predicted cases and the actual confirmed cases, we found that the epidemic in some major areas will be further aggravated if normal work is resumed without taking corresponding restrictive measures. A total of 64 cities (about 87.67%) will see the increase in the cumulative number of confirmed cases (deeper marker color), and values will be much higher than those for the same period on March 14.
Discussion
The international pandemic was very severe. As of March 31, the cumulative number of confirmed cases of COVID-19 worldwide has exceeded 750,000. This number increased from 10,000 to 670,000, the process that took only 27 days, and the growth rate was extremely frightening. The control measures and intensity adopted by the government in response to the epidemic are crucial to prevent the epidemic from spreading further. The relief of the epidemic in China just reflects the effectiveness of the intervention measures (Yang et al. 2020b).
In this study, GAM model was used to model and predict the major population movements and the cumulative number of confirmed cases. Combined with the spatial distribution map of the epidemic and migration, the relationship between the two was clearly and accurately expounded (Deviance explained reached 89.6%). The expansion of migrant population scale in major cities which related to the epidemic focus (or severely affected areas) was the main incentive for the increase in the number of regional confirmed cases. The forecast results revealed that the total cumulative number of confirmed cases in 73 cities will increase by 85.53% (95% CI 19.53%, 189.81%) if restrictions on population movement are not adopted and work is resumed in advance. Meanwhile, the scope of the “hardest hit areas” will be further expanded (in mid-March). During the epidemic period, China implemented effective prevention and control measures such as postponing the resumption of work and suspending classes, have reduced the travel and concentration of people, and have greatly curbed the increase and spread of the cumulative number of confirmed cases. A recent study published in the Science also confirms this conclusion (Tian et al. 2020). Furthermore, the results also confirmed the negative impact of population density on the development of the epidemic. This should also be given priority attention. Interventions such as quarantine, school closure, and workplace distancing that can urge people to keep a distance between people can effectively block the spread of the virus (Koo et al. 2020; Wu et al. 2020a).
Although the abovementioned intervention measures may lead to unemployment or other problems and bring great impact to the national or regional economy, they are still very effective, and the benefits will outweigh the losses. If the spread of SARS-CoV-2 is allowed to proceed without intervention, the negative impact of the spread will further aggravate the economic recession. We hoped that all countries will pay more attention and adopt strict intervention measures (e.g., mandatory wearing of masks, suspension of intercity traffic in affected areas, postponement of the start of school, and the resumption of work), rather than just giving “advice” (Zhang et al. 2020a).
It is worth noting that many countries prohibit unnecessary travel but allow activities such as walking pets. A recent study pointed out that cats were also infected (Zhang et al. 2020b). In spite of the fact that there is no clear basis for human-animal transmission, it is still necessary to be vigilant about the potential risk of transmission through pets and the movement of people caused by walking pets. The interactions that exist have yet to be further validated. In addition, asymptomatic infected persons have been continuously detected recently. Countries should also attach great importance to the risks posed by the movement of such people (Hu et al. 2020; Qiu 2020).
Limited by the data, the migrant population data of each city involved in this research model was in the form of “proportion,” and the specific population number cannot be known, and the migration data of cities can only be obtained to top 100, which may have some influence on the accuracy of the research results.
Conclusion
The reduced population mobility and population density have positive effects on slowing down the spread of the epidemic. In conclusion, we strongly recommend that other countries learn from China’s experience, suspend the transportation between cities, comprehensively and strictly control the population travel, and decrease the population density, so as to reduce the spread of diseases.
Supplementary Information
(XLS 34 kb).
Acknowledgements
The authors would like to express their gratitude for the support of the Peking University Start-up Grant (71015Y2088).
Author contribution
LH and JJ conceived and designed the study. LH collected the source data of the study. LH and JJ prepared software and performed the statistical analysis. LH prepared the manuscript and interpreted the data. JJ assisted with the editing of the paper and provided critical comments. JJ revised it critically for important intellectual content. All authors read and approved the final manuscript.
Funding
The study was supported by grants from the Peking University Start-up Grant (71015Y2088).
Availability of data and materials
All the data involved in this article can be obtained online. No additional data available.
Declarations
Ethics approval and consent to participate
Not applicable.
Consent of publication
Not applicable
Competing interests
The authors declare that they have no competing interests.
Role of the funding source
The funder of the study had no role in the study design, data collection, data analysis, data interpretation, or writing of the report. The corresponding authors had full access to all the data in the study and had final responsibility for the decision to submit for publication.
Footnotes
Publisher’s note
Springer Nature remains neutral with regard to jurisdictional claims in published maps and institutional affiliations.
References
- Chen J, Yang ST, Li HW, Zhang B, Lv JR. Research on geographical environment unit division based on the method of natural breaks (Jenks) Int Arch Photogramm Remote Sens Spat Inf Sci. 2013;XL-4/W3:47–50. doi: 10.5194/isprsarchives-XL-4-W3-47-2013. [DOI] [Google Scholar]
- Chiang AY (2007) Generalized additive models: an introduction with R Technometrics 49:360–361 10.1198/tech.2007.s505
- China NHCotPsRo (2020a) Epidemic notification. National Health Commission of the People's Republic of China. http://www.nhc.gov.cn/xcs/yqtb/list_gzbd.shtml. Accessed 14 March 2020
- China NHCotPsRo (2020b) The latest situation of pneumonia epidemic infected with SARS-CoV-2 as of 24:00 on January 31. National Health Commission of the People's Republic of China. http://www.nhc.gov.cn/xcs/yqtb/202002/84faf71e096446fdb1ae44939ba5c528.shtml. Accessed 14 March 2020
- Cowling BJ, et al. Clinical prognostic rules for severe acute respiratory syndrome in low- and high-resource settings. Arch Intern Med. 2006;166:1505–1511. doi: 10.1001/archinte.166.14.1505. [DOI] [PubMed] [Google Scholar]
- ESRI (2018a) How hot spot analysis (Getis-Ord Gi*) works. ESRI. http://desktop.arcgis.com/en/arcmap/10.3/tools/spatial-statistics-toolbox/h-how-hot-spot-analysis-getis-ord-gi-spatial-stati.htm. Accessed 20 March 2019
- ESRI (2018b) How spatial autocorrelation (Global Moran's I) works. ESRI. http://desktop.arcgis.com/en/arcmap/10.3/tools/spatial-statistics-toolbox/h-how-spatial-autocorrelation-moran-s-i-spatial-st.htm. Accessed 20 March 2019
- foundation JM, UNIVERSITY Z, Province TFHoZ, Cloud A, AliHealth (2020) Handbook of COVID-19 preventionand treatment The First Affiliated Hospital, Zhejiang University School of medicine compiled according to clinical experience. Alibaba Cloud, China
- Guan WJ et al (2020) Clinical characteristics of Coronavirus disease 2019 in China. N Engl J Med. 10.1056/NEJMoa2002032 [DOI] [PMC free article] [PubMed]
- He X et al. (2020) Temporal dynamics in viral shedding and transmissibility of COVID-19 Nature Medicine 26. 10.1038/s41591-020-0869-5 [DOI] [PubMed]
- House PsMP. Association CPM . Guidelines for corona virus Disease 2019. Prevention, control, diagnosis and Management. China: People's Medical Publishing House; 2020. [Google Scholar]
- Hu Z, Song C, Xu C, Jin G, Chen Y, Xu X, Ma H, Chen W, Lin Y, Zheng Y, Wang J, Hu Z, Yi Y, Shen H. Clinical characteristics of 24 asymptomatic infections with COVID-19 screened among close contacts in Nanjing, China. Sci China Life Sci. 2020;63:706–711. doi: 10.1007/s11427-020-1661-4. [DOI] [PMC free article] [PubMed] [Google Scholar]
- Koo JR et al (2020) Interventions to mitigate early spread of SARS-CoV-2 in Singapore: a modelling study. Lancet Infect Dis. 10.1016/s1473-3099(20)30162-6 [DOI] [PMC free article] [PubMed]
- Lau EH, et al. A comparative epidemiologic analysis of SARS in Hong Kong, Beijing and Taiwan. BMC Infect Dis. 2010;10:50. doi: 10.1186/1471-2334-10-50. [DOI] [PMC free article] [PubMed] [Google Scholar]
- Li Q, Guan X, Wu P, Wang X, Zhou L, Tong Y, Ren R, Leung KSM, Lau EHY, Wong JY, Xing X, Xiang N, Wu Y, Li C, Chen Q, Li D, Liu T, Zhao J, Liu M, Tu W, Chen C, Jin L, Yang R, Wang Q, Zhou S, Wang R, Liu H, Luo Y, Liu Y, Shao G, Li H, Tao Z, Yang Y, Deng Z, Liu B, Ma Z, Zhang Y, Shi G, Lam TTY, Wu JT, Gao GF, Cowling BJ, Yang B, Leung GM, Feng Z. Early transmission dynamics in Wuhan, China, of novel coronavirus-infected pneumonia. N Engl J Med. 2020;382:1199–1207. doi: 10.1056/NEJMoa2001316. [DOI] [PMC free article] [PubMed] [Google Scholar]
- Maps B (2020) Baidu migration. Baidu Maps. https://qianxi.baidu.com/?from=mappc. Accessed 1 March 2020
- Qiu J (2020) Covert coronavirus infections could be seeding new outbreaks. Nature. https://www.nature.com/articles/d41586-020-00822-x. Accessed 25 March 2020 [DOI] [PubMed]
- Riou J, Althaus CL (2020) Pattern of early human-to-human transmission of Wuhan 2019 novel coronavirus (2019-nCoV), December 2019 to January 2020. Euro Surveill 25. 10.2807/1560-7917.ES.2020.25.4.2000058 [DOI] [PMC free article] [PubMed]
- Statistics NBo (2020) China Statistical Yearbook 2019. National Bureau of Statistics. http://www.stats.gov.cn/tjsj/ndsj/2019/indexch.htm. Accessed 25 March 2020
- Tian H et al (2020) An investigation of transmission control measures during the first 50 days of the COVID-19 epidemic in China. Science. 10.1126/science.abb6105 [DOI] [PMC free article] [PubMed]
- To KK-W et al (2020) Temporal profiles of viral load in posterior oropharyngeal saliva samples and serum antibody responses during infection by SARS-CoV-2: an observational cohort study. Lancet Infect Dis. 10.1016/s1473-3099(20)30196-1 [DOI] [PMC free article] [PubMed]
- Venables WN, Dichmont CM. GLMs, GAMs and GLMMs: an overview of theory for applications in fisheries research. Fish Res. 2004;70:319–337. doi: 10.1016/j.fishres.2004.08.011. [DOI] [Google Scholar]
- Wood SN, Augustin NH. GAMs with integrated model selection using penalized regression splines and applications to environmental modelling. Ecol Model. 2002;157:157–177. doi: 10.1016/s0304-3800(02)00193-x. [DOI] [Google Scholar]
- Wu JT, Leung K, Bushman M, Kishore N, Niehus R, de Salazar PM, Cowling BJ, Lipsitch M, Leung GM. Estimating clinical severity of COVID-19 from the transmission dynamics in Wuhan, China. Nat Med. 2020;26:506–510. doi: 10.1038/s41591-020-0822-7. [DOI] [PMC free article] [PubMed] [Google Scholar]
- Wu JT, Leung K, Leung GM. Nowcasting and forecasting the potential domestic and international spread of the 2019-nCoV outbreak originating in Wuhan, China: a modelling study. Lancet. 2020;395:689–697. doi: 10.1016/s0140-6736(20)30260-9. [DOI] [PMC free article] [PubMed] [Google Scholar]
- Wu Y et al (2020c) Prolonged presence of SARS-CoV-2 viral RNA in faecal samples. Lancet Gastroenterol Hepatol. 10.1016/s2468-1253(20)30083-2 [DOI] [PMC free article] [PubMed]
- Yang Y, Lu QB, Liu MJ, Wang YX, Zhang AR, Jalali N, Dean N E, Longini I, Halloran M E, Xu B, Zhang XA, Wang LP, Liu W, Fang LQ (2020a) Epidemiological and clinical features of the 2019 novel coronavirus outbreak in China medRxiv:2020.2002.2010.20021675. 10.1101/2020.02.10.20021675
- Yang Z, et al. Modified SEIR and AI prediction of the epidemics trend of COVID-19 in China under public health interventions. J Thorac Dis. 2020;12:165–174. doi: 10.21037/jtd.2020.02.64. [DOI] [PMC free article] [PubMed] [Google Scholar]
- Zhang J, Litvinova M, Wang W, Wang Y, Deng X, Chen X, Li M, Zheng W, Yi L, Chen X, Wu Q, Liang Y, Wang X, Yang J, Sun K, Longini IM, Jr, Halloran ME, Wu P, Cowling BJ, Merler S, Viboud C, Vespignani A, Ajelli M, Yu H. Evolving epidemiology and transmission dynamics of coronavirus disease 2019 outside Hubei province, China: a descriptive and modelling study. Lancet Infect Dis. 2020;20:793–802. doi: 10.1016/s1473-3099(20)30230-9. [DOI] [PMC free article] [PubMed] [Google Scholar]
- Zhang Q, Zhang HJ, Huang K, Yang Y, Hui XF, Gao JD, He XL, Li CF, Gong WX, Zhang YF, Peng C, Gao XX, Chen HC, Zou Z, Shi ZL, Jin ML (2020b) SARS-CoV-2 neutralizing serum antibodies in cats: a serological investigation bioRxiv:2020.2004.2001.021196. 10.1101/2020.04.01.021196
Associated Data
This section collects any data citations, data availability statements, or supplementary materials included in this article.
Supplementary Materials
(XLS 34 kb).
Data Availability Statement
All the data involved in this article can be obtained online. No additional data available.


