

Abstract
Background/Objectives:
Approximately 2 million people, or 6% of older adults in the United States, are homebound. In cross-sectional studies, homebound older adults have high levels of morbidity and mortality, but there is little evidence of longitudinal outcomes after becoming homebound. The aim of this research is to prospectively assess over 6 years the dynamics of homebound status, ongoing community residence, and death in a population of community-dwelling older adults who are newly homebound.
Design/setting:
Prospective cohort study using 2011–2018 data from the National Health and Aging Trends Study (NHATS), an annual, nationally-representative longitudinal study of aging in the United States.
Participants:
Two hundred and sixty seven newly homebound older adults in 2012.
Measurements:
Homebound status was defined via self-report as living in the community but rarely/never leaving home in the prior month. Semi-homebound was defined as leaving the house only with difficulty or help.
Results:
One year after becoming newly homebound, 33.1% remained homebound, 22.8% were completely independent, 23.8% were semi-homebound, 2.2% were in a nursing home, and 18.0% died. Homebound status is highly dynamic; 6 years after becoming homebound, 13.5% remained homebound and 65.0% had died. Recovering from being homebound at 1 year was associated with younger age and lower baseline rates of receiving help with activities of daily living, in particular, with bathing.
Conclusion:
Homebound status is a dynamic state. Even if transient, becoming homebound is strongly associated with functional decline and death. Identifying newly homebound older adults and developing interventions to mitigate associated negative consequences needs to be prioritized.
Keywords: disability, epidemiology, geriatrics, homebound, longitudinal, NHATS
BACKGROUND
In 2011, an estimated 2 million older adults in the United States were homebound, never or rarely leaving home.1 Homebound older adults have a 2-year mortality of 40.3%, higher mortality than those not homebound even accounting for sociodemographic characteristics, comorbidities, and functional status.2 They experience high levels of chronic illness, cognitive impairment, depression, and anxiety as well as anorexia, fatigue, and pain.3–7 Despite this, the homebound are often invisible to health systems.8 The COVID-19 pandemic has only exacerbated the high levels of social isolation and care delivery challenges experienced by this population.9,10
Several innovative clinical and policy models have sought to target home-based supports to meet the needs of homebound older adults. Home-based primary care programs have sought to bring medical care into the home, often integrated with community-based supportive services.11–15 The Centers for Medicare & Medicaid Services have invested in the national Independence at Home demonstration program to better serve this population.16,17 As the evidence has mounted that such efforts can effectively support aging in the community,18–20 States have also invested in long-term services and support to serve the homebound population.21,22 Insurers and healthcare systems are recognizing the importance of focusing on the care of functionally impaired older adults, many of whom are homebound.23
Despite these investments in care models to support the homebound population, little is known about the natural history of being homebound. Nearly all research into the homebound population has assessed homebound status from a static, cross-sectional perspective, thus failing to consider how homebound status changes over time. One study found heterogeneous trajectories of individuals with regard to their homebound status24; another examined the role of income and other factors in predicting who becomes homebound.25 Determining the course and outcomes of individuals after they become homebound is critical to guide optimal care delivery for these patients by health systems and payers.
We aim to prospectively assess over 6 years the dynamics of homebound status, ongoing community residence, and death in a population of community-dwelling older adults who are newly homebound. In addition, we aim to assess the factors associated with remaining homebound in the community.
METHODS
Sample/data set
We used the National Health and Aging Trends Study (NHATS), a nationally-representative longitudinal study of Medicare beneficiaries age ≥ 65.26 Since 2011, NHATS annually surveys respondents on health and disability, including homebound status. We identified incident homebound NHATS respondents in 2012 as follows: community-dwelling and either independent or semi-homebound (left the home at least twice per week but reported either difficulty or receiving help to do so) in 2011, but in 2012 were homebound (rarely or never left home).1,25 This incident homebound cohort was followed for up to 6 years (2013–2018).
Measures
The primary outcome measure was homebound status in 2013, or one survey wave after incident homebound. As above, homebound status was categorized as (1) independent and no longer homebound; (2) community-dwelling and semi-homebound, defined as leaving the house at least twice per week but either reporting difficulty or receiving help to do so; (3) community-dwelling and persistently homebound, or leaving the house rarely/never. We also determined if respondents had moved into a nursing home or had died. In our multivariable model of the characteristics associated with each outcome, we combined nursing home and death into a single outcome due to sample size limitations. We additionally combined those fully independent with those who were semi-homebound, as both were leaving the house more often than when newly homebound. As a secondary outcome, we examined homebound status each of the 6 years after incident homebound.
Additional measures included age, sex, race, marriage status, self-reported income (categorized as below 100% of the federal poverty limit for that year vs not), Medicaid enrollment, residing in a metropolitan area, geographic region (Northeast, Midwest, South, West), fair or poor self-reported health (compared to good, very good, or excellent), receiving help with any activities of daily living (eating, bathing, toileting, dressing, walking inside, transferring in/out of bed), receiving help with any instrumental activities of daily living (laundry, shopping, banking, meal preparation, taking medications), self-reported medical conditions (heart attack, stroke, cancer, heart disease, hypertension, diabetes mellitus, lung disease), depression defined as a score of 3 or greater on the Patient Health Questionnaire-2, anxiety defined as a score of 3 or greater on the General Anxiety Disorder-2 screen, probable dementia as determined through both self-report and direct cognitive assessment conducted by NHATS,27 and if a proxy was required for NHATS completion.
Analysis
We assessed the sociodemographic, health, and functional characteristics of our incident homebound cohort. We then measured their homebound status one survey wave (year) later. Finally, we used a Sankey diagram28 to illustrate the flow of individuals between each homebound status category across 6 years.
We assessed the factors associated with remaining homebound vs independent vs either dying or residing in a nursing home among those individuals with follow-up in 2013. As a sensitivity analysis, we used multiple imputation to assign a homebound status for those incident homebound who were missing a homebound status in 2013 (N = 37). For the imputation, we used a multivariable logistic regression to predict homebound status in 2013 for non-deceased community-dwelling individuals without missing data using independent variables from 2012: age, sex, race, education, income, self-reported health, presence of ADL impairments, and dementia (Table S3). One individual had missing data for one or more of the 2012 independent variables and was excluded. All analyses used Stata Version 16 and accounted for survey design and sampling approach, with the reference frame of the 2011 NHATS cohort.
RESULTS
We identified 267 incident homebound individuals in 2012, representing a population of 1,210,818 older adults, or about 3% of those aged 65 and older in the United States.. Average age was 80.8 years and 68.7% were female. Table 1 depicts demographic, health, and function characteristics of the cohort in 2012. They reported high rates of comorbidities and disability and nearly half (45.7%) had probable dementia.
TABLE 1.
Characteristics of the incident homebound population, 2012 (N = 267), %
| Age (mean) | 80.8 |
|---|---|
| Female | 68.7 |
| Race/ethnicity | |
| White, Non-Hispanic | 71.8 |
| Black, Non-Hispanic | 11.4 |
| Hispanic | 12.5 |
| Other race/ethnicity | 3.1 |
| Married | 37.0 |
| Number of helpers (mean)a | 2.5 |
| Income below 100% FPLb | 38.6 |
| Proxy respondent | 23.4 |
| Enrolled in Medicaid | 26.8 |
| Residing in a metropolitan area | 87.3 |
| Geographic region | |
| Northeast | 22.0 |
| Midwest | 20.6 |
| South | 37.5 |
| West | 20.0 |
| Fair or poor self-reported health | 59.1 |
| Receives help with the below activities of daily living | |
| Eating | 21.6 |
| Bathing | 42.7 |
| Toileting | 18.0 |
| Dressing | 41.3 |
| Walking inside | 39.1 |
| Transferring in/out of bed | 25.4 |
| Receives help with 1 ADLc | 60.7 |
| Receives help with 1 IADLd | 80.6 |
| Self-reported conditions (current or prior) | |
| Heart attack | 23.7 |
| Stroke | 28.0 |
| Cancer | 25.0 |
| Heart disease | 29.7 |
| Hypertension | 78.7 |
| Diabetes mellitus | 31.2 |
| Lung disease | 22.9 |
| Depressione | 33.7 |
| Anxietyf | 29.6 |
| Probable dementiag | 45.7 |
Source: National Health and Aging Trends Study (NHATS) 2011–2012.
Homebound is identified at survey wave 2 (2012).
For those receiving help for at least 1 ADL or IADL.
FPL: federal poverty limit.
ADL: activities of daily living (eating, bathing, toileting, dressing, walking inside, transferring in/out of bed).
IADL: instrumental activities of daily living (laundry, shopping, banking, meal preparation, taking medication).
Depression determined by a score of 3 or greater on the Patient Health Questionnaire-2 (PHQ-2) screen.
Anxiety determined by a score of 3 or higher on the General Anxiety Disorder-2 (GAD-2) screen.
Dementia determined through both self-report and direct cognitive testing conducted by NHATS.
One year later, almost half of the newly-homebound cohort were either independent (22.8%) or semi-homebound (23.8%). Only 33.1% remained homebound, while 18% died and 2.2% had moved into a nursing home (Figure 1). Of those who recovered to be independent or semi-homebound after being newly homebound, a substantial proportion again became homebound in future years. By 2018, 11.1% of the incident homebound cohort with complete follow-up data were independent and 6.4% semi-homebound in the community, 13.5% were homebound in the community, 3.9% were residing in a nursing home, and 65.0% had died. Among individuals who did not die, the proportion homebound was relatively stable over time (for example, 40.4% of those alive were homebound in 2013, 38.6% of those alive were homebound in 2018). Note that there was significant loss to follow-up over time: of the 267 newly homebound older adults, 37 (13.9%) were lost to follow-up after 1 year, and 69 after 6 years (25.8%) (Table S2).
FIGURE 1.
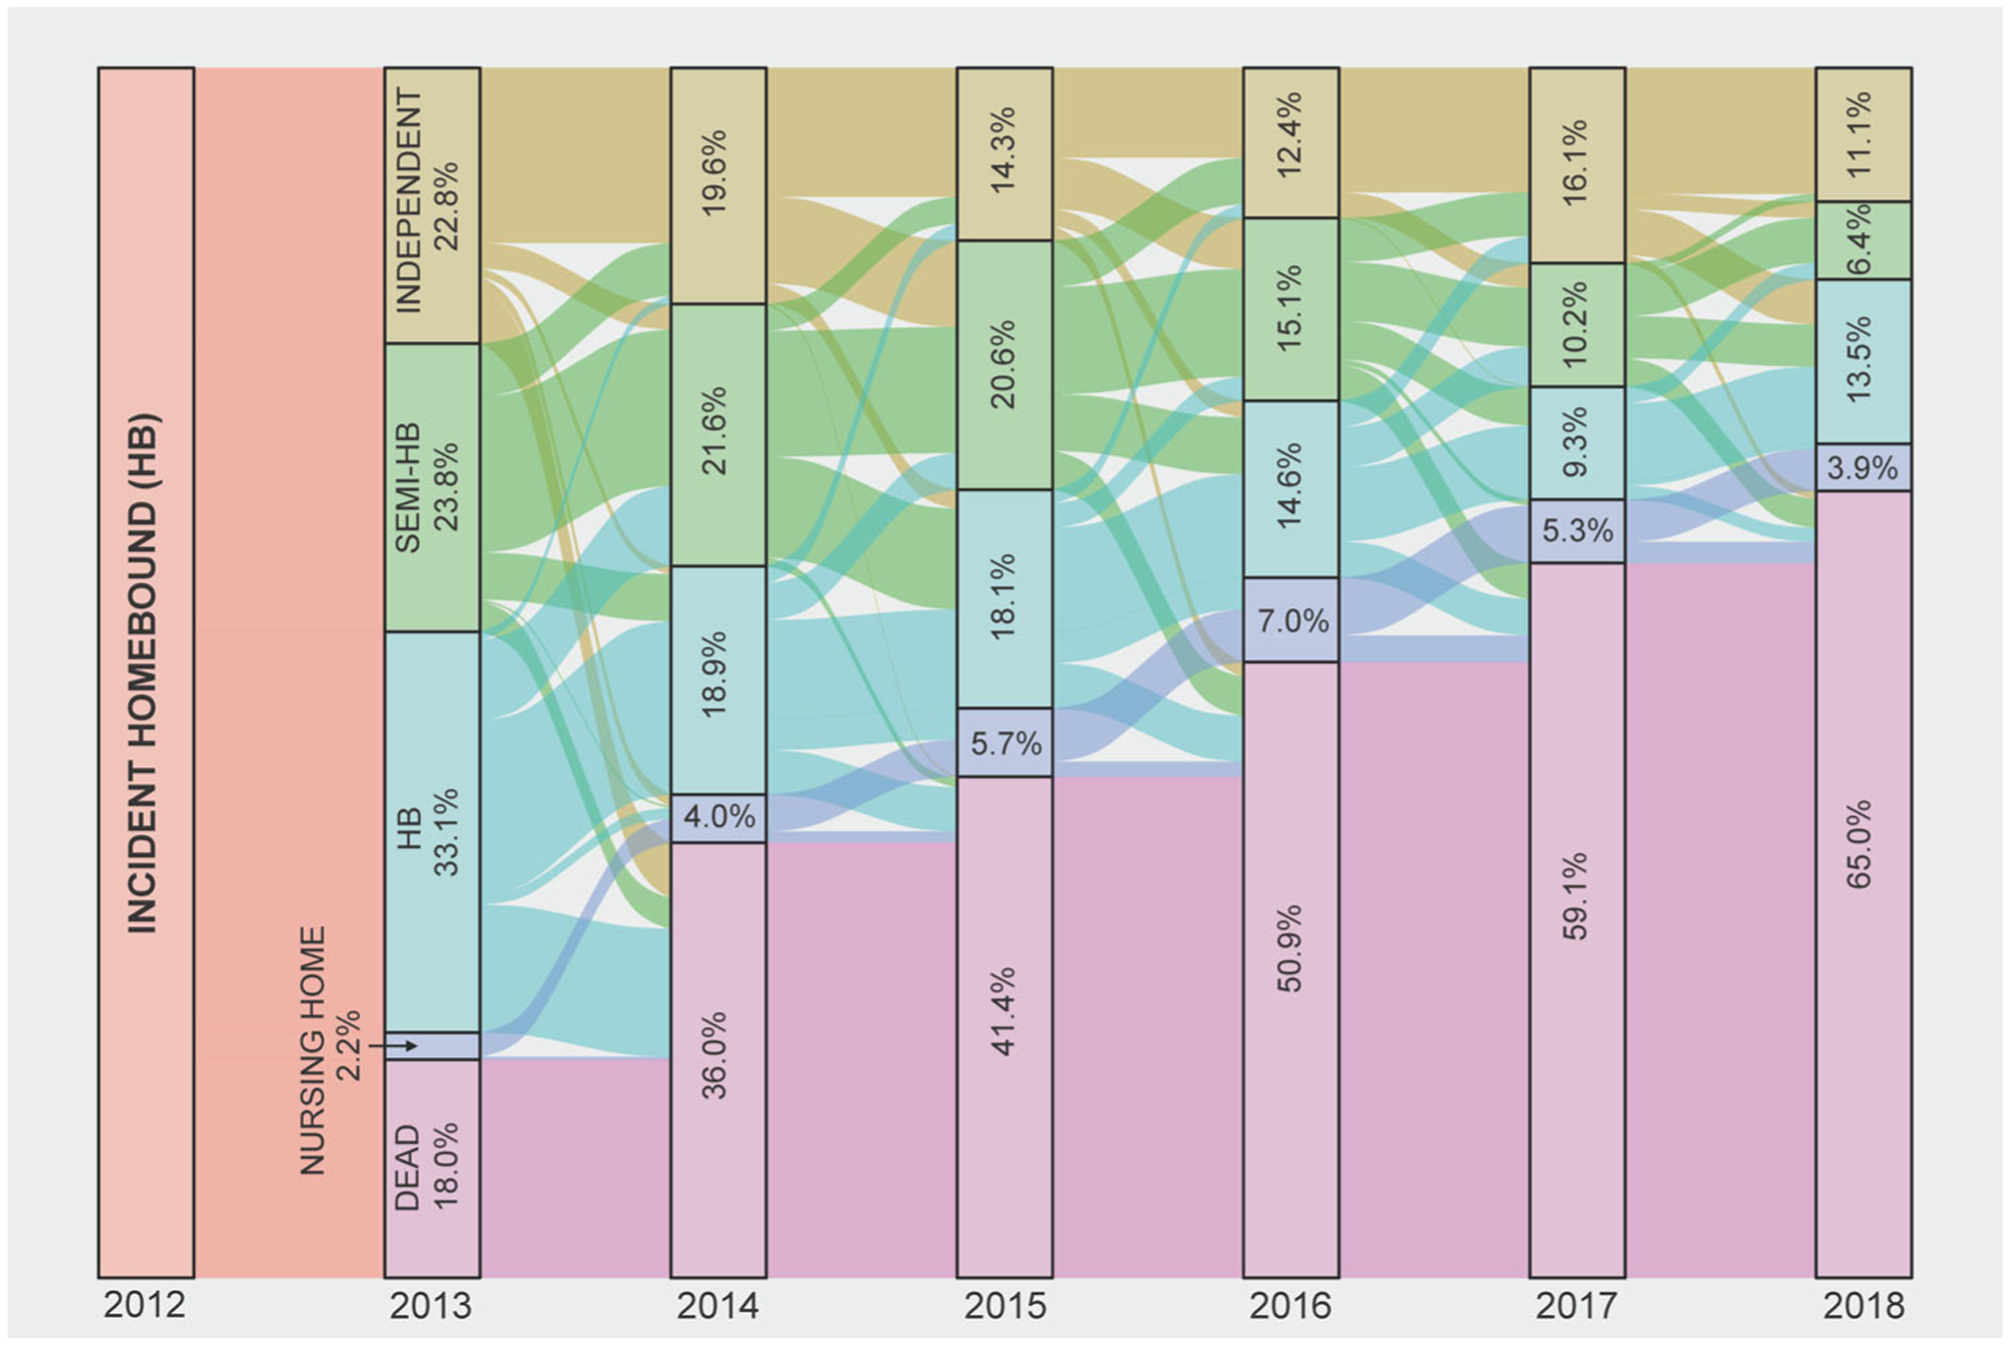
Homebound status 6 years after first report of homebound status (2013–2018). Source: National Health and Aging Trends Study, 2012–2018, N = 267. Independent: leaves home >1×/week without difficulty or receiving help; semi-HB (Homebound): community dwelling and leaves home >×/week but reports either difficulty and/or receiving help with leaving home; HB (homebound): community dwelling and leaves home never or rarely (1×/week); NH (nursing home): resides in a nursing home. All proportions adjusted to account for complex survey design and sampling approach
Table 2 depicts the 2012 characteristics of individuals by homebound and community-dwelling status 1 year after incident homebound, with those who remained homebound as the reference group. Those who recovered to be independent or semi-homebound were significantly younger than those who remained homebound (mean age of 77.7 vs 82.4, p < 0.01), had lower rates of receiving help with bathing (28.0% vs 46.6%, p < 0.05), and lower rates of receiving help with any IADLs (75.2% vs 90.0%, p < 0.05). Those who either moved into a nursing home or died were more likely to receive help with bathing (68.1% vs 46.6%, p < 0.05), more likely to receive help with ≥1 ADL (86.1% vs 65.0%, p < 0.01), and more likely to be depressed (51.7% vs 28.7%, p < 0.05). When imputing homebound status to account for loss to follow-up at 1 year follow-up, results did not substantially differ (Table S1).
TABLE 2.
Characteristics of individuals by homebound status 1 year after first report of incident homebound status (N = 230)
| Homebound, community-dwelling (reference) (N = 74) | Independent or Semi-homebound, community-dwelling (N = 98) | Nursing home resident or dead (N = 58) | |
|---|---|---|---|
| Age (mean) | 82.4 | 77.7** | 85.9* |
| Female | 73.9 | 70.3 | 74.0 |
| Race/ethnicity | |||
| White, Non-Hispanic | 76.2 | 66.3 | 77.8 |
| Black, Non-Hispanic | 9.1 | 13.5 | 11.0 |
| Hispanic | 9.0 | 17.8 | 8.8 |
| Other race/ethnicity | 2.4 | 2.4 | 1.5 |
| Married | 29.1 | 42.2 | 31.7 |
| Number of helpers (mean)a | 2.7 | 2.4 | 2.5 |
| Income below 100% FPLb | 36.2 | 35.7 | 39.3 |
| Proxy respondent | 23.7 | 16.8 | 47.5* |
| Enrolled in Medicaid | 25.8 | 31.5 | 17.4 |
| Residing in a metropolitan area | 85.2 | 88.7 | 93.0 |
| Geographic region | |||
| Northeast | 17.4 | 25.9 | 23.8 |
| Midwest | 22.5 | 20.4 | 12.8 |
| South | 43.6 | 33.2 | 33.3 |
| West | 16.6 | 20.5 | 30.1 |
| Health and function | |||
| Fair or poor self-reported health | 63.3 | 51.3 | 62.1 |
| Receives help with the below ADLs | |||
| Eating | 23.0 | 21.1 | 32.5 |
| Bathing | 46.6 | 28.0* | 68.1* |
| Toileting | 21.6 | 12.1 | 36.4 |
| Dressing | 45.4 | 34.2 | 59.0 |
| Walking inside | 43.6 | 31.7 | 60.2 |
| Transferring in/out of bed | 27.1 | 22.2 | 36.3 |
| Receives help with 1 ADLc | 65.0 | 50.7 | 86.1** |
| Receives help with 1 IADLd | 90.0 | 75.2* | 88.8 |
| Self-reported conditions (current or prior) | |||
| Heart attack | 24.9 | 27.9 | 20.0 |
| Stroke | 38.5 | 22.3 | 29.3 |
| Cancer | 19.2 | 24.2 | 36.4 |
| Heart disease | 28.6 | 23.7 | 37.3 |
| Hypertension | 78.2 | 73.7 | 80.7 |
| Diabetes mellitus | 29.3 | 32.7 | 27.9 |
| Lung disease | 20.4 | 26.6 | 24.0 |
| Depressione | 28.7 | 28.5 | 51.7* |
| Anxietyf | 26.5 | 27.4 | 38.4 |
| Probable dementiag | 52.6 | 35.8 | 63.5 |
Source: National Health and Aging Trends Study (NHATS) 2012–2013. Homebound is identified at survey wave 2 (2012).
For those receiving help for at least 1 ADL or IADL.
FPL: federal poverty limit.
ADL: activities of daily living (eating, bathing, toileting, dressing, walking inside, transferring in/out of bed).
IADL: instrumental activities of daily living (laundry, shopping, banking, meal preparation, taking medication).
Depression determined by a score of 3 or greater on the Patient Health Questionnaire-2 (PHQ-2) screen.
Anxiety determined by a score of 3 or higher on the General Anxiety Disorder-2 (GAD-2) screen.
Dementia determined through both self-report and direct cognitive testing conducted by NHATS.
p < 0.05.
p < 0.01, in comparison to the reference group (homebound) via t-test.
DISCUSSION
This study of a national sample of Medicare beneficiaries suggests that being homebound is a more dynamic state than previously assumed. While about half of incident homebound recovered the following year, many returned to being homebound over time, and mortality was high: more than half died within 4 years of becoming homebound and 65.0% died within 6 years of becoming homebound. Our findings may thus parallel the literature on functional disability, where recovery from disability is common but short-lasting.29 Interestingly, we did not find evidence that change in homebound status was driven by access to resources for help at home, for example, Medicaid enrollment that could pay for caregivers at home, marital status, and availability of help, although this should be studied further in larger samples.
Our results have important implications for policy makers and health systems. Becoming homebound is a predictor of poor prognosis and high mortality, even in those who initially recover. We need better approaches to promptly identify homebound older adults in need of medical and social care services and urgently provide supports such as home-based primary care, home-based palliative care, care management services, and multiple disciplines. Medicare policies need to reflect that high-risk older adults may experience transient episodes of being homebound, and so need to be flexible in their inclusion criteria and in services they provide. For example, both liberalizing the enrollment criteria for the Program for All-Inclusive Care for the Elderly (PACE) and expanding the program nationwide could better meet the medical and social needs of homebound older adults.30–33
There are several limitations to this study. While the NHATS allows us to follow a nationally-representative cohort, it surveys annually. We are therefore missing changes in homebound status between NHATS surveys, including brief episodes of being homebound such as seasonal patterns or weeks of being homebound after a musculoskeletal injury or fall. More research needs to assess outcomes for those with transient episodes of being homebound. This study is limited in that we also do not have the cause of becoming homebound. In addition, we defined newly homebound with a 1-year lookback in order to maintain a reasonable sample size. It is possible that some individuals were homebound before 2011 and thus are not truly “newly” homebound. Differential loss to follow-up is a concern in longitudinal studies, such as NHATS. While we used multiple imputation methods to account for missing homebound status, there may be bias, likely in the direction of sicker individuals being more likely to be lost to follow-up, even conditional on current homebound status and other observables. This would underestimate the proportion of individuals recovering or maintaining being homebound in the community. We did not impute missingness in homebound status in our descriptive analysis over 6 years, given this would have required relying on observed values from multiple waves back to predict future homebound status. Further work needs to evaluate the drivers of transitions between homebound states over time and also capture the range of home-based supports that may influence these transitions. Finally, while our definition of homebound is not the one used by Medicare to estimate service need. Medicare determines individuals to be homebound if they meet both of two criteria: (1) either they need supportive devices, special transportation or assistance to leave home OR leaving home is medically contraindicated; (2) they are unable to leave home AND leaving home requires a considerable and taxing effort.34 The definition we employ is more straightforward in that it is based on frequency of leaving home. It has been widely used in research and is grounded in prior evidence as to the function and independence of older adults.1
While the high levels of healthcare utilization, morbidity, and mortality that accompany being homebound have been well-studied,1,3,4 our research documents gaps in our understanding of the trajectory of being homebound and what might help more older adults either recover or remain in the community. It is possible that timely delivery of supports, including caregiver support, could meaningfully help those who are newly homebound either physically recover or achieve appropriate resources to enable them to function independently again. More research is needed to develop models that could both reduce mortality in this population and support those older adults who are newly homebound and are at the end of life. Given that only a small proportion of this population moves into nursing homes, appropriate care models need to center around the home and community; services should not necessarily be limited to those who are persistently homebound. Finally, further research must recognize that homebound status may be a dynamic state for many as compared to a static or final endpoint. It is critical that clinicians, health services researchers, and policy makers ensure that supportive services meet the fluctuating needs of older adults to help them remain in the community for longer.
Supplementary Material
Table S1: Details on imputation.
Table S2: Raw numbers for Sankey diagram.
Table S3: Logit model used for imputation.
Key Point.
Being homebound is a highly dynamic state: while approximately 40% of those newly homebound at least temporarily recover, overall mortality and recurrent decline is high
Why Does this Paper Matter?
Programs and policies to support home-based care need to be flexible to respond to intermittent homebound states of this population.
FINANCIAL DISCLOSURE
Dr. Ankuda is funded by the National Institute on Aging K76AG064427. Dr. Ornstein is funded by the National Institute on Aging R01AG060967. Dr. Ornstein and Dr. Ritchie are funded through the National Institute on Aging P01AG066605.
SPONSOR’S ROLE
The sponsors played no role in the study design, conduct, analysis, or manuscript preparation.
Footnotes
CONFLICT OF INTEREST
The authors report no conflicts of interest. Dr. Leff serves on the clinical advisory boards to MedZed, Honor, Dispatch Health, Medically Home, and Koko.
SUPPORTING INFORMATION
Additional supporting information may be found online in the Supporting Information section at the end of this article.
REFERENCES
- 1.Ornstein KA, Leff B, Covinsky KE, et al. Epidemiology of the homebound population in the United States. JAMA Intern Med. 2015;175(7):1180–1186. [DOI] [PMC free article] [PubMed] [Google Scholar]
- 2.Soones T, Federman A, Leff B, Siu AL, Ornstein K. Two-year mortality in homebound older adults: An analysis of the National Health and aging trends study. J Am Geriatr Soc. 2017;65(1):123–129. [DOI] [PMC free article] [PubMed] [Google Scholar]
- 3.Qiu WQ, Dean M, Liu T, et al. Physical and mental health of homebound older adults: an overlooked population. J Am Geriatr Soc. 2010;58(12):2423–2428. [DOI] [PMC free article] [PubMed] [Google Scholar]
- 4.Wajnberg A, Ornstein K, Zhang M, Smith KL, Soriano T. Symptom burden in chronically ill homebound individuals. J Am Geriatr Soc. 2013;61(1):126–131. [DOI] [PMC free article] [PubMed] [Google Scholar]
- 5.Xiang X, Brooks J. Correlates of depressive symptoms among homebound and semi-homebound older adults. J Gerontol Soc Work. 2017;60(3):201–214. [DOI] [PMC free article] [PubMed] [Google Scholar]
- 6.Major-Monfried H, DeCherrie LV, Wajnberg A, Zhang M, Kelley AS, Ornstein KA. Managing pain in chronically ill homebound patients through home-based primary and pallia tive care. Am J Hosp Palliat Care. 2019;36(4):333–338. [DOI] [PMC free article] [PubMed] [Google Scholar]
- 7.Xiang X, An R, Oh H. The bidirectional relationship between depressive symptoms and homebound status among older adults. J Gerontol B Psychol Sci Soc Sci. 2020;75 (2):357–366. [DOI] [PMC free article] [PubMed] [Google Scholar]
- 8.Leff B, Carlson CM, Saliba D, Ritchie C. The invisible homebound: setting quality-of-care standards for home-based primary and palliative care. Health Aff (Millwood). 2015;34(1): 21–29. [DOI] [PubMed] [Google Scholar]
- 9.Sakurai R, Yasunaga M, Nishi M, et al. Co-existence of social isolation and homebound status increase the risk of all-cause mortality. Int Psychogeriatr. 2019;31(5):703–711. [DOI] [PubMed] [Google Scholar]
- 10.Cudjoe TKM, Kotwal AA. “social distancing” amid a crisis in social isolation and loneliness. J Am Geriatr Soc. 2020;68(6): E27–E29. [DOI] [PMC free article] [PubMed] [Google Scholar]
- 11.Norman GJ, Wade AJ, Morris AM, Slaboda JC. Home and community-based services coordination for homebound older adults in home-based primary care. BMC Geriatr. 2018;18(1):241. [DOI] [PMC free article] [PubMed] [Google Scholar]
- 12.Stall N, Nowaczynski M, Sinha SK. Systematic review of out comes from home-based primary care programs for homebound older adults. J Am Geriatr Soc. 2014;62(12):2243–2251. [DOI] [PubMed] [Google Scholar]
- 13.Beales JL, Edes T. Veteran’s affairs home based primary care. Clin Geriatr Med. 2009;25(1):149–154.viii-ix. [DOI] [PubMed] [Google Scholar]
- 14.Schuchman M, Fain M, Cornwell T. The resurgence of home-based primary care models in the United States. Geriatrics (Basel). 2018;3(3):41–51. [DOI] [PMC free article] [PubMed] [Google Scholar]
- 15.Leff B, Burton L, Mader SL, et al. Hospital at home: feasibility and outcomes of a program to provide hospital-level care at home for acutely ill older patients. Ann Intern Med. 2005;143 (11):798–808. [DOI] [PubMed] [Google Scholar]
- 16.DeJonge KE, Taler G, Boling PA. Independence at home: community-based care for older adults with severe chronic ill ness. Clin Geriatr Med. 2009;25(1):155–169.ix. [DOI] [PubMed] [Google Scholar]
- 17.Rotenberg J, Kinosian B, Boling P, Taler G, Independence at Home Learning Collaborative Writing Group. Home-based pri mary care: beyond extension of the Independence at home demonstration. J Am Geriatr Soc. 2018;66(4):812–817. [DOI] [PubMed] [Google Scholar]
- 18.De Jonge KE, Jamshed N, Gilden D, Kubisiak J, Bruce SR, Taler G. Effects of home-based primary care on Medicare costs in high-risk elders. J Am Geriatr Soc. 2014;62(10):1825–1831. [DOI] [PubMed] [Google Scholar]
- 19.Edes T, Kinosian B, Vuckovic NH, Nichols LO, Becker MM, Hossain M. Better access, quality, and cost for clinically com plex veterans with home-based primary care. J Am Geriatr Soc. 2014;62(10):1954–1961. [DOI] [PubMed] [Google Scholar]
- 20.Federman AD, Soones T, DeCherrie LV, Leff B, Siu AL. Associ ation of a bundled hospital-at-home and 30-day Postacute transitional care program with clinical outcomes and patient experiences. JAMA Intern Med. 2018;178(8):1033–1040. [DOI] [PMC free article] [PubMed] [Google Scholar]
- 21.Miller NA, Kirk A. Predicting state investment in medicaid home- and community-based services, 2000–2011. J Aging Soc Policy. 2016;28(1):49–64. [DOI] [PubMed] [Google Scholar]
- 22.Gifford K, Ellis E, Lashbrook A, Nardone MA. View from the States: Key Medicaid Policy Changes. San Francisco, CA: Kaiser Family Foundation; 2019. [Google Scholar]
- 23.Volpp KG, Diamond SM, Shrank WH. Innovation in home care: time for a new payment model. JAMA. 2020;323(24):2474–2475. [DOI] [PubMed] [Google Scholar]
- 24.Xiang X, Chen J, Kim M. Trajectories of homebound status in Medicare beneficiaries aged 65 and older. Gerontologist. 2020; 60(1):101–111. [DOI] [PMC free article] [PubMed] [Google Scholar]
- 25.Ornstein KA, Garrido MM, Bollens-Lund E, et al. The associa tion between income and incident homebound status among older Medicare beneficiaries. J Am Geriatr Soc. 2020;68:2594–2601. [DOI] [PMC free article] [PubMed] [Google Scholar]
- 26.Freedman VA, Profile KJDC. The National Health and aging trends study (NHATS). Int J Epidemiol. 2019;48(4):1044–1045g. [DOI] [PMC free article] [PubMed] [Google Scholar]
- 27.Kasper JD, Freedman VA, Spillman B. Classification of Persons by Dementia Status in the National Health and Aging Trends Study. Technical Paper #5. Baltimore, MD: Johns Hopkins School of Public Health; 2013. [Google Scholar]
- 28.Lamer A, Laurent G, Pelayo S, El Amrani M, Chazard E, Marcilly R. Exploring patient path through Sankey diagram: a proof of concept. Stud Health Technol Inform. 2020;270: 218–222. [DOI] [PubMed] [Google Scholar]
- 29.Hardy SE, Gill TM. Recovery from disability among community-dwelling older persons. JAMA. 2004;291(13):1596–1602. [DOI] [PubMed] [Google Scholar]
- 30.Cortes TA, Sullivan-Marx EM. A case exemplar for National Policy Leadership: expanding program of all-inclusive Care for the Elderly (PACE). J Gerontol Nurs. 2016;42(3):9–14. [DOI] [PubMed] [Google Scholar]
- 31.Eng C, Pedulla J, Eleazer GP, McCann R, Fox N. Program of all-inclusive Care for the Elderly (PACE): an innovative model of integrated geriatric care and financing. J Am Geriatr Soc. 1997;45(2):223–232. [DOI] [PubMed] [Google Scholar]
- 32.Gyurmey T, Kwiatkowski J. Program of all-inclusive Care for the Elderly (PACE): integrating health and social care since 1973. Rhode Island Med J. 2019;102(5):30–32. [PubMed] [Google Scholar]
- 33.Segelman M, Szydlowski J, Kinosian B, et al. Hospitalizations in the program of all-inclusive care for the elderly. J Am Geriatr Soc. 2014;62(2):320–324. [DOI] [PubMed] [Google Scholar]
- 34.Services CfMM. In: Services DoHaH, ed. Medicare & Home Health Care; 2020:1–32. [Google Scholar]
Associated Data
This section collects any data citations, data availability statements, or supplementary materials included in this article.
Supplementary Materials
Table S1: Details on imputation.
Table S2: Raw numbers for Sankey diagram.
Table S3: Logit model used for imputation.