Abstract
Electrophysiological alterations may represent a neural substrate of impaired neurocognitive processes and other phenotypic features in Fragile X Syndrome (FXS). However, the role of biological sex in electroencephalography (EEG) patterns that differentiate FXS from typical development has not been determined. This limits use of EEG in both the search for biomarkers of impairment in FXS as well as application of those markers to enhance our understanding of underlying neural mechanisms to speed treatment discovery. We investigated topographical relative EEG power in participants at rest in a sample of males and females with FXS and in age- and sex-matched typically developing controls (TDC) using a cluster-based analysis. While alterations in theta and low beta power were similar across males and females in FXS, relative power varied by sex in the alpha, upper beta, gamma, and epsilon frequency bands. Follow up analyses showed that Individual Alpha Peak Frequency (IAPF), a continuous variable that may capture atypicalities across the theta and alpha ranges in neurodevelopmental disorders, also varied by sex. Finally, performance on an auditory filtering task correlated with theta power in males, but not females with FXS. The impact of biological sex on resting state EEG power differences in FXS is discussed as it relates to potential GABAergic and glutamatergic etiologies of neurocognitive deficits in FXS.
Keywords: relative EEG power, Fragile X Syndrome, Sex differences, EEG gamma power, EEG theta power, FMRP
Introduction
Across neurodevelopmental disorders, diagnostic prevalence and clinical phenotypes vary based on biological sex (Tesic et al., 2019). This is particularly the case in X-linked disorders, such as Fragile X Syndrome (FXS, Bartholomay, Lee, Bruno, Lightbody, & Reiss, 2019). However, the role of biological sex in EEG power differences in FXS is not yet well characterized, despite interest in using EEG power as a marker for disease processes. Investigation of the role of sex in EEG markers is supported by studies in typical development, which show that relative resting EEG power not only varies by sex but has different developmental trajectories based on sex (Benninger, Matthis, & Scheffner, 1984; Clarke, Barry, McCarthy, & Selikowitz, 2001; Cragg et al., 2011; Gasser, Verleger, Bacher, & Sroka, 1988; Gmehlin et al., 2011; Harmony, Marosi, Diaz de Leon, Becker, & Fernandez, 1990; Matthis, Scheffner, Benninger, Lipinski, & Stolzis, 1980; Nikulin & Brismar, 2005). Whether males and females with FXS show similar EEG power alterations, and how these EEG markers are related to the clinical phenotype in FXS, are unknown at this time.
FXS is an X-linked CGG-triple repeat disorder in which fragile X mental retardation protein (FMRP) production is silenced on the affected allele due to gene methylation. Males with FXS have a single X chromosome that is affected, whereas females with FXS are obligate mosaics with only one affected X chromosome with variable expression as a result of lyonization. Therefore, neurobehavioral deficits, including cognitive impairment and behavioral concerns, are typically less pronounced in females (Bartholomay et al., 2019). Presumably, this is due to a protective effect of FMRP expression from unaffected alleles. To minimize heterogeneity, prior FXS EEG research (including human and animal studies) has either excluded females from research or have been underpowered to address sex differences (Arbab, Battaglia, Pennartz, & Bosman, 2018; Ethridge et al., 2016; Gibson, Bartley, Hays, & Huber, 2008; Lovelace, Ethell, Binder, & Razak, 2018; van der Molen, Stam, & van der Molen, 2014).
What do we know about sex differences in EEG in FXS?
High density resting EEG patterns in humans with FXS have been investigated primarily by two groups. Van der Molen and colleagues (van der Molen et al., 2014; Van der Molen & Van der Molen, 2013) completed two studies in FXS with male participants only, whereas Wang and colleagues’ 2017 report included both males and females with FXS (Wang et al., 2017). In their sample of 15 males and 6 females with FXS compared to 15 males and 6 females with typical development, Wang and colleagues showed greater gamma band power, increased spatial spreading of gamma power, and altered gamma coupling in FXS. Further, they determined that the significant differences in EEG patterns found between the FXS and control groups were maintained within the sample of males alone compared to the sample of males with typical development. They did not find any sex differences within the FXS group in their sample, although the small female sample likely limited power to detect sex-related variation. Similarly, low numbers of female participants studied to date limit the ability to determine sex differences in clinical correlations with EEG features.
The present study
Here, we investigate sex differences on resting EEG power in FXS compared to age-matched, same-sex typically developing controls (TDC). We use EEG measures that have been shown to be minimally affected by differences in brain volume and skull thickness, two anatomical features that can spuriously drive or hide sex differences (Hagemann, Hewig, Walter, & Naumann, 2008; Somsen, van’t Klooster, van der Molen, van Leeuwen, & Licht, 1997). Specifically, we compare sex differences in relative power by frequency band and follow up with an investigation of individual alpha peak frequency (IAPF); both measures are shown to be altered in neurodevelopmental disorders (Abigail Dickinson, DiStefano, Senturk, & Jeste, 2018; A. Dickinson, Varcin, Sahin, Nelson, & Jeste, 2019; Wang et al., 2013; Wang et al., 2017).
We have based hypotheses on sex differences in FXS on these EEG measures on the extant literature on FMRP and neural hyperexcitability. Specifically, loss of FMRP, as studied in the Fmr1 knockout mouse, leads to hyperexcitable microcircuits and elevations in gamma oscillations (Gibson et al., 2008; Goswami, Cavalier, Sridhar, Huber, & Gibson, 2019; Jonak, Lovelace, Ethell, Razak, & Binder, 2020). Thus, we hypothesized that females with FXS would show fewer alterations in relative EEG power than full mutation males with FXS, paralleling the less severe female FXS clinical phenotype. Since males with FXS show higher relative theta and gamma power alongside lower alpha power when compared with typical controls (Van der Molen & Van der Molen, 2013; Wang et al., 2017), we predicted that females with FXS would demonstrate an intermediate EEG phenotype relative to males with FXS and controls. We hypothesize that increased theta and gamma and decreased alpha power will be associated with symptom severity in both males and females with FXS (e.g., those seen in Wang et al., 2017). These findings would support the hypothesis that variations in FMRP expression, driven by sex differences, are associated with EEG abnormalities, like behavioral and clinical features (Budimirovic et al., 2020). Further, they would offer insight on the development of EEG markers that may be used as clinical trial outcomes (Budimirovic et al., 2017; Ewen, Sweeney, & Potter, 2019). Finally, these findings could inform investigations of therapeutics targeting GABAergic and glutamatergic dysregulation in FXS, including differential response in males versus females with the disorder.
Material and Methods
This study was approved by the Institutional Review Board at Cincinnati Children’s Hospital Medical Center. All study participants or their legal guardians provided written (or verbal, when deemed appropriate) consent as required by the Declaration of Helsinki prior to engaging in study activities.
Participants were 28 males and 23 females with FXS who completed the research EEG visit and generated usable EEG data (mean age=21.83 years, SD=9.81, range=6.45–45.7) and 29 males and 19 females with typical development (TDC, mean age=23.89 years, SD=12.86, range=5.92–56.0, see Table 1 for demographic variables). Participants in the FXS group were recruited through a federally established regional FXS center at a tertiary hospital center. TDC subjects were recruited internally through the hospital and from the local community through internet-based fliers and had no known history of neuropsychiatric or neurodevelopmental diagnoses prior to study involvement via self-report. Participants in the FXS group had full mutation FXS (i.e., greater than 200 CGG repeats) in the promoter region of the FMR1 gene with at least partial gene methylation as determined by Southern Blot and PCR analysis. Individuals with FXS with active seizure disorder were excluded from this sample given potential and/or unknown effects of these conditions and medications on resting EEG patterns. Subjects with FXS who were at a stable dose (>4 weeks) of psychotropic medications were included in the FXS group. This included individuals taking atypical antipsychotics (n=16, 4 female), antidepressants (n=27, 8 female), benzodiazepine sleep aids (2, 0 female), and non-benzodiazepine sleep aids (n=11, 4 female).
Table 1.
Demographic data for individuals with useable EEG data including the typically developing controls (TDC) and individuals with Fragile X Syndrome (FXS). Deviation IQwas based on the Stanford Binet-5 with correction to account for floor effects seen in individuals with developmental disabilities (Stephanie M. Sansone et al., 2014).
| Age in years | Group |
Between Group Comparison | p-value (adjusted) | ||
|---|---|---|---|---|---|
| FXS mean (SD) |
TDC mean (SD) |
||||
| [range] | [range] | ||||
| Sex | Male | 24.09 (9.88) | 23.57 (10.14) | t= .20 | p = .85 |
| [6.68–45.71] | [5.92–43.5] | (.99) | |||
| Female | 19.08 (9.2) | 24.38 (16.48) | t= −1.32 | p = .20 | |
| [6.45–42.87] | [6.38–56.03] | (.98) | |||
| Within Group Comparison | t= 1.86 | t= −.21 | |||
| p-value (adjusted) | p = .07 (.75) | p = .84 (.99) | |||
| Deviation IQ | |||||
| Sex | Male | 30.99 (17.85) | 106.14 | t= −19.29 | p < .0001 |
| (10.45) | (.006)* | ||||
| [−.3–81.03] | [88.97–134.2] | ||||
| Female | 61.2 (30.12) | 98.76 (8.59) | t= −5.25 | p < .0001 | |
| [−10.78–92.14] | [79.48–114.2] | (.006)* | |||
| Within Group Comparison | t= −4.30 | t= 2.56 | |||
| p-value (adjusted) | p < .0001 (.006)* | p = .014 (.27) | |||
denotes statistical significance at fdr adjusted p < .05.
Measures included assessments of cognitive, adaptive, psychiatric, and social functioning. Intellectual functioning was measured with the abbreviated Stanford Binet-5th edition (SB-5, Roid & Pomplun, 2012), with scores for individuals in both FXS and TDC groups converted to Deviation IQ scores (DQ). DQ scores, which utilize individual z-scores based on population norms rather than standard scores, reduce floor effects present for individuals with severe cognitive impairments and preserve individual variability (Sansone et al., 2014). This was supplemented by tasks targeting basic attention and sensory processing impairments in FXS, including the Alertness subtest of the computerized Test of Attentional Performance for Children (KiTAP, Zimmermann, Gondan, & Fimm, 2004) and the Auditory Attention subtest of the Woodcock Johnson Tests of Cognitive Abilities (Woodcock, McGrew, & Mather, 2001). Adaptive, psychiatric, and social functioning were measured via parent report with the Vineland Adaptive Behavior Scales, 2nd edition(VABS-2, Sparrow, Cicchetti, & Balla, 2008), the Aberrant Behavior Checklist with subscale scores calculated via Sansone et al.’s FXS-sample based factor analysis (Aman, Singh, Stewart, & Field, 1985; Sansone et al., 2012), and the Social Communication Questionnaire (SCQ, Rutter, Bailey, & Lord, 2003). Differences between males and females with FXS on these measures is detailed in Table 2.
Table 2.
Clinical characteristics of males and females in the FXS group. ABC scales are those adjusted to reflect factor groupings seen in FXS (S. M. Sansone et al., 2012).
| Measure | N (M: F) | Male mean (SD) [range] | Female mean (SD) [range] | Statistic | p-value (adjusted) |
|---|---|---|---|---|---|
| SCQ total | 26:20 | 16.81 | 9.35 (6.47) | t = | p = .0004 |
| (6.62) | −3.82 | (.014)* | |||
| [6–29] | [0–26] | ||||
| Vineland (VABS- | 24:18 | 48.29 | 70.61 | t = 3.97 | p = .0003 |
| 2) Composite | (15.07) | (21.42) | (.012)* | ||
| [20–83] | [28–125] | ||||
| ABC Irritability | 27:20 | 16.63 | 8.8 (10.32) | t = | p = .018 |
| (11.06) | [0–38] | −2.47 | (.31) | ||
| [0–43] | |||||
| ABC Social | 27:20 | 7.15 | 5.1 (6.03) | t = | p = .19 |
| Withdrawal | (4.72) | [0–23] | −1.31 | (.98) | |
| [0–18] | |||||
| ABC Stereotypy | 27:20 | 6.59 (5) | 2.1 (3.99) | t = | p = .0018 |
| [0–15] | [0–16] | −3.31 | (.05)* | ||
| ABC | 27:20 | 12.56 | 5.1 (4.78) | t = | p = .00017 |
| Hyperactivity | (6.99) | −4.11 | (.017)* | ||
| [1–25] | [0–16] | ||||
| ABC | 27:20 | 6.07 | 2.35 (2.46) | t = | p = .0001 |
| Inappropriate | (3.04) | −4.50 | (.006)* | ||
| Speech | [1–12] | [0–8] | |||
| ABC Social | 27:20 | 3.41 (3.1) | 4.2 (5.86) | t = .60 | p = .55 |
| Avoidance | [0–12] | [0–23] | (.98) | ||
denotes statistical significance at p < .05.
E E G recording. Continuous EEG was recorded during a 5-minute eyes-open resting period during which participants watched a silent video to ensure compliance and reduce movement artifact as is consistent with previous studies (Orekhova et al., 2014; Wang et al., 2017). Recordings were made with a Phillips/EGI NetAmp 400 system (Eugene, Oregon, USA) using a 128-channel Hydrocel saline-based electrode net sampled at 1000 hz. All contact impedances were kept below 10 kOhms.
E E G processing. Data were blinded with respect to sex and diagnosis. To facilitate comparison with previous work, EEG data were processed as previously reported by our laboratory (Wang et al., 2017). In short, data were filtered first with a high-pass 0.5 Hz filter, then a 120 Hz low pass filter, with a notch filter between 57 and 63 Hz. Data was resampled to 500 Hz. Noisy channels were identified and interpolated. If more than 10% of channels were identified for interpolation in a dataset, the dataset was excluded from analysis. Data were manually reviewed, and large artifacts were removed continuously prior to independent component analysis (ICA). Data were segmented into 2-second epochs. ICA (extended infomax algorithm (Lee, Girolami, & Sejnowski, 1999)) was performed for artifact identification. In addition to EOG and cardiac activity, ICA components consistent with muscular activity was identified and removed to ensure greater than 60-seconds of artifact-free data. Channels with high EMG noise, including those on the face and neck, were excluded across all subjects, leaving 108 scalp EEG channels as the focus of all subsequent data analysis.
Artifact-free amplitude time series data underwent Fast Fourier Transform in MATLAB (version 2018a, The Mathworks, Natick, MA). Mean relative band power (RBP) was calculated from relative power calculated from each epoch across 9 frequency bands (delta=.5–3.5 Hz, theta=4–7.5 Hz, low alpha= 8–10 Hz, high alpha= 10.5–12.5 Hz, low beta= 13–20 Hz, high beta= 20.5–30 Hz, low gamma= 30.5–58 Hz, high gamma= 62–100 Hz, epsilon= 100.5–110 Hz). RBP represents the accumulated power within each band normalized by the sum of power across all frequency bands, which reduces effects of individual biological factors (e.g., skull thickness and brain volume) on power estimates. Subject-level RBP averages were then calculated across all epochs for each electrode.
Data Analysis. Group and sex-level demographic data were compared via independent samples t-tests with fdr-adjusted p-values. A cluster-based permutation test (Maris & Oostenveld, 2007) was applied to extract significant differences in electrode RBP for each frequency band with a Bonferroni correction for multiple comparisons. Cluster-based permutation tests of electrode RBP were completed by sex within group (FXS, TDC) and by group within sex (males, females). Relationships between clinical measures and the natural log of relative power by frequency band within significant clusters (i.e., within males and females separately with FXS) were evaluated in R via linear mixed effects modeling (lme4, Bates, Maechler, Bolker, & Walker, 2015). Specifically, individual scores on clinical measures predicted relative power while subject ID was entered as a random factor to control for the multiple electrodes measured per individual. Because subject ID is entered as a random factor and is controlled for, we report rpartial2, which captures the correlation remaining after the random factor is accounted for. When determining relations between clinical variables and EEG measures, we corrected for multiple comparisons using the p.adjust function in R, with method set to “fdr” (Benjamini & Hochberg, 1995) and with corrections across all comparisons made for both m ales and females.
Individual Alpha Peak Frequency (IA PF) was determined via submitting relative power spectrum for each individual participant averaged across epochs to the MA TLAB “find peaks” algorithm, which identifies local maxim a, for the frequency range 6–14 H z (Scally, Burke, Bunce, & Delvenne, 2018). The effects of sex on IA PF were analyzed via generalized linear model in R using the native glm package with a Gaussian error distribution.
Results
Demographics
Males with FXS had low er Deviation IQs than fem ales with FX S, but did not vary significantly in age. TDC males and fem ales did not vary by age or Deviation IQ after controlling for multiple comparisons. Males and Females with FXS both had lower Deviation IQs than their same-sex counterparts.
For comparison on clinical measures between males and females with FXS, see Table 2.
Fig. 1.
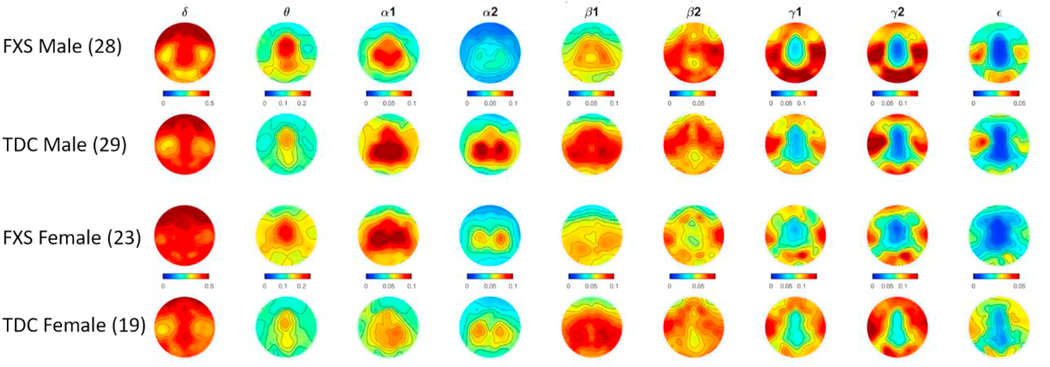
Topographic heat plots depicting relative EEG power by frequency band by sex and group. Warmer colors indicate greater relative power and cooler colors represent relative power approaching zero. Left side of each plot indicates participant’s left side.
Fig. 2.
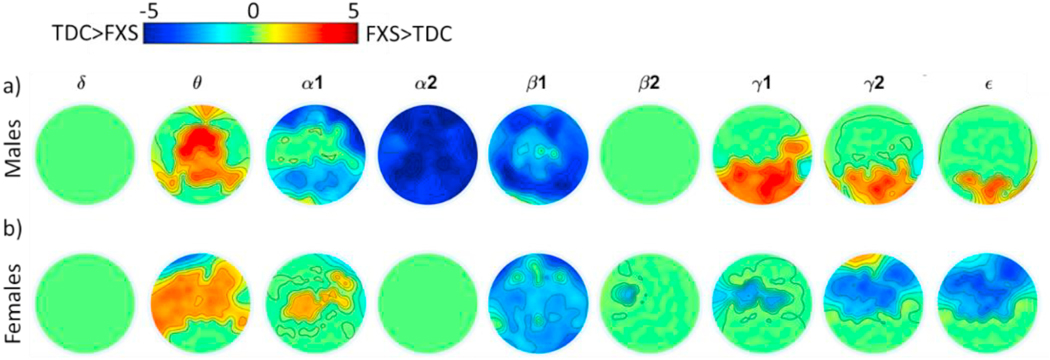
Clusters of significant differences (FXS- TDC) by group within males (a) and females (b). Clusters were identified within frequency bands and p-values Bonferroni adjusted for number of bands. Heatmap colors represent FXS-TDC cluster t-scores reaching statistical significance, i.e., warmer colors indicate FXS > TDC and cooler colors indicate TDC < FXS. Green indicates no statistical significance.
Fig. 3.
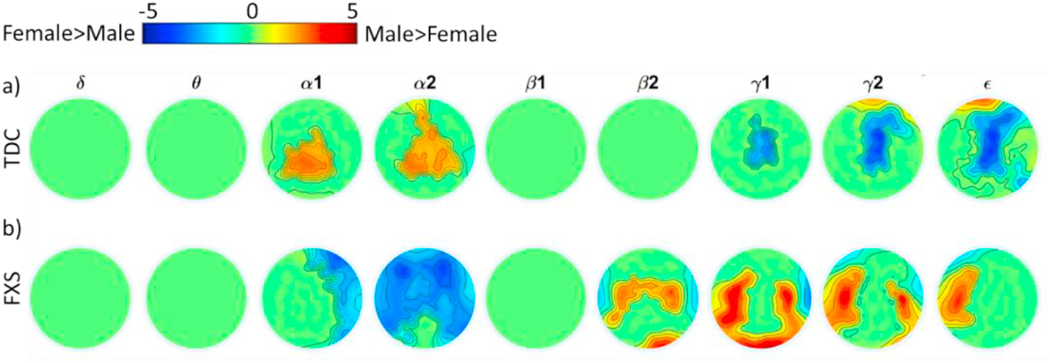
Clusters of significant differences by sex within TDC (a) and FXS (b) groups. Clusters were identified within frequency bands. Heatmap values represent t- scores for differences between males and females at each electrode.
Fig. 4.
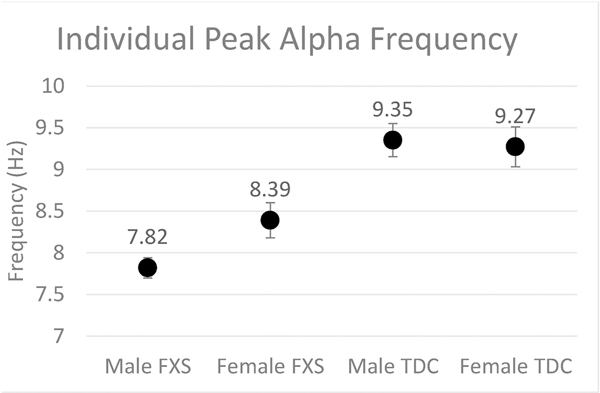
Group-level scatter plot of mean Individual Peak Alpha Frequency (IAPF) by group and sex. Error bars indicate standard error of the mean.
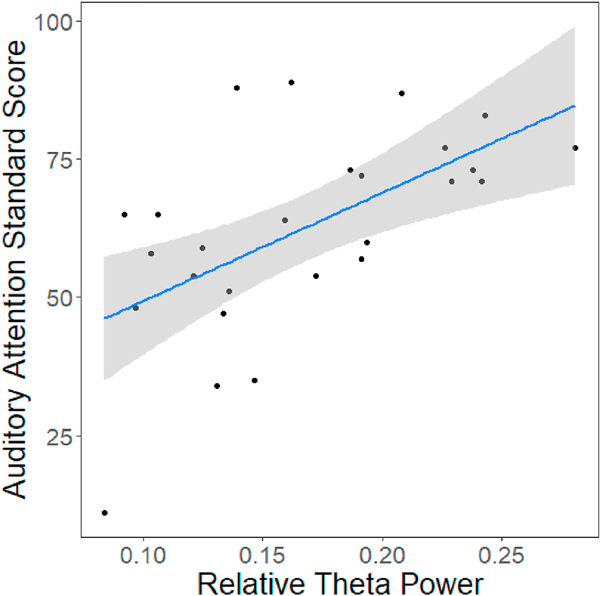
Fig. 5.
Significant correlation between relative theta power and performance on the auditory attention task in males with FXS (t(24) = 3.53, p = .0017, = 0.34, p (adjusted) = 0.05). Grey area represents 95% confidence interval.
Acknowledgments
Conflicts of Interests: C.E. Has received current or past funding from Confluence Pharmaceuticals, Novartis, F. Hoffmann-La Roche Ltd., Seaside Therapeutics, Riovant Sciences, Inc., Fulcrum Therapeutics, Neuren Pharmaceuticals Ltd., Alcobra Pharmaceuticals, Neurotrope, Zynerba Pharmaceuticals, Inc., Zynerba, Stalicla, Impel, Encoded, and Ovid Therapeutics Inc. to consult on trial design or development strategies and/or conduct clinical trials or biomarker studies in neurodevelopmental disorders. C.E. is additionally the inventor or co-inventor on several patents held by Cincinnati Children’s Hospital Medical Center or Indiana University School of Medicine describing methods of treatment in FXS or other neurodevelopmental disorders. C.E. is employed by the Cincinnati Children’ Hospital Medical Center.
J.S. has received current or past funding from VeriSci to consult on research design.
Footnotes
No other authors have competing interests to disclose.
Publisher's Disclaimer: This is a PDF file of an unedited manuscript that has been accepted for publication. As a service to our customers we are providing this early version of the manuscript. The manuscript will undergo copyediting, typesetting, and review of the resulting proof before it is published in its final form. Please note that during the production process errors may be discovered which could affect the content, and all legal disclaimers that apply to the journal pertain.
References
- Aman MG, Singh NN, Stewart AW, Field CJ, 1985. The aberrant behavior checklist: a behavior rating scale for the assessment of treatment effects. Am. J. Ment. Defic. 89 (5), 485–491. [PubMed] [Google Scholar]
- Arbab T, Battaglia FP, Pennartz CMA, Bosman CA, 2018. Abnormal hippocampal theta and gamma hypersynchrony produces network and spike timing disturbances in the Fmr1-KO mouse model of Fragile X syndrome. Neurobiol. Dis. 114, 65–73. 10.1016/j.nbd.2018.02.011. [DOI] [PubMed] [Google Scholar]
- Bartholomay KL, Lee CH, Bruno JL, Lightbody AA, Reiss AL, 2019. Closing the gender gap in Fragile X Syndrome: review on females with FXS and preliminary research findings. Brain Sci. 9 (1), 11. 10.3390/brainsci9010011. [DOI] [PMC free article] [PubMed] [Google Scholar]
- Bates D, Maechler M, Bolker B, Walker S, 2015. Fitting linear mixed-effects models using lme4. J. Stat. Software 67 (1), 1–48. 10.18637/jss.v067.i01. [DOI] [Google Scholar]
- Bear MF, Huber KM, Warren ST, 2004. The mGluR theory of fragile X mental retardation. Trends Neurosci. 27 (7), 370–377. 10.1016/j.tins.2004.04.009. [DOI] [PubMed] [Google Scholar]
- Benjamini Y, Hochberg Y, 1995. Controlling the false discovery rate: a practical and powerful approach to multiple testing. J. Roy. Stat. Soc. B 57 (1), 289–300. Retrieved from. http://www.jstor.org/stable/2346101. [Google Scholar]
- Benninger C, Matthis P, Scheffner D, 1984. EEG development of healthy boys and girls. Results of a longitudinal study. Electroencephalogr. Clin. Neurophysiol. 57 (1), 1–12. 10.1016/0013-4694(84)90002-6. [DOI] [PubMed] [Google Scholar]
- Budimirovic DB, Berry-Kravis E, Erickson CA, Hall SS, Hessl D, Reiss AL, Kaufmann WE, 2017. Updated report on tools to measure outcomes of clinical trials in fragile X syndrome. J. Neurodev. Disord. 9, 14. 10.1186/s11689-017-9193-x. [DOI] [PMC free article] [PubMed] [Google Scholar]
- Budimirovic DB, Schlageter A, Filipovic-Sadic S, Protic DD, Bram E, Mahone EM, Latham GJ, 2020. A genotype-phenotype study of high-resolution FMR1 nucleic acid and protein analyses in fragile X patients with neurobehavioral assessments. Brain Sci. 10 (10) 10.3390/brainsci10100694. [DOI] [PMC free article] [PubMed] [Google Scholar]
- Cea-Del Rio CA, Huntsman MM, 2014. The contribution of inhibitory interneurons to circuit dysfunction in Fragile X Syndrome. Front. Cell. Neurosci. 8 (245) 10.3389/fncel.2014.00245. [DOI] [PMC free article] [PubMed] [Google Scholar]
- Clarke AR, Barry RJ, McCarthy R, Selikowitz M, 2001. Age and sex effects in the EEG: development of the normal child. Clin. Neurophysiol. 112 (5), 806–814. 10.1016/S1388-2457(01)00488-6. [DOI] [PubMed] [Google Scholar]
- Contractor A, Klyachko Vitaly A., Portera-Cailliau C, 2015. Altered neuronal and circuit excitability in fragile X syndrome. Neuron 87 (4), 699–715. 10.1016/j.neuron.2015.06.017. [DOI] [PMC free article] [PubMed] [Google Scholar]
- Cragg L, Kovacevic N, McIntosh AR, Poulsen C, Martinu K, Leonard G, Paus T, 2011. Maturation of EEG power spectra in early adolescence: a longitudinal study. Dev. Sci. 14 (5), 935–943. 10.1111/j.1467-7687.2010.01031.x. [DOI] [PubMed] [Google Scholar]
- Deng PY, Rotman Z, Blundon JA, Cho Y, Cui J, Cavalli V, Klyachko VA, 2013. FMRP regulates neurotransmitter release and synaptic information transmission by modulating action potential duration via BK channels. Neuron 77 (4), 696–711. 10.1016/j.neuron.2012.12.018. [DOI] [PMC free article] [PubMed] [Google Scholar]
- Dickinson A, DiStefano C, Senturk D, Jeste SS, 2018. Peak alpha frequency is a neural marker of cognitive function across the autism spectrum. Eur. J. Neurosci. 47 (6), 643–651. 10.1111/ejn.13645. [DOI] [PMC free article] [PubMed] [Google Scholar]
- Dickinson A, Varcin KJ, Sahin M, Nelson CA 3rd, Jeste SS, 2019. Early patterns of functional brain development associated with autism spectrum disorder in tuberous sclerosis complex. Autism Res. 12 (12), 1758–1773. 10.1002/aur.2193. [DOI] [PMC free article] [PubMed] [Google Scholar]
- Ethridge LE, White SP, Mosconi MW, Wang J, Byerly MJ, Sweeney JA, 2016. Reduced habituation of auditory evoked potentials indicate cortical hyperexcitability in Fragile X Syndrome. Transl. Psychiatry 6, e787. 10.1038/tp.2016.48. https://www.nature.com/articles/tp201648#supplementary-information. [DOI] [PMC free article] [PubMed] [Google Scholar]
- Ewen JB, Sweeney JA, Potter WZ, 2019. Conceptual, regulatory and strategic imperatives in the early days of EEG-based biomarker validation for neurodevelopmental disabilities. Front. Integr. Neurosci. 13, 45. 10.3389/fnint.2019.00045. [DOI] [PMC free article] [PubMed] [Google Scholar]
- Gasser T, Verleger R, Bacher P, Sroka L, 1988. Development of the EEG of schoolage children and adolescents. I. Analysis of band power. Electroencephalogr. Clin. Neurophysiol. 69 (2), 91–99. 10.1016/0013-4694(88)90204-0. [DOI] [PubMed] [Google Scholar]
- Gibson JR, Bartley AF, Hays SA, Huber KM, 2008. Imbalance of neocortical excitation and inhibition and altered UP states reflect network hyperexcitability in the mouse model of fragile X syndrome. J. Neurophysiol. 100 (5), 2615–2626. 10.1152/jn.90752.2008. [DOI] [PMC free article] [PubMed] [Google Scholar]
- Gmehlin D, Thomas C, Weisbrod M, Walther S, Pfüller U, Resch F, Oelkers-Ax R, 2011. Individual analysis of EEG background-activity within school age: impact of age and sex within a longitudinal data set. Int. J. Dev. Neurosci. 29 (2), 163–170. 10.1016/j.ijdevneu.2010.11.005. [DOI] [PubMed] [Google Scholar]
- Goswami S, Cavalier S, Sridhar V, Huber KM, Gibson JR, 2019. Local cortical circuit correlates of altered EEG in the mouse model of fragile X syndrome. Neurobiol. Dis. 124, 563–572. 10.1016/j.nbd.2019.01.002. [DOI] [PMC free article] [PubMed] [Google Scholar]
- Hagemann D, Hewig J, Walter C, Naumann E, 2008. Skull thickness and magnitude of EEG alpha activity. Clin. Neurophysiol. 119 (6), 1271–1280. 10.1016/j.clinph.2008.02.010. [DOI] [PubMed] [Google Scholar]
- Harmony T, Marosi E, Diaz de Leon AE, Becker J, Fernandez T, 1990. Effect of sex, psychosocial disadvantages and biological risk factors on EEG maturation. Electroencephalogr. Clin. Neurophysiol. 75 (6), 482–491. 10.1016/0013-4694(90)90135-7. [DOI] [PubMed] [Google Scholar]
- Jonak CR, Lovelace JW, Ethell IM, Razak KA, Binder DK, 2020. Multielectrode array analysis of EEG biomarkers in a mouse model of fragile X syndrome. Neurobiol. Dis. 138, 104794. 10.1016/j.nbd.2020.104794. [DOI] [PMC free article] [PubMed] [Google Scholar]
- Lee T-W, Girolami M, Sejnowski TJ, 1999. Independent component analysis using an extended infomax algorithm for mixed subgaussian and supergaussian sources. Neural Comput. 11 (2), 417–441. [DOI] [PubMed] [Google Scholar]
- Lovelace JW, Ethell IM, Binder DK, Razak KA, 2018. Translation-relevant EEG phenotypes in a mouse model of Fragile X Syndrome. Neurobiol. Dis. 115, 39–48. 10.1016/j.nbd.2018.03.012. [DOI] [PMC free article] [PubMed] [Google Scholar]
- Maris E, Oostenveld R, 2007. Nonparametric statistical testing of EEG- and MEG-data. J. Neurosci. Methods 164 (1), 177–190. 10.1016/j.jneumeth.2007.03.024. [DOI] [PubMed] [Google Scholar]
- Matthis P, Scheffner D, Benninger C, Lipinski C, Stolzis L, 1980. Changes in the background activity of the electroencephalogram according to age. Electroencephalogr. Clin. Neurophysiol. 49 (5), 626–635. 10.1016/0013-4694(80)90403-4. [DOI] [PubMed] [Google Scholar]
- McCullagh EA, Rotschafer SE, Auerbach BD, Klug A, Kaczmarek LK, Cramer KS, Wang Y, 2020. Mechanisms underlying auditory processing deficits in fragile X syndrome. Faseb. J. 34 (3), 3501–3518. 10.1096/fj.201902435R. [DOI] [PMC free article] [PubMed] [Google Scholar]
- Nikulin VV, Brismar T, 2005. Long-range temporal correlations in electroencephalographic oscillations: relation to topography, frequency band, age and gender. Neuroscience 130 (2), 549–558. 10.1016/j.neuroscience.2004.10.007. [DOI] [PubMed] [Google Scholar]
- Orekhova EV, Elsabbagh M, Jones EJ, Dawson G, Charman T, Johnson MH, Team B, 2014. EEG hyper-connectivity in high-risk infants is associated with later autism. J. Neurodev. Disord. 6 (1), 40. 10.1186/1866-1955-6-40. [DOI] [PMC free article] [PubMed] [Google Scholar]
- Roid GH, Pomplun M, 2012. The Stanford-Binet intelligence scales. In: Contemporary Intellectual Assessment: Theories, Tests, and Issues, third ed. The Guilford Press, New York, NY, US, pp. 249–268. fifth ed. [Google Scholar]
- Rutter M, Bailey A, Lord C, 2003. (SCQ) Social Communication Questionnaire. Western Psychological Services, Los Angeles, CA. [Google Scholar]
- Sansone SM, Schneider A, Bickel E, Berry-Kravis E, Prescott C, Hessl D, 2014. Improving IQ measurement in intellectual disabilities using true deviation from population norms. J. Neurodev. Disord. 6 (1), 16. 10.1186/18661955-6-16. [DOI] [PMC free article] [PubMed] [Google Scholar]
- Sansone SM, Widaman KF, Hall SS, Reiss AL, Lightbody A, Kaufmann WE, Hessl D, 2012. Psychometric study of the aberrant behavior checklist in fragile X syndrome and implications for targeted treatment. J. Autism Dev. Disord. 42 (7), 1377–1392. 10.1007/s10803-011-1370-2. [DOI] [PMC free article] [PubMed] [Google Scholar]
- Scally B, Burke MR, Bunce D, Delvenne JF, 2018. Resting-state EEG power and connectivity are associated with alpha peak frequency slowing in healthy aging. Neurobiol. Aging 71, 149–155. 10.1016/j.neurobiolaging.2018.07.004. [DOI] [PubMed] [Google Scholar]
- Somsen RJ, van’t Klooster BJ, van der Molen MW, van Leeuwen HM, Licht R, 1997. Growth spurts in brain maturation during middle childhood as indexed by EEG power spectra. Biol. Psychol. 44 (3), 187–209. 10.1016/s0301-0511(96)05218-0. [DOI] [PubMed] [Google Scholar]
- Sparrow SS, Cicchetti DV, Balla DA, 2008. Vineland Adaptive Behavior Scales, second ed. Pearson Assessments, Livonia, MN (vineland II), the expanded interview form. [Google Scholar]
- Tesic A, Rodgers S, Müller M, Wagner E-YN, von Känel R, Castelao E, Ajdacic-Gross V, 2019. Sex differences in neurodevelopmental and common mental disorders examined from three epidemiological perspectives. Psychiatr. Res. 278, 213–217. 10.1016/j.psychres.2019.06.019. [DOI] [PubMed] [Google Scholar]
- Tranfaglia MR, 2015. GABA and glutamate: the Yin and Yang of fragile X. Cell Cycle 14 (16), 2559. 10.1080/15384101.2015.1060782. [DOI] [PMC free article] [PubMed] [Google Scholar]
- van der Molen MJW, Stam CJ, van der Molen MW, 2014. Resting-state EEG oscillatory dynamics in fragile X syndrome: abnormal functional connectivity and brain network organization. PloS One 9 (2), e88451. 10.1371/journal.pone.0088451. [DOI] [PMC free article] [PubMed] [Google Scholar]
- Van der Molen MJW, Van der Molen MW, 2013. Reduced alpha and exaggerated theta power during the resting-state EEG in fragile X syndrome. Biol. Psychol. 92 (2), 216–219. 10.1016/j.biopsycho.2012.11.013. [DOI] [PubMed] [Google Scholar]
- Wang J, Barstein J, Ethridge LE, Mosconi MW, Takarae Y, Sweeney JA, 2013. Resting state EEG abnormalities in autism spectrum disorders. J. Neurodev. Disord. 5 (1), 24. 10.1186/1866-1955-5-24. [DOI] [PMC free article] [PubMed] [Google Scholar]
- Wang J, Ethridge LE, Mosconi MW, White SP, Binder DK, Pedapati EV, Sweeney JA, 2017. A resting EEG study of neocortical hyperexcitability and altered functional connectivity in fragile X syndrome. J. Neurodev. Disord. 9 (1), 11. 10.1186/s11689-017-9191-z. [DOI] [PMC free article] [PubMed] [Google Scholar]
- Woodcock RW, McGrew KS, Mather N, 2001. Woodcock-Johnson III Tests of Cognitive Abilities. Riverside Publishing, Itasca, IL. [Google Scholar]
- Zimmermann P, Gondan M, Fimm B, 2004. Testbatterie zur Aufmerksamkeitsprüfung für Kinder (KITAP). Psytest, Herzogenrath. [Google Scholar]


