

Abstract
Strategies are needed to link incarcerated individuals with opioid use disorders (OUD) to community-based treatment with medications (MOUD) upon their release, as well as to provide support for their ongoing recovery. The RMC-A experiment will test an adapted version of the evidence-based Recovery Management Checkups (RMC), which provides treatment linkage, support for retention, and re-linkage as indicated at quarterly check-ups. A total of 750 male and female individuals will be recruited from 5 county jails in Illinois and randomly assigned to 1 of 3 groups at release from jail: a) Monitoring and Treatment Referral (MTR), b) quarterly RMC (RMC-Q), or c) RMC-A, which adjusts the frequency and intensity of check-ups based on the individual’s assessed need for treatment at each check-up. Measurement includes quarterly research follow-up assessments for 2 years, urine tests, and records checks (treatment, mortality, recidivism). The study aims to evaluate: (1) The direct effects of RMC-Q/RMC-A on MOUD treatment initiation, engagement, retention, and re-linkage; (2) the indirect effects of RMC-A/RMC-A (via months of MOUD) on public health outcomes (days of opioid use, OUD symptoms, quality of life, cost of health-care utilization); (3) the indirect effects of RMC-Q/RMC-A (via months of MOUD and public health outcomes) on public safety outcomes (illegal activity, re-arrest, re-incarceration, cost of crime); and (4) the incremental costs and cost-effectiveness of MTR vs. RMC-Q vs. RMC-A on public health and public safety outcomes. This experiment will determine whether the adapted RMC model improves the overall effectiveness and cost-effectiveness of the fixed quarterly RMC.
1. Background
The high rate of criminal justice involvement among individuals with opioid use disorders (OUD) demonstrates a need for intervention with this population. Receipt of medications for opioid use disorder (MOUD) significantly improves public health and public safety outcomes among justice-involved populations. MOUD initiation prior to release improves continuity of MOUD treatment participation following community re-entry and reduces opioid relapse (Sharma et al., 2016). Furthermore, MOUD treatment significantly reduces opioid-overdose fatality risk and recidivism following release (De Andrade, Ritchie, Rowlands, Mann, & Hides, 2018).
Yet numerous barriers impact successful linkages to and retention in MOUD treatment following release from custody (Brinkley-Rubinstein et al., 2018). Chief among these barriers is lack of coordination between criminal justice systems and community-based MOUD treatment providers (Brinkley-Rubinstein et al., 2017; Monico et al., 2016; Welsh et al., 2016). More assertive and effective methods to link, engage, and retain this population in MOUD post-release are clearly needed. The Recovery Management Check-ups-Adaptive Experiment aims to address this need.
1.1. Recovery Management Check-Ups (RMC)
The Recovery Management Check-ups (RMC; Dennis, Scott, & Funk, 2003) model was designed to improve treatment linkage, engagement, and long-term retention. The conceptual framework is based on the theory of chronic disease management that utilizes ongoing assessment and monitoring through regular checkups and early (re)intervention to facilitate detection of relapse, reduce time to treatment re-entry, and, consequently, improve long-term outcomes (Dennis & Scott, 2007; Scott & Dennis, 2009, 2011; Scott, Dennis, Laudet, Funk, & Simeone, 2011).
The RMC model has been shown to be effective in 2 prior randomized trials in which individuals were recruited while in substance use disorder (SUD) treatment and received quarterly follow-ups for 2 to 4 years (Dennis, Scott, & Funk, 2003; Dennis & Scott, 2012; Scott, Dennis & Foss, 2005; Scott & Dennis, 2009), and a third randomized trial in which women were recruited at discharge from jail and received quarterly checkups for 3 years (Scott & Dennis, 2012; Scott, Dennis, & Lurigio, 2017). In all 3 studies, RMC participants were significantly more likely than controls to return to treatment sooner, stay longer, and receive more treatment; they also reported fewer days of substance use and substance use disorders.
To inform the present study, we examined predictors of treatment need across time periods among a selected subset of RMC participants with OUD released from jail in the third trial (n=101). The best predictor of future need for treatment (defined as reporting weekly or more frequent substance use since the last checkup, any past-month SUD symptoms, or self-perceived need for treatment) was the participant’s need for treatment at the prior two checkups. Relative to RMC participants with no treatment needs, those who needed treatment in the prior 2 monthly checkups were almost 5 times more likely to need treatment at 6 months post-release (32% vs. 70%, OR=4.96, p<.001). Likewise, between 12 to 24 months, RMC participants who needed treatment at either of their two prior quarterly check-ups were almost 18 times more likely to need treatment at the next checkup (76% vs. 15%, OR=17.94).
These findings are consistent with recent interventions for other chronic conditions that have shifted from the traditional fixed-intervention approach toward adaptive approaches that allow for individualization of treatment options based on the person’s ongoing performance (Bierman, Nix, Maples, & Murphy, 2006; Marlowe et al., 2008; McKay, 2005; Nahum-Shani et al., 2012). The adaptive approach assumes people respond differently over time and the intervention will be most effective when continuously adapted based on their individual progress (Blanco, Wiley, Lloyd, Lopez, & Volkow, 2020).
The goal of the current experiment is to evaluate an adapted version of the RMC (RMC-A) versus the original RMC-Quarterly (RMC-Q) intervention, and a Monitoring and Treatment Referral (MTR) condition.
1.2. Study aims and hypotheses
Aim 1.
Evaluate the direct effects of the two RMC conditions on the OUD service cascade of care (initiation, engagement, retention, and re-linkage, and months of treatment with MOUD).
-
H1a.
Relative to the MTR group over 24 months, the participants in the two RMC groups will be more likely to initiate MOUD and participate in MOUD treatment more months.
-
H1b.
Relative to the RMC-Q group over 24 months, the participants in the RMC-A group will be more likely to initiate MOUD and to participate in MOUD treatment more months.
Aim 2.
Estimate the indirect effects of the two RMC groups (via months of treatment with MOUD) on public health outcomes (days of opioid use, OUD symptoms, quality of life and the cost-of-healthcare-utilization).
-
H2a.
Relative to the MTR group, participants in the two RMC groups will have better public health outcomes (fewer days of opioid use, fewer OUD symptoms, better quality of life, and lower cost-of-health-care-utilization) in the next quarter.
-
H2b.
Relative to the RMC-Q group, participants in the RMC-A group will have better public health outcomes in the next quarter.
-
H2c.
More months of treatment with MOUD (regardless of group assignment) in a given quarter will be associated with fewer days of opioid use in the next quarter.
-
H2d.
The months of treatment with MOUD will mediate the relationship between group assignment and public health outcomes.
Aim 3.
Examine the indirect effects of the two RMC groups (via months of treatment with MOUD and public health outcomes) on public safety outcomes (illegal activity, re-arrest, re-incarceration, and cost-of-crime).
-
H3a.
Relative to the MTR group, participants in the two RMC groups will have better public safety outcomes (illegal activity, re-arrest, re-incarceration, and cost-of-crime) in the next quarter.
-
H3b.
Relative to the RMC-Q group, participants in the RMC-A group will have better public safety outcomes in the next quarter.
-
H3c.
More months of MOUD treatment and better public health outcomes (regardless of group assignment) in a given quarter will be associated with better public safety outcomes in the next quarter.
-
H3d
The months of MOUD treatment and public health outcomes will mediate the relationship between group assignment and public health outcomes.
Aim 4.
Calculate the incremental costs and cost-effectiveness of the two RMC groups in terms of both public health outcomes (days of opioid use, quality adjusted life years (QALYs), cost-of-health-care utilization) and public safety outcomes (re-incarceration and cost-of-crime).
-
H4a.
Relative to the MTR group over 24 months, participants in the two RMC groups will have lower cost-per-outcome (e.g., days of opioid reduced; QALYs gained).
-
H4b.
Relative to the RMC-Q group over 24 months, participants in the RMC-A group will have a higher cost, but also greater effectiveness in reducing opioid use and in QALYs gained.
-
H4c.
Relative to the MTR group over 24 months, participants in the two RMC groups will have significantly lower healthcare utilization, criminal activity, and criminal justice system costs.
-
H4d.
Relative to the RMC-Q group over 24 months, participants in the RMC-A group will have significantly lower healthcare utilization, criminal activity, and criminal justice system costs.
2. Methods and Materials
2.1. Study design
This experiment will be conducted with 5 Illinois county jails and their collaborating MOUD treatment providers. Pre-release, individuals are routinely screened for OUD and given access to MOUD within the jails. At the time of release, 750 men and women will be referred to the study team and randomly assigned to 1 of 3 groups (described in detail below). The study conceptual model in relation to the study aims is shown in Figure 1.
Figure 1:
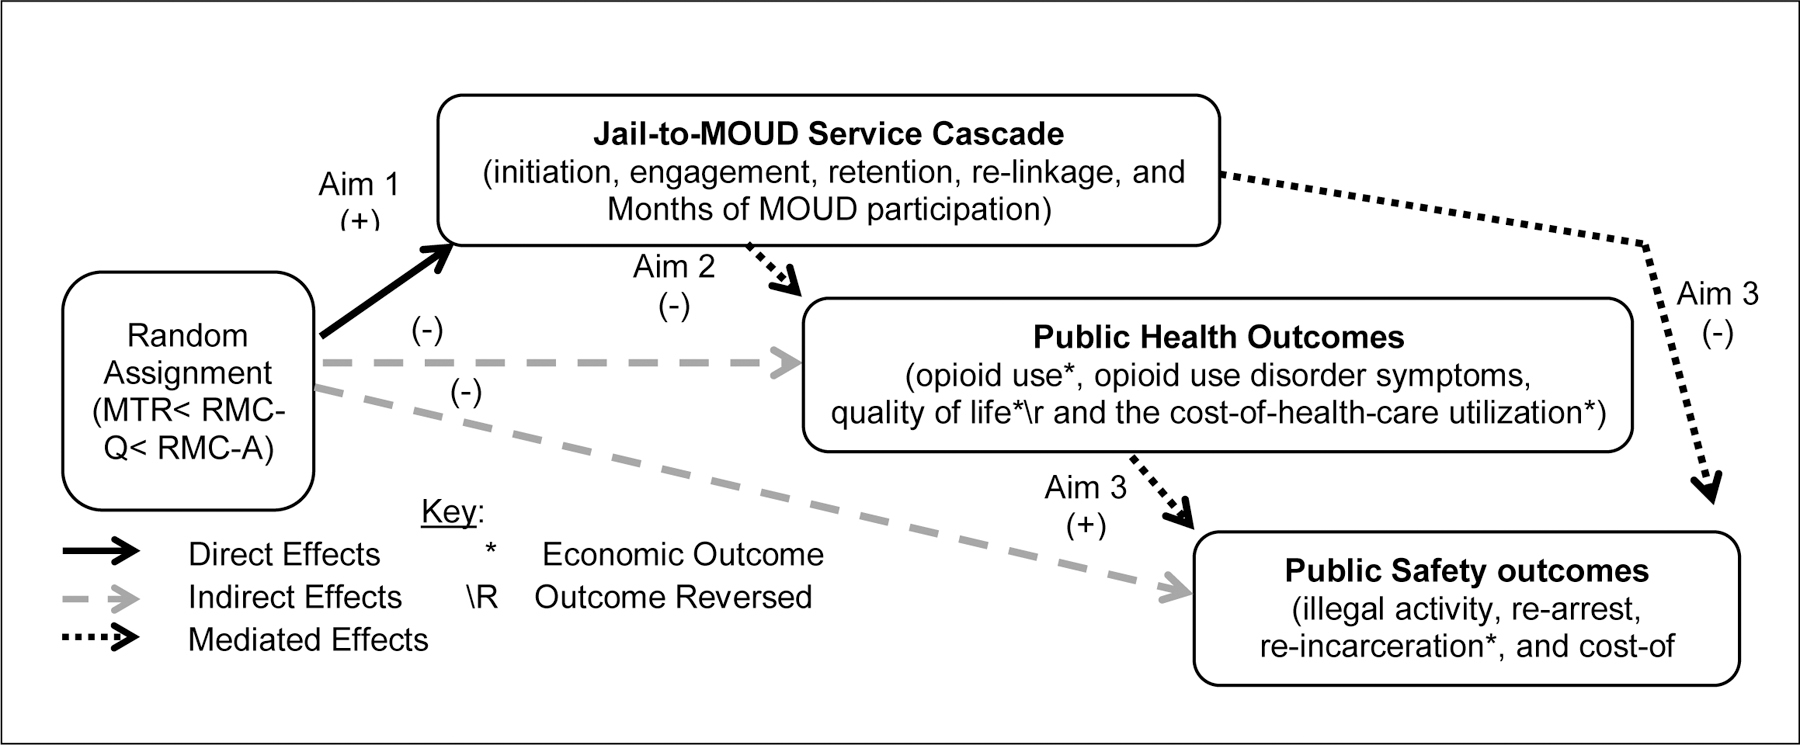
Conceptual Model for the RMC-A Experiment and Analyses
2.2. Study conditions
2.2.1. Monitoring and Treatment Referral (MTR)
In the MTR group, research interviewers will conduct assessments with participants at months 1, 2, 3 and quarterly up to 2 years. In the monthly and quarterly monitoring interviews, they will be interviewed about their need for MOUD and/or other types of treatment, the barriers that they face accessing treatment, and their level of motivation for treatment. If the participant needs treatment, the interviewer will provide information about OTP providers, however, the burden of following through on this referral is largely on the participant.
2.2.2. RMC-Quarterly (RMC-Q)
In addition to the MTR services, RMC-Q participants will meet with a Linkage Manager (LM) upon study enrollment and during each checkup. The LM will use motivational interviewing to identify treatment barriers and provide assistance related to treatment initiation, engagement, and retention. At subsequent check-ups, the LM will also evaluate participants’ need for continuing care and recovery support.
2.2.3. RMC-Adaptive (RMC-A)
The adaptive schedule and intervention strategies in RMC-A take into consideration individuals’ need for treatment reported during checkups and their pattern of need observed over repeated check-ups. Thus, in the RMC-A condition the intervention is adapted repeatedly in response to participants’ varying need for treatment (see Table 1).
Table 1.
Contrast of RMC and RMC-Adaptive Dosage and Intervention Strategies
| RMC-Quarterly | RMC-Adaptive | |
|---|---|---|
| Dosage | • Fixed schedule at 1, 2, 3, 6, 9, 12, 15, 18, 21, and 24 months post-release | • Adaptive schedule starting monthly, and going out one additional month for every checkup in a row not in need (max=5m) • If subsequently in need, schedule resets |
| Participant Status at Checkup | ||
| Refused Treatment | • Communication Follow-up Plan | • Same as RMC |
| Currently in Treatment | • Reinforce treatment retention | • Same as RMC |
| No Treatment Need | • Reinforce relapse prevention | • Same as RMC |
| Need Treatment: For 1 to 2 checkups in a row in need |
• Motivational interviewing • Personalized feedback • Identify barriers to treatment • Problem solving • Scheduling • Linkage assistance • Engagement |
• Same as RMC |
| For 3 or more checkups in a row in need | • Case conference w/participant, physician and team considering: ○ increased focus on MOUD dosage, alternative types of MOUD or treatment, ○ change in linkage manager or counselor, ○ other referral for resources |
|
| Incarceration | • No intervention | • Pre-release MOUD engagement and linkage post-release |
Changes to dose
RMC-Q:
Participants in the RMC condition will receive a fixed schedule of monthly checkups during the first 90 days post-release and quarterly for the remainder of 2 years.
RMC-A:
Participants in the RMC-A group will receive monthly checkups during the first 2 months post-release with additional checkups dependent upon the participant’s progress. Participants will continue to receive monthly checkups as long as they need treatment. However, if a participant is assessed as not needing treatment at the check-up, the number of months before the next checkup will be increased by 1 month (e.g., after 2 checkups without need, they will receive the next checkup 2 months later, after 3 it will be 3 months, and so on). Based on these decision rules, individuals who have NO treatment need over 24 months will receive 5 checkups. Additionally, if at any point during a check-up a participant evidences a need for treatment, the schedule will restart. This adaptive schedule provides a more intensive dose of checkups for those in need and a less intense dose when there is no treatment need.
Changes to intervention strategies
In both RMC-Q and RMC-A, individuals will meet with a LM during the checkup and the same strategies will be employed for individuals who do not want treatment, are currently in treatment, or have no demonstrated treatment need (see Table 1).
RMC-Q:
When individuals demonstrate a treatment need, the LM will utilize motivational interviewing techniques to provide personalized feedback, identify barriers to treatment and solutions, problem solve, schedule treatment appointments and provide linkage support. The meeting schedule and content will remain the same across the 2 years regardless of the pattern of treatment need over time.
RMC-A:
For individuals who have 3 consecutive checkups in which they need treatment, the intervention strategy will be adapted to include a meeting with the LM, participant, and treatment team to brainstorm ways to better accommodate the needs of the participant. For those who are re-incarcerated at the time of the checkup(s), the LM and detainee will meet to develop a post-discharge recovery plan.
2.3. Measurement
2.3.1. Interview data
Face-to-face interviews (depending on the circumstances) will be conducted using the Chestnut Hub Survey at enrollment (i.e., release to community), and at 1, 2, 3, 6, 9, 12, 15, 18, 21, and 24 months post-enrollment. For the RMC-A condition only, additional monthly interviews will be conducted as needed. The enrollment and quarterly interviews include the JCOIN core measures described elsewhere in this special issue (Ducharme et al., 2020), which will be supplemented with additional standardized and specific questions developed for the JCOIN Chestnut Hub survey.
2.3.2. Other Sources of Individual Data
Interviews will be supplemented with urine testing, as well as treatment, justice and death records. To increase self-report validity, at the time of each in-person research assessment, on-site urine screens will be conducted with DrugCheck cups and fentanyl test strips using an immunoassay for rapid (2–5 minutes) qualitative results for alcohol and other drugs (see Scott & Dennis, 2009 for protocol). Treatment records on relevant dates and treatment received will be obtained via a combination of consent, specific releases, and business associate agreement with collaborating OTPs. Data on arrests, charges, and admission and release dates from jail over the 24-month study period will be obtained from the State of Illinois’ Law Enforcement Agencies Data System. Death records will be obtained from appropriate County Medical Examiner’s offices for participants who are believed to be deceased.
2.3.3. Collection and calculation of economic measures
The economic cost of providing the RMC-Q and RMC-A interventions will be calculated using data from Chestnut accounting recordings. Other types of service utilization units will be estimated from the patient surveys and the monetary conversion factors (aka unit costs) will be based on our prior estimates (McCollister et al., 2017) and/or updates across the JCOIN Hubs. The QALY will be estimated using the published estimates from PROMIS (Hartman & Craig, 2018; Skolasky, Purvis, Riley, & Neuman, 2017).
2.5. Analytic approach
2.5.1. Analysis of Comparative Effects on Primary Outcome (Aim 1)
The analysis for Aim 1 is designed to evaluate, (H1a) relative to the MTR group, the extent to which providing RMC-Q and RMC-A significantly increases rates of MOUD linkage and treatment retention over 24 months, and (H2a) these same outcomes for RMC-A relative to RMC-Q. Marginal effects will be initially evaluated with a Chi-square (for MOUD treatment initiation) and Mann Whitney U rank test of the distributions (for months of MOUD treatment) comparing the main effect. Because the size of the RMC effect increases with repeated intervention exposure, we will evaluate changes in observed effects on months of MOUD treatment over time using multilevel structural equation modeling (MSEM) with mixed effects in MPlus (version 6.1) controlling for the number of months (i.e., % of months of participation). The analysis will model observations (Level 1) nested within participants (Level 2), and participants nested within counties (Level 3). Random assignment to 1 of 3 groups, being released on probation, and being mandated to treatment will each be modeled as a Level 2 predictor. We will test differences in the a-intercept and slope over time. Participants will be modeled as a random factor to control for repeated observations on the same person. Probation status and type of medication received will be modeled as time-varying covariates by observation (Level 1). The impact of dosage is evaluated with growth curve analysis to see if the difference between RMC-A and the MTR groups increases with checkup dosage (i.e., by observation at level 1). MSEM also incorporates measurement error corrections.
2.5.2. Secondary analysis of Indirect Effects on public health outcomes (Aim 2) and public safety outcomes (Aim 3).
The analysis of direct effects for Aim 2 & 3 will parallel the Aim 1 analysis. For the indirect effects, we will also replicate analyses, while temporally controlling for effects from time 1 to time 2 to time 3. As even the MTR group is likely to have some level of MOUD treatment, the extent to which they do will be included in this effect. Similarly, public health outcomes (Aim 2) impact illegal activity in all 3 groups. We will test these correlations and then use them to separate the direct and indirect effects of the experimental intervention on each outcome using MSEM. We will control for repeated observations by including person as a random effect and include the duration between observations to partial out any methods effects. Indirect effects of the experimental intervention on each outcome will be evaluated using MacKinnon’s joint-significance testing of the path z-scores with a Sobel test using a standard error based on bootstrapping and criteria of p<.05 on the degree of difference between conditions. We will also check for potential effects of selected baseline characteristics by testing whether the observed SEM paths are ‘invariant’ across each.
2.5.3. Cost-effectiveness analysis (Aim 4)
The Cost-Effectiveness Analysis (CEA) will assess costs associated with the healthcare sector (e.g., OTP provider, third party payers) and society (i.e., costs of criminal activity and criminal justice interactions). For each site, differences in costs and effects between study conditions will be estimated using multilevel general linear models (e.g., generalized linear mixed models or GLMM). Analyses will use a nonparametric bootstrapping method within the multivariable framework to compute confidence intervals for assessing uncertainty in the incremental cost effectiveness ratios (ICERS) for RMC-Q versus MTR, RMC-A versus MTR, and RMC-Q versus RMC-A. These confidence intervals form cost-effectiveness acceptability curves (CEACs) based on what society may be willing to pay to achieve an additional unit of effect (e.g., one day of abstinence or one QALY). The CEACs provide context for interpreting the CEA results by illustrating the probability that a strategy is a good value for different value thresholds. For instance, in the context of RMC-A versus MTR, the ICER reports the marginal cost of achieving one percentage point reduction in overdose for individuals receiving RMC-A relative to MTRs.
2.6. Adaptation in response to Covid-19
Challenges resulting from the Coronavirus (COVID-19) pandemic have required the criminal justice and SUD treatment systems to rapidly adapt, which will likely impact the target population for this study and the interpretation of findings. Most apparent are the move to reduce overcrowded jails and prisons through rapid depopulation and the rolling back of federal guidelines to allow greater access to MOUD treatment through telemedicine (Mukherjee & El-Bassel, 2020; Alexander, Stoller, Haffajee, & Saloner, 2020). Depopulation has resulted in fewer study-eligible detainees being released from participating jails, requiring the need to explore potential modifications to participating jails. While expanded telemedicine is facilitating MOUD access for many individuals, many service providers have placed caps on new intakes. Furthermore, caps many providers are placing on new patients will need to be considered throughout the trial, as they will impact the time it takes to link participants to treatment and services. These issues and others highlight the need for contextual information necessary to understand how criminal justice and treatment systems are shifting in response to the pandemic that will assist with interpretation of the trial’s results (Johns, 2006), which will be accomplished through collection of semi-structured qualitative interview data from jail and treatment providers.
3.0. Conclusion
Referrals to OUD treatment for individuals released from county jails are typically characterized by passive, advice-oriented practices that rely heavily on the individual to follow through on their own. In contrast, the RMC intervention provides ongoing support for treatment engagement and recovery that is client-centered, proactive, and non-punitive. This experiment will determine whether the adapted RMC model improves the overall effectiveness and cost-effectiveness of the RMC intervention.
Acknowledgements
This paper was supported by National Institute on Drug Abuse (NIDA) grant no. UG1DA050065 (PI: Scott). The opinions are those of the authors and do not reflect positions of the government.
References
- Alexander GC, Stoller KB, Haffajee RL, & Saloner B (2020). An epidemic in the midst of a pandemic: Opioid use disorder and COVID-19 [epub ahead of print]. Annals of Internal Medicine, M20–1141. doi: 10.7326/M20-1141 [DOI] [PMC free article] [PubMed] [Google Scholar]
- Bierman KL, Nix RL, Maples JJ, & Murphy SA (2006). Examining clinical judgment in an adaptive intervention design: The Fast Track program. Journal of Consulting and Clinical Psychology, 74(3), 468–481. doi: 10.1037/0022-006X.74.3.468 [DOI] [PMC free article] [PubMed] [Google Scholar]
- Blanco C, Wiley TRA, Lloyd JJ, Lopez MF, & Volkow ND (2020). America’s opioid crisis: the need for an integrated public health approach. Translational Psychiatry, 10, 167. doi: 10.1038/s41398-020-0847-1 [DOI] [PMC free article] [PubMed] [Google Scholar]
- Brinkley-Rubinstein L, Cloud H, Davis C, Zaller N, Delany-Brumsey A, Pope L,…Rich J (2017). Addressing excess risk of overdose among recently incarcerated people in the USA: Harm reduction interventions in correctional settings. International Journal of Prisoner Health, 13(1), 25–31. doi: 10.1108/IJPH-08-2016-0039 [DOI] [PubMed] [Google Scholar]
- Brinkley-Rubinstein L, Zaller N, Martino S, Cloud DH, McCauley E, Heise A, & Seal D (2018). Criminal justice continuum for opioid users at risk of overdose. Addictive Behaviors, 86, 104–110. doi: 10.1016/j.addbeh.2018.02.024 [DOI] [PubMed] [Google Scholar]
- De Andrade D, Ritchie J, Rowlands M, Mann E, & Hides L (2018). Substance use and recidivism outcomes for prison-based drug and alcohol interventions. Epidemiological Reviews, 40(1), 121–133. doi: 10.1093/epirev/mxy004 [DOI] [PubMed] [Google Scholar]
- Dennis ML, & Scott CK (2012). Four-year outcomes from the Early Re-Intervention Experiment (ERI) with recovery management checkups (RMC). Drug and Alcohol Dependence, 121(1), 10–17. doi: 10.1016/j.drugalcdep.2011.07.026 [DOI] [PMC free article] [PubMed] [Google Scholar]
- Dennis ML, & Scott CK (2007). Managing addiction as a chronic condition. Addiction Science and Clinical Practice, 4(1), 45–55. [DOI] [PMC free article] [PubMed] [Google Scholar]
- Dennis ML, Scott CK, & Funk R (2003). An experimental evaluation of recovery management checkups (RMC) for people with chronic substance use disorders. Evaluation and Program Planning, 26(3), 339–352. doi: 10.1016/S0149-7189(03)00037-5 [DOI] [PMC free article] [PubMed] [Google Scholar]
- Ducharme L et al. (2020). Engaging the justice system to address the opioid crisis: The Justice Community Opioid Innovation Network (JCOIN). Journal of Substance Abuse Treatment (this issue). [DOI] [PMC free article] [PubMed] [Google Scholar]
- Hartman JD, & Craig BM (2018). Comparing and transforming PROMIS utility values to the EQ-5D. Quality of Life Research, 27(3), 725–733. doi: 10.1007/s11136-017-1769-0 [DOI] [PubMed] [Google Scholar]
- Johns G (2006). The essential impact of context on organizational behavior. Academy of Management Review, 31(2), 386–408. doi: 10.5465/amr.2006.20208687 [DOI] [Google Scholar]
- Marlowe DB, Festinger DS, Dugosh KL, Benasutti KM, Fox G, & Harron A (2008). An experimental trial of adaptive programming in drug court: Outcomes at 6, 12 and 18 months. Journal of Experimental Criminology, 10(2), 129–149. doi: 10.1007/s11292-013-9196-x [DOI] [PMC free article] [PubMed] [Google Scholar]
- McCollister K, Yang X, Sayed B, French MT, Leff JA, & Schackman BR (2017). Monetary conversion factors for economic evaluations of substance use disorders. Journal of Substance Abuse Treatment, 81, 25–34. doi: 10.1016/j.jsat.2017.07.008 [DOI] [PMC free article] [PubMed] [Google Scholar]
- McKay JR (2005). Is there a case for extended interventions for alcohol and drug use disorders? Addiction, 100(11), 1594–1610. doi: 10.1111/j.1360-0443.2005.01208.x [DOI] [PubMed] [Google Scholar]
- Monico LB, Mitchel SG, Welsh W, Link N, Hamilton L, Redden SM,…Friedmann PD (2016). Developing effective interorganizational relationships between community corrections and community treatment providers. Journal of Offender Rehabilitation, 55(7), 484–501. doi: 10.1080/10509674.2016.1218401 [DOI] [PMC free article] [PubMed] [Google Scholar]
- Mukherjee TI, & El-Bassel N (2020). The perfect storm: COVID-19, mass incarceration and the opioid epidemic [epub ahead of print]. The International Journal on Drug Policy, 102819. doi: 10.1016/j.drugpo.2020.102819 [DOI] [PMC free article] [PubMed] [Google Scholar]
- Nahum-Shani I, Qian M, Almirall D, Pelham WE, Gnagy B, Fabiano GA,…Murphy SA (2012). Experimental design and primary data analysis methods for comparing adaptive interventions. Psychological Methods, 17(4), 457–477. doi: 10.1037/a0029372 [DOI] [PMC free article] [PubMed] [Google Scholar]
- Scott CK, & Dennis ML (2012). The first 90 days following release from jail: Findings from recovery management checkups for women offenders (RMCWO) experiment. Drug and Alcohol Dependence, 125(1), 110–118. doi: 10.1016/j.drugalcdep.2012.03.025 [DOI] [PMC free article] [PubMed] [Google Scholar]
- Scott CK, & Dennis ML (2011). Recovery management checkups with adult chronic substance users. In Kelly J, & White W (eds.), Addiction recovery management: Theory, science and practice (pp. 87–102). New York, NY: Springer Science. [Google Scholar]
- Scott CK, & Dennis ML (2009). Results from two randomized clinical trials evaluating the impact of quarterly recovery management checkups with adult chronic substance users. Addiction, 104(6), 959–971. doi: 10.1111/j.1360-0443.2009.02525.x [DOI] [PMC free article] [PubMed] [Google Scholar]
- Scott CK, Dennis ML, & Foss MA (2005). Utilizing recovery management checkups to shorten the cycle of relapse, treatment reentry, and recovery. Drug and Alcohol Dependence, 78(3), 325–338. doi: 10.1016/j.drugalcdep.2004.12.005 [DOI] [PMC free article] [PubMed] [Google Scholar]
- Scott CK, Dennis ML, Laudet A, Funk RR, & Simeone RS (2011). Surviving drug addiction: The effect of treatment and abstinence on mortality. American Journal of Public Health, 101, 737–744. doi: 10.2105/AJPH.2010.197038 [DOI] [PMC free article] [PubMed] [Google Scholar]
- Scott CK, Dennis ML, & Lurigio AJ (2017). The effects of specialized probation and recovery management checkups (RMCs) on treatment participation, substance use, HIV risk behaviors, and recidivism among female offenders: Main findings of a 3-year experiment using subject by intervention interaction analysis. Journal of Experimental Criminology, 13(1), 53–77. doi: 10.2105/AJPH.2010.197038 [DOI] [PMC free article] [PubMed] [Google Scholar]
- Sharma A, O’Grady KE, Kelly SM, Gryczynski J, Mitchell SG, & Schwartz RP (2016). Pharmacotherapy for opioid dependence in jails and prisons: Research review update and future directions. Substance Abuse and Rehabilitation, 7(1), 27–40. doi: 10.2147/SAR.S81602 [DOI] [PMC free article] [PubMed] [Google Scholar]
- Skolasky RL, Purvis TE, Riley LH, & Neuman BJ (2017). Estimating quality adjusted life years using the Patient Reported Outcomes Measurement Information System (PROMIS) health domains. The Spine Journal, 17(10), S90. doi: 10.1016/j.spinee.2017.07.126 [DOI] [Google Scholar]
- Welsh WN, Knudsen HK, Knight K, Ducharme L, Pankow J, Urbine T,…Friedmann PD (2016). Effects of an organizational linkage intervention on inter- organizational service coordination between probation/parole agencies and community treatment providers. Administration and Policy in Mental Health and Mental Health Services Research, 43(1), 105–121. doi: 10.1007/s10488-014-0623-8 [DOI] [PMC free article] [PubMed] [Google Scholar]