Abstract
An increase in the number of patients and death rates make Covid-19 a serious pandemic situation. This problem has effects on health security, economical security, social life, and many others. The long and unreliable diagnosis process of the Covid-19 makes the disease spread even faster. Therefore, fast and efficient diagnosis is significant for dealing with this pandemic. Computer-aided medical diagnosis systems are very common applications and due to the importance of the problem, providing accurate predictions is required. In this study, blood samples of patients from Einstein Hospital in Brazil has collected and used for prediction on the severity level of Covid-19 with machine learning algorithms. The study was constructed in two stages; in stage-one, no preprocessing method has applied while in stage-two preprocessing has emphasized for achieving better prediction results. At the end of the study, 0.98 accuracy was obtained with the tuned Random Forest algorithm and several preprocessing methods.
Keywords: Covid-19, Imputation, Machine learning, Random forest, SMOTE-NC
Introduction
The novel coronavirus outbreak has begun in Wuhan, China at the end of 2019 and has affected millions of people within a short time. The World Health Organization has rated the global risk and impact of Covid-19 as very high and indicated the virus as a global emergency. On December 31st, health care professionals confirmed dozens of cases in China were treated for pneumonia and then on January 11th first death was reported by Chinese media. The virus has spread the whole world in record time and become a serious pandemic. It killed more than 965,000 people worldwide and continues to spreading [1].
The common symptoms of people who are infected by coronavirus are specified as fever, cough, fatigue, loss of taste or smell, sore throat, headache, and muscle pain. However, some people are exposed to the Covid-19 yet have no symptoms at all [2]. The most common symptoms of Covid-19 are similar to other viral infectious diseases and this makes the clinical diagnosis impractical [3]. Indeed, that is one of the issues with the coronavirus, since symptoms vary from person to person it makes the prognosis process difficult and causes the virus to spread faster. The current reliable process for detecting Covid-19 is qRT-PCR tests but the problem with this method is that it takes several hours [4]. Besides, there are some concerns about the lack of extensive testing capacity. Shortage of diagnostic materials and long diagnosis processes are major problems for controlling the outbreak [5] Therefore, diagnosing and detecting Covid-19 remains a significant problem worldwide. Although many studies have been carried out on this topic, there are many pieces of research in the list for waiting to fill deficiencies in the literature.
The rest of the paper is organized as follows. The related studies are given in Sect. 1.1. In Sect. 2 preferred preprocessing methods and machine learning algorithms are explained briefly. Section 3 provides performance results from the model and finally, Sect. 4 summarizes the study and mentions future researches.
Related works
There are some works done for demonstrating the clinical outcomes for Covid-19. A study of [6] presented a review of epidemiology and clinical features associated with Covid-19. Similar studies are conducted to investigate clinical symptoms, features, and parameters of Covid-19 [7–9]. Demographic data, laboratory results, symptoms, and treatments are used to describe clinical outcomes of critically ill patients with Covid-19 [10]. A similar study to [10] is demonstrated to further clarify epidemiological and clinical characteristics of Covid-19 by using similar data such as demographic, clinical, laboratory, and radiological features [11, 12] has compared epidemiological and clinical outcomes for both noncritical ill and critically ill patients. Besides clinical outcomes of Covid-19, there is also some research done for making predictions on mortality predictors. Lactic dehydrogenase (LDH), lymphocyte, and C reactive protein were found to be the most related biomarker with 90% accuracy on mortality in the study of [13]. In another work, in addition to C-reactive protein, age, and impaired renal function were predicted as major indicators of Covid-19 mortality [14]. [14] used clinical data and Random Forest to find the most important predictor on mortality and concluded that age was the most important factor with a 0.97 ROC score. Such a different study was aimed to investigate ocular manifestations and viral prevalence in the conjunctiva of patients with Covid-19. According to experimental analysis, patients with ocular symptoms were more likely to have higher white blood cells, neutrophils, C-reactive protein, and LDH. Within this study, it was aimed to assist ophthalmologists to understand the ocular manifestation of Covid-19 [16]. One retrospective study focused on patients in the America region with Covid-19 to search a relationship between acute kidney injury and clinical outcomes of Covid-19 by using a Multivariate Logistic Regression model [17, 18] built a system for a mobile phone-based survey to prevent the spread of the virus in populations. They proposed a mobile phone-based survey for the identification of Covid-19 with a machine learning algorithm. An interesting paper worked on investigating the relationship between weather variables such as temperature and humidity on mortality of Covid-19. They concluded the results that there is a strong connection between input and output variables [19]. Another conducted study aimed to forecast epidemic trends. They used the Logistic Regression model to fit the cap if epidemic trend then feeds the cap value into FbProphet model to find a pattern and predict the trend of epidemic situation. Their mathematical model showed that the outbreak will peak in late October [20].
Deep learning is one of the fields that is emerging and commonly used for image processing cases. There are many studies conducted for the detection of Covid-19 by using computer tomography (CT) images. In a related study, the deep learning model was provided to detect Covid-19 based on CT images of patients. For the experimental processes, 150 images were used and five different feature extraction methods were applied. About 99.68% accuracy was accomplished by Gray Level Size Zone Matrix (GLSZM) [21, 22] was aimed to develop a fully automatic framework to detect Covid-19 using chest images. Covid-19 detection Neural Network (Cov-NN) has been developed to extract visual features and they were able to detect Covid-19 accurately with the model. An artificial intelligence algorithm was used to rapidly diagnose Covid-19 patients by integrating CT images with clinical symptoms, exposure history, and laboratory testing [23]. A similar study was aimed to establish an early screening model to distinguish Covid-19 pneumonia from Influenza—A and healthy cases. According to model performance results, it has been concluded that model performance was found to be effective [24, 25] worked with CT images to segment the lung region by pre-trained UNet, then segmented 3D lung region was fed into a 3D deep neural network to predict the probability of Covid-19. The algorithm was achieved a 0.959 ROC-AUC score. A new approach has been proposed in the study of [26], to classify Covid-19 based on using texture features of chest x-ray images with neural networks.
Machine learning which is branch of artificial intelligence is a preferred field for Covid-19 studies. Briefly, machine learning can be defined as a set of methods to detect patterns automatically in data and then use this ability to predict uncovered patterns for future data [27]. Many studies demonstrate the relationship between hematological characteristics and Covid-19 diagnosis [28–30]. In a decision making Covid-19 study, the overall hemogram dataset utilized in this study which includes 5644 patients 111 examinations was used to give an idea for Covid-19 test results in many other studies. They used data of 510 patients with 15 parameters and the Naive Bayes method to classify positive and negative cases [31]. The artificial intelligence-based method has been used to identify Covid-19 cases using the same hemogram data. They preferred to use 599 patients’ data and 16 common examinations for the Support Vector Machine (SVM) algorithm and were able to achieve an 0.86 ROC classification score [32]. The first study on Covid-19 detection with hemogram data found in the literature belongs to [33]. They worked on 235 patients with 18 exam results and used 5 different machine learning methods with tuned hyperparameters to classify positive–negative cases. In another study, Random Forest (RF) has been selected as the best method and a web-based system has been built with RF to the detection of Covid-19 and the severity level of the disease. 41 examinations included in the model and 92.81% accuracy has been obtained for predicting positive–negative cases while 99% accuracy has achieved as for the indication of hospitalization [34, 35] worked on complex deep learning methods to predict Covid-19 patients. They used the same hemogram data set with 18 common features and 600 patients’ examinations and six different deep learning-based methods. Among the six methods, a combination of Convolutional Neural Network and Long Short Term Memory (CNNLSTM) method achieved 0.92 accuracy. The same hemogram data have been used in a different study to predict severe/critical symptoms of patients exposed to Covid-19. Thirty-six indicators were identified for 336 cases and SVM has applied to discriminate mild and severe cases with an AUC score of 0.99 [36]. In a very similar study that used the same hemogram data, 598 patients and 14 features were used for building a machine learning prediction model. They aimed to predict regular ward and not admitted to hospital cases with three different machine learning algorithms which are RF, Artificial Neural Network (ANN), and glmnet. Glmnet was found to be the best algorithm to predict regular ward cases with 0.91 accuracy while ANN was found the better while making predictions on not admitted to hospital cases with 0.87 accuracy [37, 38] worked on data analytics for novel coronavirus disease. They used the same hemogram data for the classification task. Principal component analysis (PCA) has been adopted to feature selection. They applied five different methods and selected 10 features for the classification of 1091 patients’ Covid-19 cases. A similar study to this conducted paper was presented by [39]. They worked on the same overall data to classify Covid-19 cases and the severity level of the disease. They applied five different machine learning methods and worked on hyperparameter tunning of these methods. They preferred to work on data preprocessing which is one of the main ideas of this paper. They used multiple imputations by chained equations (MICE) method for dealing with empty observations. SMOTE technique has been adopted to balance the positive–negative cases in the study of [39]. They obtained a 0.98 AUC score for the prediction of patients that require intensive care unit and a 0.92 AUC score for patients that require hospital admission. Another study has collected 32 features of blood and urine data from Tangji Hospital Huazhang University and built a machine learning model to detect Covid-19 cases. The best method was selected as SVM out of the five methods [40].
In this study, the same data set that was used in studies of [31–40] has been collected from, public database, Kaggle [41] to predict Covid-19 severity level. The preferred data set contains 111 blood analyses with a required hospitalization type of 5644 patients yet a huge part of the data contains missing values. Furthermore, the distribution of the output variables in the dataset was highly imbalanced since only 10% of cases are confirmed as positive. Some environmental variables, such as modeling mistakes, external disruptions, outliers, and uncertainties, cause complex systems to have some problems [42]. Due to modeling errors and parameter adjustments, uncertainties that affect the reliability and efficiency of the model occur in functional interconnected systems [43]. Therefore it is a necessity to consider these disturbances with alternative approaches like Markov jump systems (MJS) and fault detection, etc. as suggested in studies [42, 44]. MJS and fault detection filtering methods are a good way of describing complex systems with external disturbances [42] Besides, more detailed knowledge of system parameters improves the efficiency of the model. Therefore, methods like state filtering as well as parameter estimation can be important performance and accuracy factors [45] presents an alternative strategy with a system identification method for models with unknown parameters. Hence, in this study, preprocessing steps were carefully applied before establishing a prediction model when uncertainties in the data set and mentioned studies were considered. However, in this work, a different and more simple approach than studies of [42–45] has been implemented for uncertainties like missing values, outliers, and an imbalanced number of output variables. Missing values were filled with iterative imputations methods and over-sampling technique was used to change the imbalance situation while outliers were not removed from the model since they could provide hidden patterns with patient’s anomalous blood samples.
Although the same data set has been studied for machine learning in more than one study seems to be a disadvantage for originality, the fact that the subject is very new and serves a worldwide problem is the biggest value that this study will bring to the literature. In the literature, there is a gap for making predictions on the hospitalization type of Covid-19 patients by using blood samples. Several machine learning studies have been done on hospitalization type of patients with blood samples yet in these studies, different models have been created for each type of hospitalization. Having an individual model for each hospitalization type will not be practical for real-life applications since new arrival patient’s hospitalization type will be unknown, it will be confusing to decide which model to use. Therefore, it is a necessity to have only one model, like in this study, that could predict the hospitalization type of the patients. Having a machine learning model could provide a fast diagnosis to patients and be a practical solution for health care workers. Indeed, in this paper, differences have also captured from the previous studies with the techniques that have used and possible contributions have listed below:
Most of the studies in the literature, the cases have focused on where the model output gives the Covid-19 result as positive or negative. The model output in this study will be the unit to which the patient will be referred, and the data preprocessing procedure will be made in consideration of this situation.
Attributes used for machine learning model creation have been emphasized and compared with different captured features in previous studies. The effect of each feature on the prediction of which unit the patient will be referred to has been analyzed, rather than the prediction of Covid-19 result being positive and negative.
Machine learning methods, which are frequently used in the literature, were preferred yet data preprocessing methods were not emphasized. In many studies, null values in the data set were ignored and this caused the loss of the total number of observations and the number of features in the data set. In this work, in addition to the methods frequently encountered in the literature, less common machine learning methods have been adopted and success rates have been compared for each method and great importance has been given to data preprocessing. Not ignoring the blank values in the data set, adding them to the model has provided different methods than literature. Thus, the model was created without losing the best possible number of observations and attributes in the data set.
To emphasize the importance of data preprocessing steps, accuracy scores of the pre–post situations have given and hyperparameter estimation has been studied for the most successful methods to achieve better accuracy scores.
Method
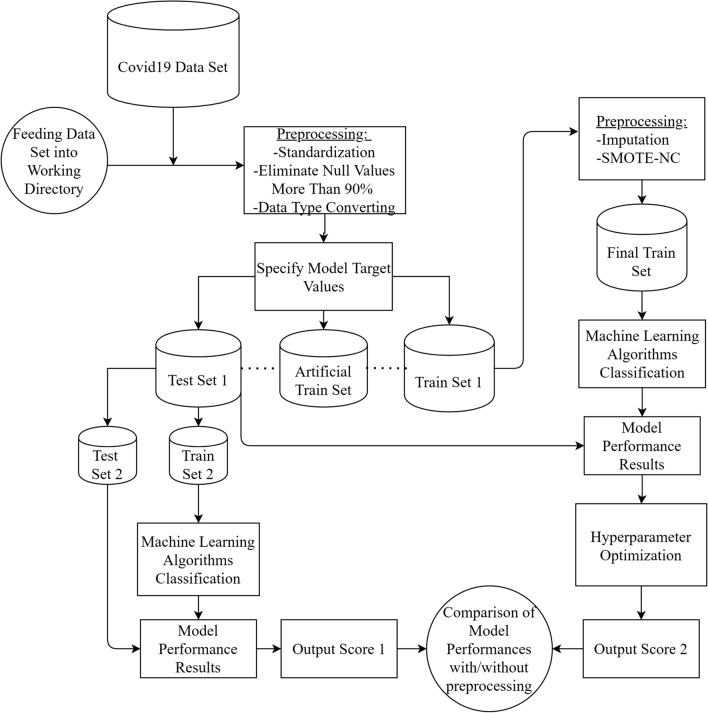
The method of the conducted study consisted of two main stages. Figure 1 represents each step applied to both the train and test set and summarizes the study. In the first stage, null observations and features were eliminated from the data, standardization, data type converting applied and output value has specified as a target. The target value of the model was separated into 4 classes that show patient hospitalization type whether it is no hospitalization, regular ward, semi-intensive care, or intensive care. After this first preprocessing step, test set 1 which contains 33 blood and laboratory results of 294 patients has been created and shown in Fig. 1. Then, 80% of the test set 1 which is indicated as a train set 2, used for training of 8 machine learning models while 20% of the test set 1 which is denoted as a test set 2, was used for evaluation of the model performances. At the end of stage 1, the best accuracy result has been obtained and shown in Fig. 1 as output score 1.
Fig. 1.
Workflow diagram of the study
In the second stage, preprocessing applications have emphasized. Train set 1 had many null values and machine learning algorithms are not able to work with null values. Therefore, the regression-based iterative imputation method has been applied to fill null values in the training set. Target value distribution was very unbalanced and patients who need semi-intensive and intensive care unit treatment were the only %2 of the total observations. It is necessary to have balanced data because machine learning algorithms could be biased toward the majority class and this could lead to problems that are underfitting or overfitting [46]. Hence, after imputing null values over-sampling method has been used to achieve more balanced data under the consideration of the WHO report [47]. After preprocessing applications, a train set 1 which includes 33 blood and laboratory results of 863 patients used to train 8 different machine learning models. Hyperparameter optimization has been applied to the best model to achieve better prediction results with gridsearchcv. The best model score has indicated as output score 2 and as seen in Fig. 1, output score 1 (without preprocessing) and output score 2 (with preprocessing) has compared.
Data preprocessing
Many factors affect the success of machine learning models. One of the most important dependents for the success of the machine learning models is the quality of training data [48]. If there is irrelevant, redundant information, and unreliability is present or missing values exist in the data, model accuracy will have poor results. Therefore, to build more successful models, data preprocessing techniques can be used for cleaning, normalization, transformation, imputation, and feature extraction, etc. [49].
Imputing missing values
For most real-life cases, incomplete data are an unavoidable problem. It is one of the handled problems in data preparation steps [49]. The missing values in the data set might generate bias and cause the performance loss of classification algorithms [50]. Therefore, it is important to take an action for missing values within the data set. There are different approaches for filling the missing values, which are replacing with the most common value, replacing with mean value, treating missing values as a special case, and regression-based iterative imputation methods [49].
Data set balancing
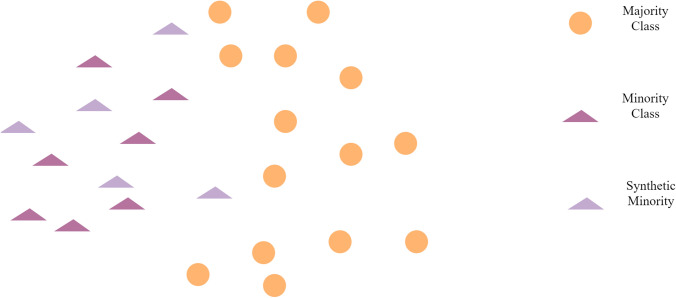
An imbalance situation can be defined as when the number of instances of majority class is much higher than the number of minority class instances, and this problem is very common while working on real-life cases [46, 51]. Having balanced data is important since machine learning algorithms could be biased toward the majority class and this might lead to underfitting or overfitting problems [46]. The synthetic minority over-sampling technique (SMOTE) generates synthetic instances from the minority class by using available information in data while the simple over-sampling method replicates the available data and under-sampling removes the majority class from data [46]. Therefore, SMOTE is a widely used method for imbalance problems since it potentially performs better than simple sampling methods by preventing over/underfitting problems [52]. To better understanding, the visual representation of SMOTE is given below as Fig. 2.
Fig. 2.
SMOTE
Machine learning algorithms
Before having the final model, eight different machine learning algorithms which are decision tree (DT), random forest (RF), k nearest neighbor (KNN), support vector classifier (SVC), gradient boosting (GB), Gaussian naive bayes (GNB), multi-layer perceptron (MLP), and Gaussian process (GP) classifier were applied to predict the severity level of the disease.
A decision tree is a method that divides search space into smaller parts and searches for each part by asking yes/no questions. Random forest is a combination of a bunch of decision trees which could be thought of as a forest with many trees [53]. K nearest neighbor is the simplest algorithm that makes predictions on new data based on k nearest points [54]. Support vector classifier classifies outputs by finding the hyperplane that differentiates classes well [55]. The gradient boosting method can be constructed based on base learners and the loss function. The intuition behind the algorithm is reducing loss function at each iteration by having more accurate results [56]. Gaussian naive bayes is a supervised learning algorithm in which probabilities of each attribute that belongs to each output are considered while making classification [55]. Multi-layer perceptron is a feedforward neural network that consists of at least three layers which are input, hidden, and output. It is a popular machine learning method for complex problems [53]. Gaussian process classifier is also a promising method since it allows Bayesian treatment of classification problems and it applies a probabilistic and practical approach to learning [57].
Random forest
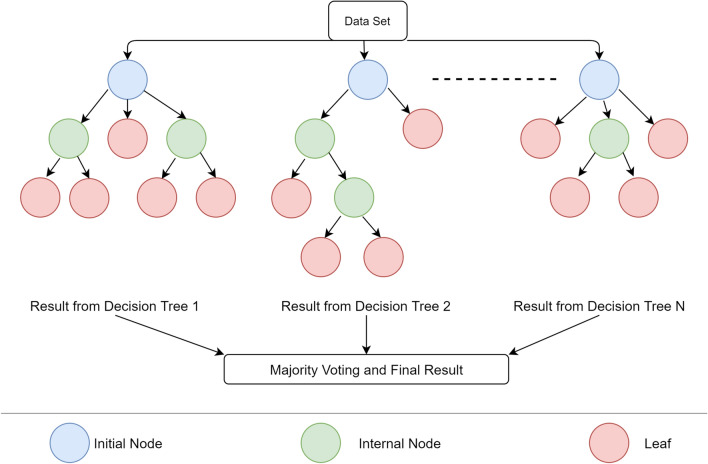
The random forest consists of a combination of an N number of trees where N can be defined by users and each tree makes a single vote to input vector (x) for assigning the most frequent class [58]. Random forest is a forest that contains many decision trees in it and the related illustration has given in Fig. 3. Attribute selection and pruning methods are required processes in the design of a decision tree. RF classifier uses a Gini Index as an attribute selection measure which is a measurement of the attribute impurity with respect to the classes. However, RF has a great advantage over decision tree structure since it can grow without pruning [58]. Breiman mentions that the generalization error always converges even without pruning as the number of trees increases [59].
| 1 |
| 2 |
Fig. 3.
Random forest
Random forest algorithm decision criteria were given in Eq. 1 where b(x) is the class prediction of bth random forest tree and Gini Index given in Eq. 2 where f(Ci,T) represents the probability that the selected case belongs to class Ci.
Performance metrics
The confusion matrix that is given in Fig. 4 is a metric that shows the performance of the model. There are four elements considered during performance measurement. True-positive (TP) and false-positive (FP) values indicate that when the patient carries the virus and diagnosed as true or false. On the other hand, true-negative (TN) and false-negative (FN) are the situations where the patient does not carry disease and was diagnosed as false or true. From a single confusion matrix, four different performance scores can be calculated such as accuracy, precision, recall, and F1.
| 3 |
| 4 |
| 5 |
| 6 |
Fig. 4.
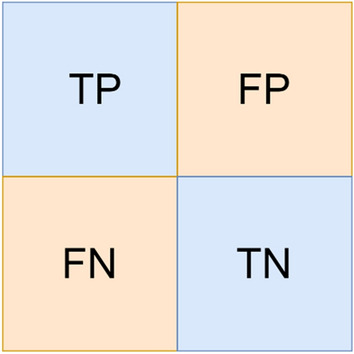
Confusion matrix
Accuracy, in Eq. (3) represents the ratio of predicted true cases out of all classes. Precision gives the ratio of TP predictions that are positive while recall shows how many TP predictions are made out of all correct classification. F1 score which was given Eq. (6) is a measurement of harmonic mean to penalize extreme values and to measure Recall and Precision at the same time [53].
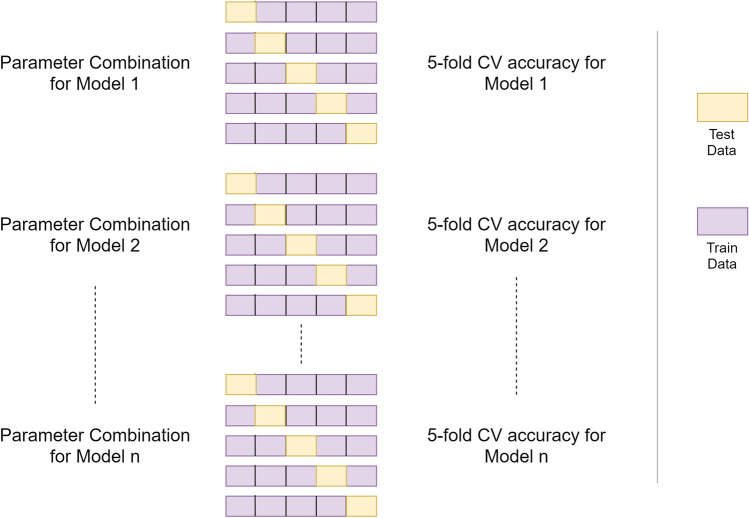
Adjustments in performance scores can be made by changing and finding the optimum hyperparameters. Hyperparameters are parameters that could be defined by users before the learning process to determine how the model will be trained. Gridsearchcv is one the method among all other methods for hyperparameter optimization. It tries all possible pairs of given parameters (a, b, c, d) as shown in Fig. 5 and uses k-fold cross-validation to achieve better performance. After trying all possible pairs, it decides the best values for given parameters [60].
Fig. 5.
Illustration of grid search CV
Result and discussion
Preprocessing in data science has become a need with big data engagement. Most of the real-life data retrieved from any database have lots of missing, irrelevant, and dirty features and observations. Therefore, it is required to preprocess data for further investigations and applications.
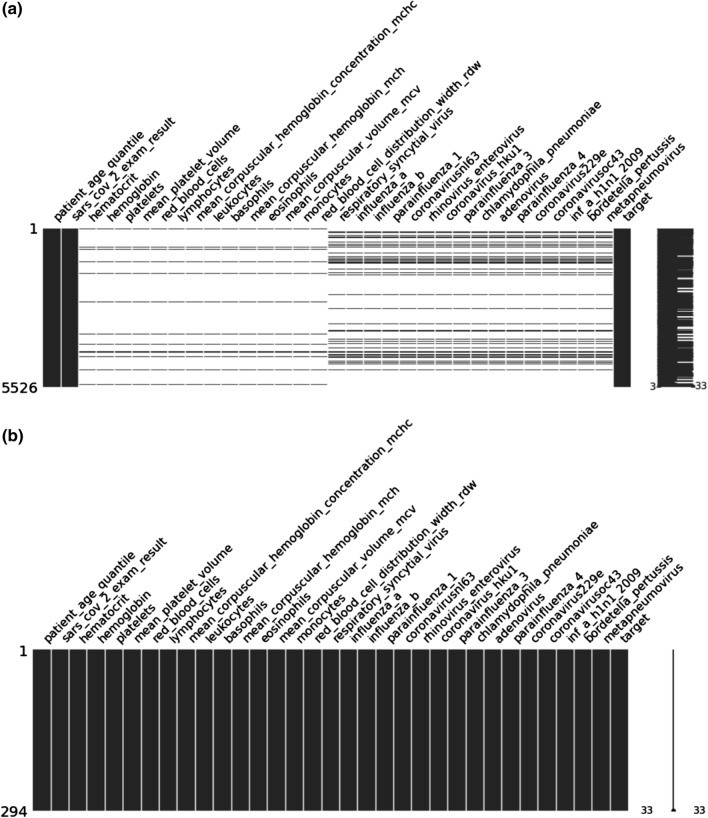
Initial data that was retrieved from [41] has 5644 observations and 111 features which has an enormous number of null values. To perform machine learning methods, null values should be removed from the data set. Hence, features with 90% null values were eliminated as an initial step. Furthermore, patients who are neither infected nor exposed to Covid-19 and still sent to the regular ward (RW), semi-intensive care unit (SICU), or intensive care unit (ICU) were also removed from the data set since they will create irrelevance. To compare initial data with cleared data Fig. 6 was given. After elimination of features that have null values of more than 90%, removing irrelevant observations, and selecting the target feature as a hospitalization type, 33 features have remained as can be seen in Fig. 6a. Instead of filling all null values directly, applying preliminary machine learning methods was found more suitable to which method should be chosen as an imputer. Hence, non-null values represented as a test set 1 in Fig. 1 and Fig. 6b were selected for preliminary machine learning study.
Fig. 6.
a Initial data and b Cleared data
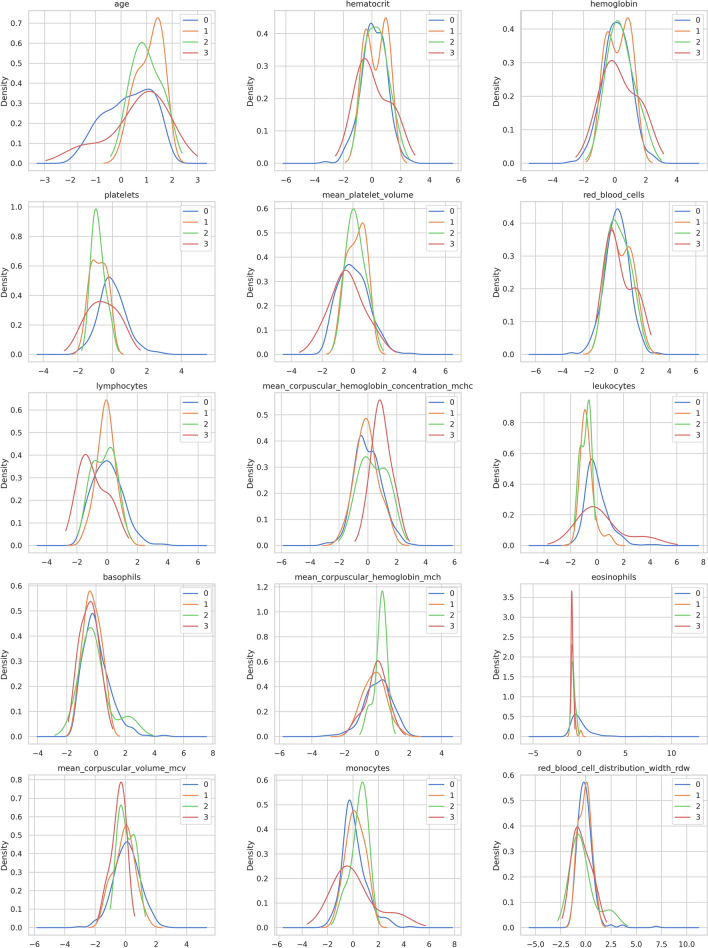
To observe distribution in each feature which was grouped by the target variable kernel density estimate (kde) was plotted and given in Fig. 7. Kde plot is a method to visualize the distribution of observations in the dataset like histograms yet they are more flexible and used to make more flexible estimates. According to Fig. 7; age, eosinophils, mean_corpuscular_hemoglobin_mch could be distinctive features as an initial argument since those features have certain differences especially under the target values. In the figure, healthy patients, RW, SICU, and ICU were indicated as 0, 1, 2, 3, respectively.
Fig. 7.
Distribution of each feature under target variable
In stage-one, eight different machine learning algorithms were executed and the confusion matrix of gradient boosting classifier returned the highest accuracy score. Although gradient boosting classifier was the best method before stage 2, it could not correctly classify SICU and ICU as seen in Fig. 8.
Fig. 8.
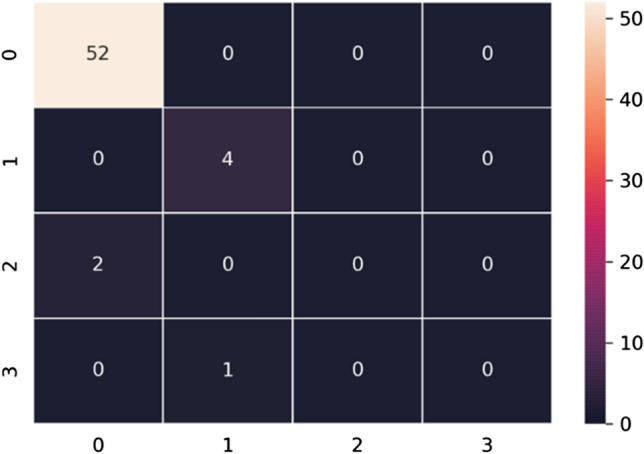
Confusion matrix of gradient boosting
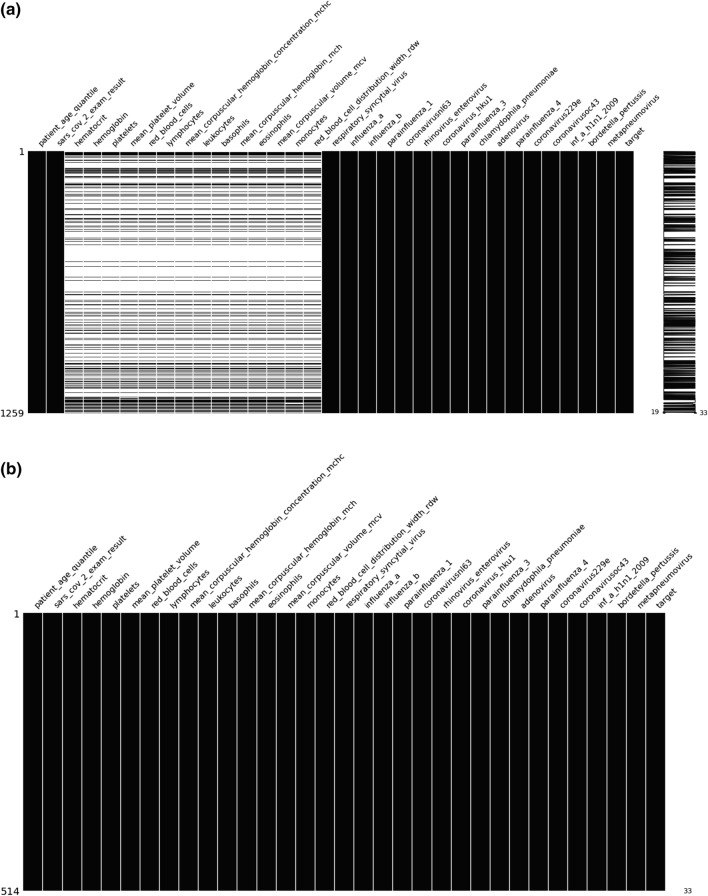
To initialize stage-two, imputation was applied with gradient boosting, since it gave the highest score on the test set 1. To fill null values with gradient boosting imputer, observations with non-null categorical features which is demonstrated in Fig. 9a and denoted as a train set 1 in Fig. 1 were selected and imputation was applied to numeric features. Then, 514 observations were obtained after removing duplicated rows which are generated due to the imputation step and displayed in Fig. 9b.
Fig. 9.
a Data before imputation and b After imputation and duplicate row elimination
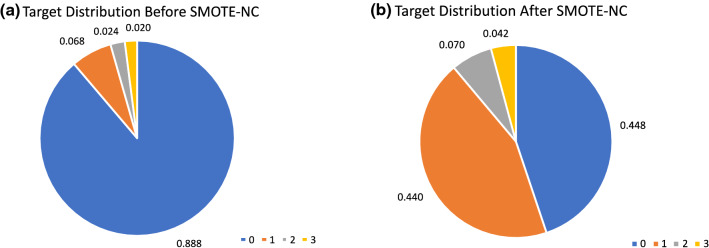
Imputed data set was used for SMOTE-NC which oversamples the minority class and the final train set which was introduced in Fig. 1, formed with SMOTE-NC included 387 negatives, 380 RW, 60, SICU, and 36 ICU cases based on the report of WHO [47]. Before and after the SMOTE-NC application, the distribution of target values was given in Fig. 10. In the figure, healthy patients, RW, SICU, and ICU were indicated as 0, 1, 2, 3, respectively.
Fig. 10.
Target distribution of data a Before SMOTE-NC b After SMOTE-NC
Finally, eight machine learning methods were run on the final train set and the best result was obtained with tuned Random Forest (RF). Optimized hyperparameters of RF were given in Table 1 and the confusion matrix was given in Fig. 11 while classification reports of before-after preprocessing situations were given in Tables 2 and 3. Compared to Fig. 8, a promising improvement has been accomplished with the ability to predict both SICU and ICU 100% recall score as seen in Fig. 11.
Table 1.
Tuned hyperparameters of random forest
| max_depth | min_samples_leaf | min_samples_split | n_estimators | random_state |
|---|---|---|---|---|
| 15 | 0.001 | 3 | 750 | 21 |
Fig. 11.
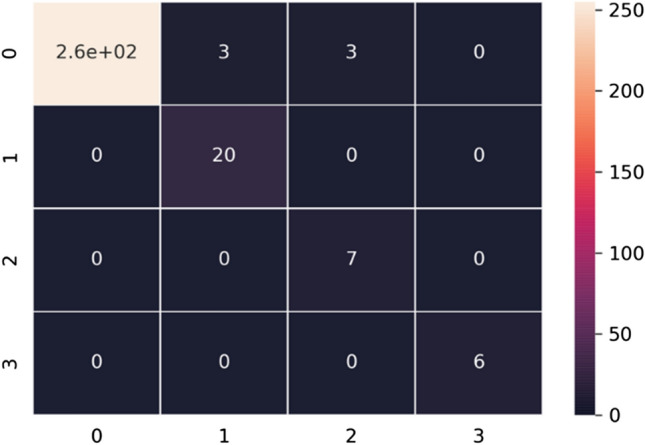
Confusion matrix of random forest
Table 2.
Classification report of gradient boosting classifier before preprocessing
| Target | Precision | Recall | F1-score | Accuracy |
|---|---|---|---|---|
| 0 | 0.96 | 1.00 | 0.98 | 0.9492 |
| 1 | 0.80 | 1.00 | 0.89 | |
| 2 | 0.00 | 0.00 | 0.00 | |
| 3 | 0.00 | 0.00 | 0.00 |
Table 3.
Classification report of random forest classifier after preprocessing
| Target | Precision | Recall | F1-score | Accuracy |
|---|---|---|---|---|
| 0 | 1.00 | 0.98 | 0.99 | 0.9796 |
| 1 | 0.87 | 1.00 | 0.93 | |
| 2 | 0.70 | 1.00 | 0.82 | |
| 3 | 1.00 | 1.00 | 1.00 |
Even though accuracy is one of the most common metric for evaluating model performance, while having more than two output variables, it is important to make evaluations based on other scores such as recall and precision. Without preprocessing, model accuracy was found to be 94.92% while precision and recall scores were found as 0 and demonstrated in Table 2. The initial model with gradient boosting was terrible at predicting SICU and ICU types yet the model accuracy was quite high. Therefore, it is significant to consider recall and precision metrics especially in medical diagnosis and unbalanced data. After preprocessing, an increase in all model metrics could be observed in Table 3. Having preprocessed data resulted in 97.96% accuracy and 100% recall scores while making predictions on hospitalization types such as RW, SICU, and ICU.
The developed model had four different time-consuming computational processes: Gradient boosting imputation, SMOTE-NC, RF, and hyperparameter optimization (HPO) which took 112.0, 0.35, 0.30, and 62.3 s, respectively, with Intel i7-7700HQ 2.80 GHz CPU and 16 GB RAM. Hyperparameter optimization was done with gridsearchcv and computational time was depending on the number of user-defined parameters and search space.
In studies of [34, 37, 39] a similar approach has been proposed in terms of predicting hospitalization type, and their performance metrics were given in Table 4. In [34] empty values were filled with 0 and 41 exams have used for predicting whether the patient should be sent to RW, SICU, ICU, or no hospitalization. They reached the best score with RF. Similar work was done for classification of the regular ward and not admitted to hospitalization [37]. SMOTE has applied to make a balance in positive negative cases. [39] worked on preprocessing; used MICE imputation method to fill empty values and SMOTE for data balance. Our study was able to achieve a 100% recall score by RF while making predictions on hospitalization type. Furthermore, this study utilizes gradient boosting to fill null values while other studies in the literature preferred whether removing all the null values or filling them with simple metrics such as mean and median. Previous studies built different models for each hospitalization type separately while ours consider each target in one model which leads to more precise and generalized conclusions for hospitalization type. Even though there are strengths of the proposed model when compared to similar studies, there are limitations for the created model. One of the limiting factors was the loss of information by having many null values. Having an unknown parameter brings difficulty to the model as emphasized in the study [45]. After the elimination of features that have more than 90% null values, the remaining features are imputed to avoid the loss of information. Therefore, the prediction model was built with known parameters after irreversible uncertainties were eliminated. The other difficulty with the proposed solution was having unbalanced data with a significantly fewer number of patients who need SICU and ICU treatment. Although Coronavirus spreads very fast, the ratio of patients who need SICU and ICU treatment was less due to the mortality rate of the virus [47] and the proposed model was had to be created with an unbalanced situation even though the SMOTE-NC method was applied. Besides these difficulties, the other limitation of the proposed model was making less accurate predictions on healthy patients. The model was able to predict the right hospitalization type with 100% recall yet it was not that successful while predicting healthy patients. According to the proposed model, six healthy patients required regular ward and semi-intensive care unit treatment even though these six patients were neither infected nor exposed to the Covid-19 virus. This drawback was still less fatal than wrong predictions on SICU and ICU. Referring the healthy patients to SICU and ICU might cause temporary psychological effects on patients and waste of hospital resources while in the exact opposite situation it would increase the spread of the disease and number of deaths enormously due to the wrong diagnosis.
Table 4.
Similar approaches with Einstein data set
Conclusion
At the end of 2019, Covid-19 has spread all over the world and become a serious problem for many people. The Covid-19 remains the biggest problem for many countries due to its rapid spread and uncertain situation. One of the problems with Covid-19 related to its uncertainty is having symptoms that are similar to other viral infectious diseases and therefore, making diagnosis processes harder. There are many studies on Covid-19 to discover and make contributions to the investigation of the virus. Among similar studies, this study aimed to early diagnosis of Covid-19 with machine learning algorithms by using only blood samples. Even though machine learning algorithms are proposed in various papers with the same data set, the importance of the problem makes this study valuable and also building a model based on the prediction of the severity level of the disease, variety of different algorithms, and a significant amount of data preprocessing steps differentiates this study from others. In the conducted study, the aim was set to predict the severity level of the Covid-19 disease with eight different machine learning algorithms. Therefore, model output was indicating the referred hospitalization type rather than positive or negative results. Moreover, the importance of data preprocessing was made based on the output values, and model performance was emphasized by making a comparison on classification scores between preprocessed and not preprocessed data. According to experiment results, in un- preprocessed data the best prediction algorithm was found by GB with 0.91 accuracy; while in preprocessed data, the best method was achieved 0.98 accuracy and 1 recall, precision, F1 scores with hyperparameter tuned RF.
For future research, the used data set might be used for achieving better results with deep neural networks. A different dataset that might be smaller and more flexible could be prepared based on the features included in this dataset with additional variables. This data includes blood samples of patients only from one country, patients from various countries might have different blood samples respond to the Covid-19 and this information might lead to an alternative approach that might be more beneficial for prediction results.
Declarations
Conflict of interest
The authors declare that they have no conflict of interest.
Footnotes
Publisher's Note
Springer Nature remains neutral with regard to jurisdictional claims in published maps and institutional affiliations.
References
- 1.Schumaker E (2020) Timeline: how coronavirus got started. https://abcnews.go.com/Health/timeline-coronavirus-started/story?id=69435165. Accessed 22 Sep 2020
- 2.World Health Organization (2020) https://www.who.int/health-topics/coronavirus#tab=tab_3. Accessed 22 Sep 2020
- 3.Adhikari SP, Meng S, Wu YJ, Mao YP, Ye RX, Wang QZ, Sun C, Sylvia S, Rozelle S, Raat H, Zhou H. Epidemiology, causes, clinical manifestation and diagnosis, prevention and control of coronavirus disease (COVID-19) during the early outbreak period: a scoping review. Infect Dis Poverty. 2020;9:1–12. doi: 10.1186/s40249-020-00646-x. [DOI] [PMC free article] [PubMed] [Google Scholar]
- 4.Döhla M, Boesecke C, Schulte B, Diegmann C, Sib E, Richter E, Eschbach-Bludau M, Aldabbagh S, Marx B, Eis-Hübinger AM, Schmithausen RM, Streeck H. Rapid point-of-care testing for SARS-CoV-2 in a community screening setting shows low sensitivity. Public Health. 2020;182:170–172. doi: 10.1016/j.puhe.2020.04.009. [DOI] [PMC free article] [PubMed] [Google Scholar]
- 5.Ranney ML, Griffeth V, Jha AK. Critical supply shortages - the need for ventilators and personal protective equipment during the covid-19 pandemic. N Engl J Med. 2020;382:e41. doi: 10.1056/NEJMp2006141. [DOI] [PubMed] [Google Scholar]
- 6.Siordia JAJ. Epidemiology and clinical features of COVID-19: A review of current literature. J Clin Virol. 2020;127:104357. doi: 10.1016/j.jcv.2020.104357. [DOI] [PMC free article] [PubMed] [Google Scholar]
- 7.Chen H, Guo J, Wang C, Luo F, Yu X, Zhang W, Li J, Zhao D, Xu D, Gong Q, Liao J, Yang H, Hou W, Zhang Y. Clinical characteristics and intrauterine vertical transmission potential of COVID-19 infection in nine pregnant women: a retrospective review of medical records. Lancet. 2020;395:809–815. doi: 10.1016/S0140-6736(20)30360-3. [DOI] [PMC free article] [PubMed] [Google Scholar]
- 8.Li G, Fan Y, Lai Y, Han T, Li Z, Zhou P, Pan P, Wang W, Hu D, Liu X, Zhang Q, Wu J. Coronavirus infections and immune responses. J Med Virol. 2020;92:424–432. doi: 10.1002/jmv.25685. [DOI] [PMC free article] [PubMed] [Google Scholar]
- 9.Ashour HM, Elkhatib WF, Rahman M, Elshabrawy HA. Insights into the recent 2019 novel coronavirus (SARS-CoV-2) in light of past human coronavirus outbreaks. Pathogens. 2020;9:186. doi: 10.3390/pathogens9030186. [DOI] [PMC free article] [PubMed] [Google Scholar]
- 10.Yang X, Yu Y, Xu J, Shu H, Xia J, Liu H, Wu Y, Zhang L, Yu Z, Fang M, Yu T, Wang Y, Pan S, Zou X, Yuan S, Shang Y. Clinical course and outcomes of critically ill patients with SARS-CoV-2 pneumonia in Wuhan, China: a single-centered, retrospective, observational study. Lancet Respir Med. 2020;8:475–481. doi: 10.1016/S2213-2600(20)30079-5. [DOI] [PMC free article] [PubMed] [Google Scholar]
- 11.Chen N, Zhou M, Dong X, Qu J, Gong F, Han Y, Qiu Y, Wang J, Liu Y, Wei Y, Xia J, Yu T, Zhang X, Zhang L. Epidemiological and clinical characteristics of 99 cases of 2019 novel coronavirus pneumonia in Wuhan, China: a descriptive study. Lancet. 2020;395:507–513. doi: 10.1016/S0140-6736(20)30211-7. [DOI] [PMC free article] [PubMed] [Google Scholar]
- 12.Wang D, Hu B, Hu C, Zhu F, Liu X, Zhang J, Wang B, Xiang H, Cheng Z, Xiong Y, Zhao Y, Li Y, Wang X, Peng Z. Clinical characteristics of 138 hospitalized patients with 2019 novel coronavirus-infected pneumonia in Wuhan, China. JAMA. 2020;323:1061–1069. doi: 10.1001/jama.2020.1585. [DOI] [PMC free article] [PubMed] [Google Scholar]
- 13.Yan L, Zhang HT, Goncalves J, Xiao Y, Wang M, Guo Y, Sun C, Tang X, Jing L, Zhang M, Huang X, Xiao Y, Cao H, Chen Y, Ren T, Wang F, Xiao Y, Huang S, Tan X, Huang N, Jiao B, Cheng C, Zhang Y, Luo A, Mombaerts L, Jin J, Cao Z, Li S, Xu H, Yuan Y. An interpretable mortality prediction model for COVID-19 patients. Nat Mach Intell. 2020;2:283–288. doi: 10.1038/s42256-020-0180-7. [DOI] [Google Scholar]
- 14.Castelnuovo AD, Bonaccio M, Costanzo S, et al. Common cardiovascular risk factors and in-hospital mortality in 3,894 patients with COVID-19: survival analysis and machine learning-based findings from the multicentre Italian CORIST Study. Nutr Metab Cardiovasc Dis. 2020;30:1899–1913. doi: 10.1016/j.numecd.2020.07.031. [DOI] [PMC free article] [PubMed] [Google Scholar]
- 15.Sarkar J, Chakrabarti P (2020) A machine learning model reveals older age and delayed hospitalization as predictors of mortality in patients with COVID-19. medRxiv. 10.1101/2020.03.25.2004333
- 16.Wu P, Duan F, Luo C, Liu Q, Qu X, Liang L, Wu K. Characteristics of ocular findings of patients with coronavirus disease 2019 (COVID-19) in Hubei Province, China. JAMA Ophthalmol. 2020;138:55–578. doi: 10.1001/jamaophthalmol.2020.1291. [DOI] [PMC free article] [PubMed] [Google Scholar]
- 17.Pelayo J, Lo KB, Bhargav R, Gul F, Peterson E, Lii RD, Salacup GF, Albano J, Gopalakrishnan A, Azmaiparashvili Z, Patarroyo-Aponte G, Rangaswami J. Clinical characteristics and outcomes of community- and hospital-acquired acute kidney injury with COVID-19 in a US inner city hospital system. Cardiorenal Med. 2020;10:223–231. doi: 10.1159/000509182. [DOI] [PMC free article] [PubMed] [Google Scholar]
- 18.Rao ASRS, Vazquez JA. Identification of COVID-19 can be quicker through artificial intelligence framework using a mobile phone–based survey when cities and towns are under quarantine. Infect Control Hosp Epidemiol. 2020;41:826–830. doi: 10.1017/ice.2020.61. [DOI] [PMC free article] [PubMed] [Google Scholar]
- 19.Malki Z, Atlam ES, Hassanien AE, Dagnew G, Elhosseini MA, Gad I. Association between weather data and COVID-19 pandemic predicting mortality rate: Machine learning approaches. Chaos Solitons Fract. 2020;138:110137. doi: 10.1016/j.chaos.2020.110137. [DOI] [PMC free article] [PubMed] [Google Scholar]
- 20.Wang P, Zheng X, Li J, Zhu B. Prediction of epidemic trends in COVID-19 with logistic model and machine learning technics. Chaos Solitons Fract. 2020;139:110058. doi: 10.1016/j.chaos.2020.110058. [DOI] [PMC free article] [PubMed] [Google Scholar]
- 21.Barstugan M, Ozkaya U, Ozturk S (2020) Coronavirus (COVID-19) classification using CT ımages by machine learning methods. eprint arXiv:2003.09424
- 22.Li L, Qin L, Xu Z, et al. Artificial intelligence distinguishes COVID-19 from community acquired pneumonia on chest CT. Radiology. 2020;296:66–72. doi: 10.1148/radiol.2020200905. [DOI] [PMC free article] [PubMed] [Google Scholar]
- 23.Mei X, Lee HC, Diao, , et al. Artificial intelligence-enabled rapid diagnosis of patients with COVID-19. Nat Med. 2020;8:1224–1228. doi: 10.1038/s41591-020-0931-3. [DOI] [PMC free article] [PubMed] [Google Scholar]
- 24.Xu X, Jiang X, Ma C, Du P, Li X, Lv S, Yu L, Ni Q, Chen Y, Su J, Lang G, Li Y, Zhao H, Liu J, Xu K, Ruan L, Sheng J, Qiu Y, Wu W, Liang T, Li L. A deep learning system to screen novel coronavirus disease 2019 pneumonia. Eng. 2020;6(10):1122–1129. doi: 10.1016/j.eng.2020.04.010. [DOI] [PMC free article] [PubMed] [Google Scholar]
- 25.Zheng C, Deng X, Fu Q et al (2020) Deep learning-based detection for COVID-19 from chest CT using weak label. medRxiv. 10.1101/2020.03.12.20027185
- 26.Varela-Santos S, Melin P. A new approach for classifying coronavirus COVID-19 based on its manifestation on chest X-rays using texture features and neural networks. Inf Sci. 2021;545:403–414. doi: 10.1016/j.ins.2020.09.041. [DOI] [PMC free article] [PubMed] [Google Scholar]
- 27.Murphy KP. Machine learning a probabilistic perspective. Cambridge, Massachussetts: The MIT Press; 2012. [Google Scholar]
- 28.Fan BE, Chong VCL, Chan SSW, et al. Hematologic parameters in patients with COVID-19 infection. Am J Hematol. 2020;95:1442. doi: 10.1002/ajh.25774. [DOI] [PubMed] [Google Scholar]
- 29.Tan L, Wang Q, Zhang D, et al. Lymphopenia predicts disease severity of COVID-19: a descriptive and predictive study. Signal Transduct Target Ther. 2020;5:1–3. doi: 10.1038/s41392-020-0148-4. [DOI] [PMC free article] [PubMed] [Google Scholar]
- 30.Gao Y, Li T, Han M, et al. Diagnostic utility of clinical laboratory data determinations for patients with the severe COVID-19. J Med Virol. 2020;92:791–796. doi: 10.1002/jmv.25770. [DOI] [PMC free article] [PubMed] [Google Scholar]
- 31.Avila E, Dorn M, Alho CS, Kahmann A. Hemogram data as a tool for decision-making in COVID-19 management: applications to resource scarcity scenarios. Peer J. 2020;8:e9482. doi: 10.7717/peerj.9482. [DOI] [PMC free article] [PubMed] [Google Scholar]
- 32.Soares F, Villavicencio A, Fogliatto FS et al (2020) A novel specific artificial intelligence-based method to identify COVID-19 cases using simple blood exams. medRxiv. 10.1101/2020.04.10.20061036
- 33.Batista AFDM, Miraglia JL, Donato THR, Filho ADPC (2020) COVID-19 diagnosis prediction in emergency care patients: a machine learning approach. medRxiv. 10.1101/2020.04.04.20052092
- 34.Barbosa VADF, Gomes JC, Santana Mad et al (2020) Covid-19 rapid test by combining a random forest based web system and blood tests. medRxiv. 10.1101/2020.06.12.20129866 [DOI] [PMC free article] [PubMed]
- 35.Alakus TB, Turkoglu I. Comparison of deep learning approaches to predict COVID-19 infection. Chaos Solitons Fractal. 2020;140:110120. doi: 10.1016/j.chaos.2020.110120. [DOI] [PMC free article] [PubMed] [Google Scholar]
- 36.Sun L, Song F, Shi N, et al. Combination of four clinical indicators predicts the severe/critical symptom of patients infected COVID-19. J ClinVirol cilt. 2020;128:104431. doi: 10.1016/j.jcv.2020.104431. [DOI] [PMC free article] [PubMed] [Google Scholar]
- 37.Banerjee A, Ray S, Vorselaar B, et al. Use of machine learning and artificial ıntelligence to predict SARS-CoV-2 infection from full blood counts in a population. Int Immunopharmacol. 2020;86:106705. doi: 10.1016/j.intimp.2020.106705. [DOI] [PMC free article] [PubMed] [Google Scholar]
- 38.Hossain MR, Bharati S, Podder P, Podder P. Data analytics for novel coronavirus disease. Inform Med Unlocked. 2020;20:100374. doi: 10.1016/j.imu.2020.100374. [DOI] [PMC free article] [PubMed] [Google Scholar]
- 39.Schwab P, Schütte AD, Dietz B, Bauer S. predCOVID-19: clinical predictive models for covid-19: systematic study. J Med Internet Res. 2020;22:e21439. doi: 10.2196/21439. [DOI] [PMC free article] [PubMed] [Google Scholar]
- 40.YaoH ZN, Zhang R, et al. Severity detection for the coronavirus disease 2019 (COVID-19) patients using a machine learning model based on the blood and urine tests. Front Cell Dev Biol. 2020;8:683. doi: 10.3389/fcell.2020.00683. [DOI] [PMC free article] [PubMed] [Google Scholar]
- 41.Kaggle (2020) https://www.kaggle.com/einsteindata4u/covid19. Accessed: 28 Mar 2020
- 42.Dong X, He S, Stojanovic V. Robust fault detection filter design for a class of discrete-time conic-type non-linear Markov jump systems with jump fault signals. IET. 2020;14:1912–1917. [Google Scholar]
- 43.Longhui Z, Tao H, Paszke W, et al. PD-type iterative learning control for uncertain spatially interconnected systems. Mathematics. 2020;8:1528. doi: 10.3390/math8091528. [DOI] [Google Scholar]
- 44.Zhang X, Yin Y, Wang H, He S. Finite-time dissipative control for time-delay Markov jump systems with conic-type non-linearities under guaranteed cost controller and quantiser. IET Control Theory Appl. 2020;15:489–498. doi: 10.1049/cth2.12031. [DOI] [Google Scholar]
- 45.Stojanovic V, He S, Zhang B. State and parameter joint estimation of linear stochastic systems in presence of faults and non-Gaussian noises. Int J Robust Nonlinear Control. 2020;30:1–18. doi: 10.1002/rnc.5131. [DOI] [Google Scholar]
- 46.Shakeel F, Sabhitha AS, Sharma S (2017) Exploratory review on class imbalance problem: an overview. In: 2017 8th international conference on computing, communication and networking technologies (ICCCNT). IEEE, pp 1–8
- 47.W. H. Organization (2020) https://www.who.int/indonesia/news/detail/08-03-2020-knowing-the-risk-for-covid-19#:~:text=Most%20people%20. Accessed 8 Mar 2020
- 48.Kamiran F, Calders T. Data preprocessing techniques for classification without discrimination. KAIS. 2011;33:1–33. [Google Scholar]
- 49.Kotsiantis SB, Kanellopoulos D, Pintelas PE. Data preprocessing for supervised learning. Int J Comput Inf Eng. 2007;1:4104–4109. [Google Scholar]
- 50.Zhang S, Wu X, Zhu M (2010) Efficient missing data imputation for supervised learning. In: 9th IEEE international conference on cognitive informatics (ICCI'10). IEEE, pp 672–679
- 51.Koivu A, Sairanen M, Airola A, Pahikkala T. Synthetic minority oversampling of vital statistics data with generative adversarial networks. J Am Med Inform Assoc. 2020;27:1667–1674. doi: 10.1093/jamia/ocaa127. [DOI] [PMC free article] [PubMed] [Google Scholar]
- 52.Lusa L (2012) Evaluation of smote for high-dimensional class-imbalanced microarray data. In: 2012 11th international conference on machine learning and applications, vol 2. IEEE, pp 89–94
- 53.Goodfellow I, Bengio Y, Courville A. Deep learning. Cambridge: MIT Press; 2015. [Google Scholar]
- 54.Müller AC, Guido S. Introduction to machine learning with python. California: O'Reilly Media Inc; 2016. [Google Scholar]
- 55.Belavagi MC, Muniyal B. Performance evaluation of supervised machine learning algorithms for intrusion detection. Procedia Comput Sci. 2016;89:117–123. doi: 10.1016/j.procs.2016.06.016. [DOI] [Google Scholar]
- 56.Blagus R, Lusa L. Gradient boosting for high-dimensional prediction of rare events. Comput Stat Data Anal. 2017;113:19–37. doi: 10.1016/j.csda.2016.07.016. [DOI] [Google Scholar]
- 57.Xiao G, Cheng Q, Zhang C. Detecting travel modes using rule-based classification system and gaussian process classifier. IEEE Access. 2019;7:116741–116752. doi: 10.1109/ACCESS.2019.2936443. [DOI] [Google Scholar]
- 58.Rodriguez-Galia F, Ghimire B, Rogan J, et al. An assessment of the effectiveness of a random forest classifier for land-cover classification. J Photogramm Remote Sens. 2012;67:93–104. doi: 10.1016/j.isprsjprs.2011.11.002. [DOI] [Google Scholar]
- 59.Pal M. Random forest classifier for remote sensing classification. Int J Remote Sens. 2005;26:217–222. doi: 10.1080/01431160412331269698. [DOI] [Google Scholar]
- 60.Huang Q, Mao J, Liu Y (2012) An improved grid search algorithm of SVR parameters optimization. In: 2012 IEEE 14th international conference on communication technology. IEEE, pp 1022–1026


