

Abstract
Objective:
To investigate national trends and patterns in opioid prescription within office-based medical practice.
Method:
An analysis is presented of 1995–2010 data from the National Ambulatory Medical Care Survey, focusing on overall and stratified trends in the percentage of medical visits involving prescriptions for Schedule II opioids. Among visits with opioid prescriptions in 2003–2010, first-time visits were also compared to return visits, and visits in which pain was the primary complaint were compared to visits with other primary complaints.
Results:
Among all office visits, the percentage with an opioid prescription increased from 0.65% in 1995–1998 to 2.63% in 2007–2010 (odds ratio [OR] = 8.01; 95% CI, 4.96–12.94). During the study period (1995–2010), opioid prescriptions significantly increased in visits by male patients (OR = 6.54; 95% CI, 3.21–13.31); female patients (OR = 9.38; 95% CI, 6.70–13.14); and patients aged 18–35 years (OR = 5.82; 95% CI, 2.59–13.10), 36–64 years (OR = 8.30; 95% CI, 4.63–14.86), and ≥ 65 years (OR = 8.85; 95% CI, 6.13–12.77), but not ≤ 17 years (OR = 1.52; 95% CI, 0.50–4.63). Prescriptions for opioids also significantly increased in visits by patients with clinical depression (OR = 9.96; 95% CI, 5.45–18.21) or anxiety (OR = 10.99; 95% CI, 5.02–24.06) diagnoses. However, a significant decline occurred in opioid prescriptions in visits among patients with substance use diagnoses (OR = 0.10; 95% CI, 0.00–3.30). The number of opioid prescriptions rose faster among patients making a first visit (OR = 23.36; 95% CI, 11.82–46.17) versus a return visit (OR = 7.26; 95% CI, 4.38–12.03).
Conclusions:
A substantial increase occurred between 1995 and 2010 in opioid prescriptions in office-based medical visits, especially in visits by middle-aged and older adults and by patients making their first visit to the treating physician. These trends suggest that physicians have pursued greater pain control despite potential risks of nonmedical use of prescription opioids.
Prescription opioids deliver prompt and often effective relief from acute and chronic pain.1 Although most people who are prescribed opioids use them appropriately, there has been an increase in health problems related to opioid misuse. Admissions for prescription opioid use disorders increased over 5-fold between 2000 and 2010,2 and emergency visits involving opioid use more than doubled between 2004 and 2010.3 Unintentional opioid-related fatal overdoses approximately tripled between 1999 and 2007.4 In response, the federal government has sought to reduce prescription drug abuse through physician training in opioid prescribing, public education, drug prescription monitoring, and proper drug disposal.5,6
Nonmedical use of prescription opioids is common in the United States. In 2011, 1.7% of people ≥ 12 years of age reported past-month nonmedical use of prescription opioids.7 Among young adults, 9.8% reported past-year nonmedical opioid use.7 In addition to young adults, individuals with mood, anxiety, and substance use disorders are at increased risk of nonmedical use of prescription opioids.8–12 Although most individuals with nonmedical use of prescription opioids subsequently discontinue them, such use nevertheless increases the risk of substance use disorders.13
There has been a marked increase in the prescription of opioids. The total number of opioid prescriptions dispensed from US pharmacies increased from 174.1 million to 256.9 million between 2000 and 2009.14 Although the extent to which increased opioid prescription contributes to opioid-related health problems remains a matter of debate,15,16 most prescription opioids used for nonmedical purposes are obtained either directly or indirectly from physicians.7 In a large prospective study17 of adults receiving opioid therapy to treat pain, the risk of overdose death was directly related to the maximum prescribed daily dose.
In evaluating the public health importance of the increase in prescription opioid use, a key initial step is to characterize trends in the prescription of opioids. It is important to know which patient groups have experienced rapid increases in opioid use and whether the increase has extended to high-risk groups such as those with known substance use disorders. We examined nationally representative data from surveys of office-based medical visits conducted between 1995 and 2010, focusing on the proportion of visits by various subgroups that included Schedule II opioid prescriptions. According to the US Drug Enforcement Administration, Schedule II drugs have a high potential for abuse.18 Prior to performing these analyses, we expected that, consistent with overall prescribing patterns,13 there would be significant growth in the proportion of office-based visits involving opioid prescriptions.
METHOD
Data were drawn from the National Ambulatory Medical Care Survey (NAMCS).19 The NAMCS samples a nationally representative group of visits to physicians in office-based practice. Data from contiguous survey years were combined to derive more stable estimates (1995–1998, 1999–2002, 2003–2006, and 2007–2010) (total number of visits = 446,542). Survey response rates varied from 58.3% in 2010 to 72.8% in 1995 (mean response rate = 65.7%). For each visit, the treating physician or member of the physician’s staff provided information about patient characteristics and medications prescribed or supplied.
Schedule II Opioids
The dependent variable was prescription of a Schedule II opioid—oxycodone, fentanyl, remifentanil, sufentanil, hydromorphone, hydrocodone, meperidine, morphine, opium, methadone, diphenoxylate, alphaprodine, glutethimide, or oxymorphone—during a medical visit. To distinguish Schedule II opioids from preparations containing these opioids but with less potential for abuse, morphine and diphenoxylate were included only if the visit did not include atropine; opium was included only if the visit did not include pectin, kaolin, or bismuth; and hydrocodone was included only if the visit did not include atropine, carbinoxamine, pseudoephedrine, phenylpropanolamine, phenylephrine, guaifenesin, chlorpheniramine, acetaminophen, aspirin, guaiacolsulfonate, ibuprofen, pyrilamine, or glycerin.
Patient Demographic Characteristics
Visits were classified by patient sex, age in years at the time of the visit (≤ 17, 18–35, 36–64, ≥65), and race/ethnicity (white non-Hispanic, black non-Hispanic, and Hispanic).
Primary Source of Payment
Visits were grouped hierarchically into mutually exclusive payment categories in descending order: (1) private insurance, (2) Medicare, (3) Medicaid and other government insurance, and (4) a residual category (self-pay/other).
Pain
Codes for the reason for the visit were used to classify visits as involving any complaint related to pain. The locations of pain were categorized as head and neck, chest, abdominal/pelvic, back, extremities, and unspecified sites.
Medical and Mental Disorders
Diagnoses were made by treating physicians according to the ICD-9-CM. Visits were first grouped by selected diagnoses, including cancer (140–239, 338.3), low back pain (722.10, 722.52, 724.2–724.6, 738.4, 756.11, 839.2, 846.0, 847.2), depressive disorder (296.2, 296.3, 300.4, 311), anxiety disorders (293.84, 300.0, 300.2–300.3, 308.3, 309.21, 309.81, 313.0), and substance use disorders (291–292, 303–305) or a substance use–related reason for the visit.20 Each visit included up to 3 diagnoses.
Other Clinical Characteristics
Visit status was defined as first or returning visit according to whether the treating physician or anyone in the practice had seen the patient before. The specialty of the treating physician was considered as primary care (internal medicine, geriatric medicine, adolescent medicine, pediatrics, family practice, and general practice) or other medical specialty. In the analyses of visits that included opioid prescriptions in 2003–2010, psychiatrists were considered as a separate specialty.
Analytic Strategy
The proportions of office-based visits that included opioids were determined overall and stratified by visit characteristics for each time period (1995–1998, 1999–2002, 2003–2006, 2007–2010). Logistic regression models were used to assess time trends in the probability that visits included opioid prescriptions. A study year period variable was defined to assess the strength of the association of opioid prescriptions across the entire study period from 1995 to 2010. The study period variable was constructed by assigning a value of 0 to 1995, 1/15 to 1996, 2/15 to 1997, and so forth, with 2010 assigned a value of 15/15 or 1. The odds ratio (OR) associated with this variable indicates change over the study year period. For example, an OR of 2.0 denotes twice the odds of an opioid prescription in 2010 as compared with 1995. Separate regressions were constructed for each level of visit characteristic. An interaction term was added to each regression to assess whether trends in visits that included opioid prescriptions significantly differed across groups.
Separate analyses were performed to compare visits including opioid prescriptions for first-time and returning patients in 2003–2010. We also compared visits including opioids with and without pain as the primary reason for the visit. These comparisons sought to identify the distinguishing characteristics of opioid-treated patients whose presenting complaints were not clearly linked to the primary clinical indication for opioids and whose visit may therefore be more likely to include discretionary opioid treatment. Differences in proportions were evaluated with χ2 tests.
Analyses were adjusted for visit weights, clustering, and stratification of data using design elements. When adjusted for these elements, survey data represent annual visits to US office-based physicians.19 Analyses were conducted using SUDAAN software (RTI International, Research Triangle Park, North Carolina); all analyses were 2-sided (α = .05).
RESULTS
Trends in Opioid Use
Medical office visits that included opioid prescriptions increased from 0.65% in 1995–1998 to 2.63% in 2007–2010. On an annual basis, this finding translates into an increase from approximately 4.95 million visits in 1995–1998 to 26.25 million visits in 2007–2010 (Figure 1).
Figure 1.
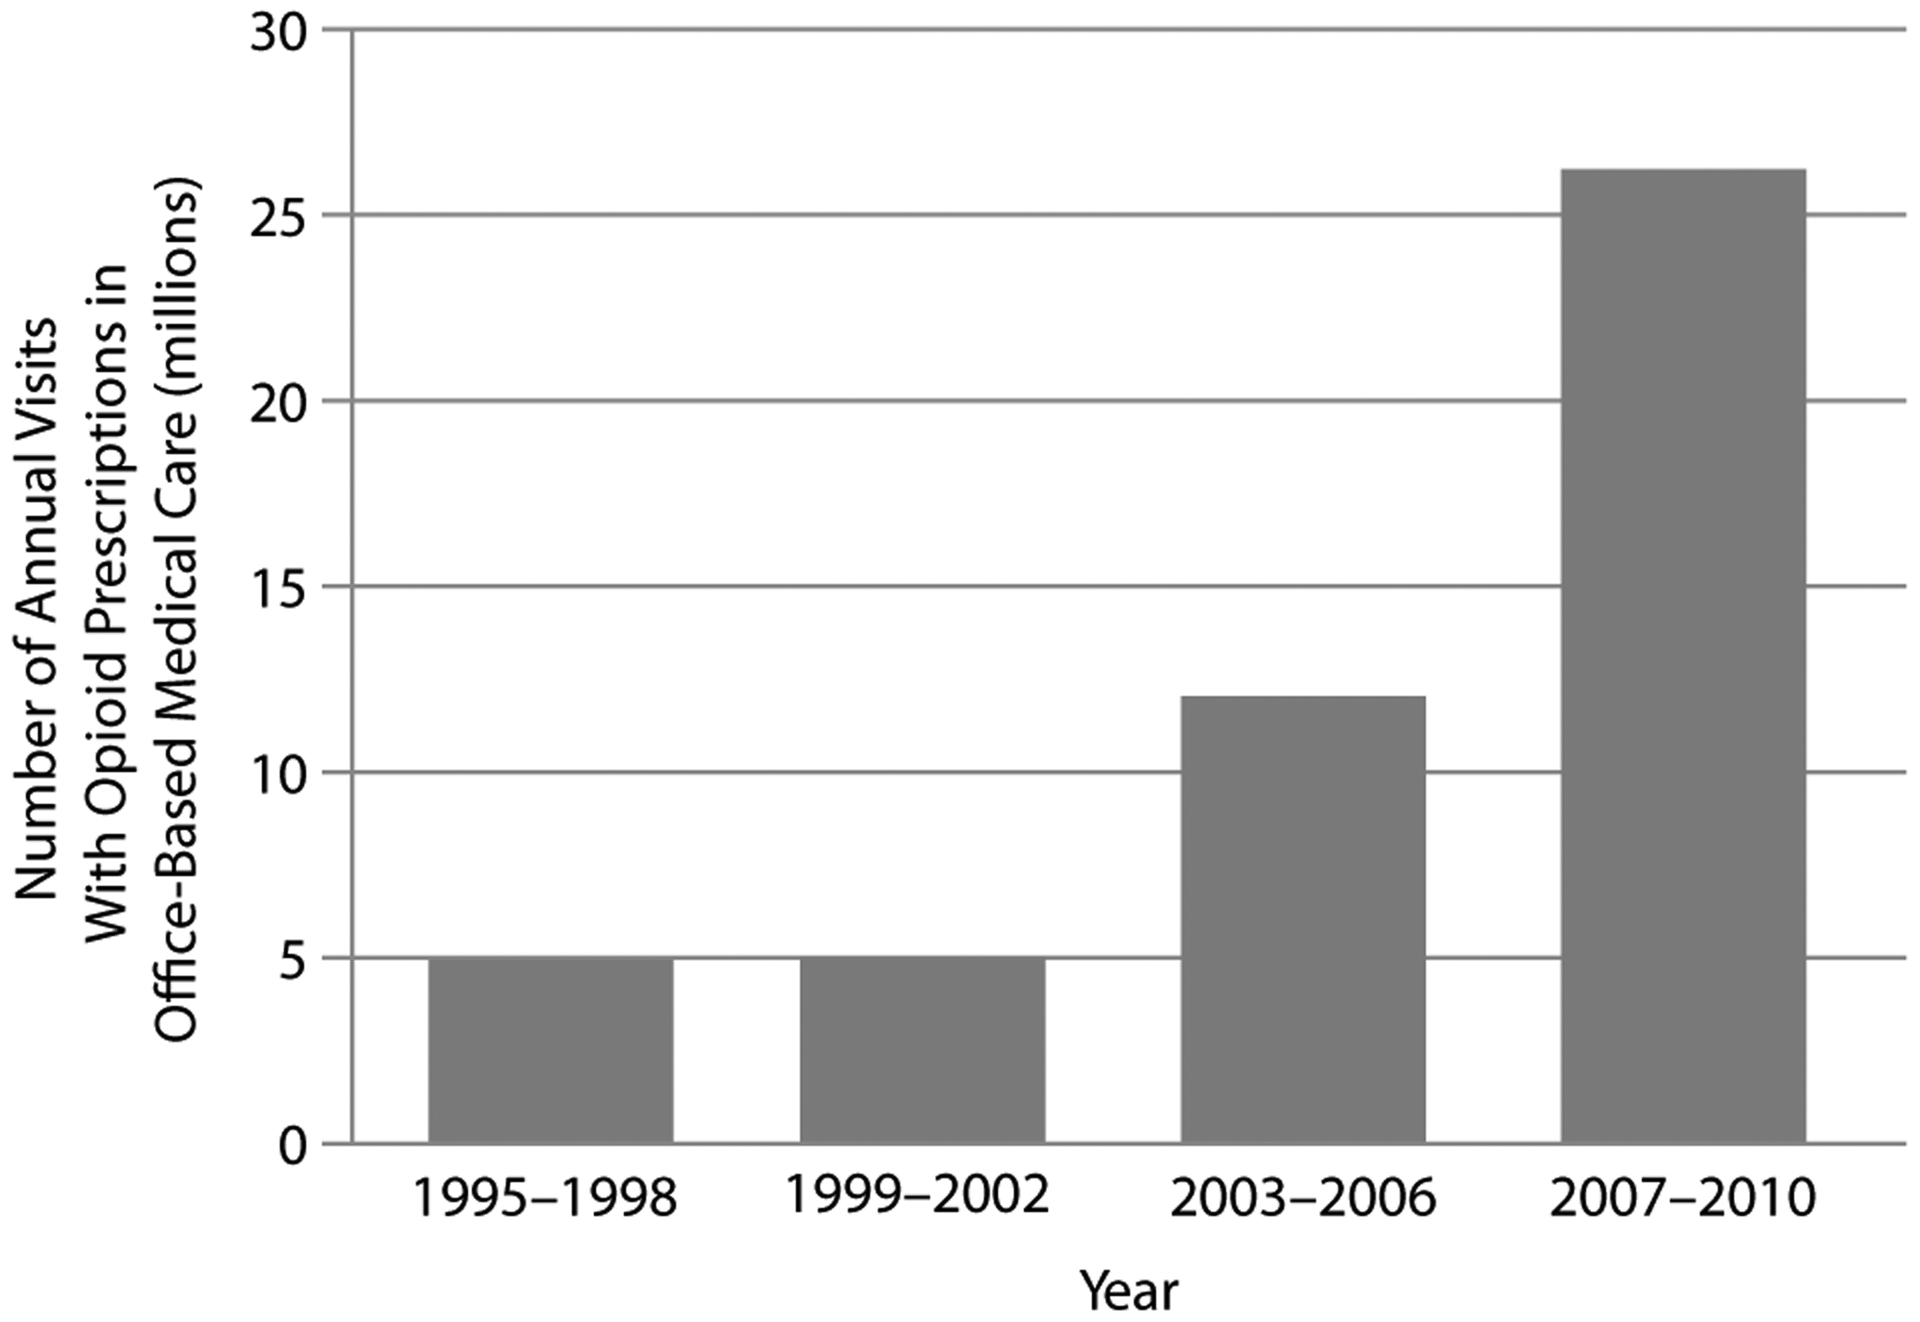
National Estimates of Annual Number of Visits With Opioid Prescriptions in Office-Based Medical Care in 1995–2010 in the United States
Growth in visits with opioid prescriptions was faster in the 2 older age groups than in the young adult group (18–35 years of age); the rate of visits with opioids did not significantly increase in visits by children and adolescents (≤ 17 years of age). In 2007–2010, the highest rate of visits with opioid use was among patients aged 36–64 years. Growth in opioid use also occurred significantly faster in visits by patients who were white versus Hispanic, as indicated by the significant Hispanic × time interaction (Table 1).
Table 1.
Trends in Medical Visits With Prescription of a Schedule II Opioid, Stratified by Demographic and Practice Characteristics, in the United States in 1995–2010a
| Characteristicb | 1995–1998, % | 1999–2002, % | 2003–2006, % | 2007–2010, % | OR (95% CI)c | Interaction Pd |
|---|---|---|---|---|---|---|
| Total (n1 = 114,979; n2 = 101,120; n3 = 105,887; n4 = 124,556) | 0.65 | 0.60 | 1.31 | 2.63 | 8.01 (4.96–12.94) | |
| Sex | ||||||
| Male (n1 = 47,987; n2 = 43,623; n3 = 45,325; n4 = 52,958) | 0.80 | 0.61 | 1.45 | 2.65 | 6.54 (3.21–13.31) | .16 |
| Female (n1 = 66,992; n2 = 57,497; n3 = 60,562; n4 = 71,598) | 0.55 | 0.60 | 1.21 | 2.62 | 9.38 (6.70–13.14) | |
| Age, y | ||||||
| ≤ 17 (n1 = 19,836; n2 = 17,179; n3 = 17,930; n4 = 21,384) | 0.10 | 0.07 | 0.06 | 0.14 | 1.52 (0.50–4.63) | .06 |
| 18–35 (n1 = 21,079; n2 = 16,057; n3 = 16,245; n4 = 19,512) | 0.59 | 0.52 | 1.19 | 2.12 | 5.82 (2.59–13.10) | < .0001 |
| 36–64 (n1 = 43,915; n2 = 40,536; n3 = 43,341; n4 = 50,778) | 1.06 | 0.85 | 1.99 | 4.08 | 8.30 (4.63–14.86) | |
| 65+ (n1 = 30,149; n2 = 27,348; n3 = 28,371; n4 = 32,882) | 0.55 | 0.69 | 1.26 | 2.51 | 8.85 (6.13–12.77) | < .0001 |
| Race/ethnicity | ||||||
| White (n1 = 96,210; n2 = 85,700; n3 = 85,137; n4 = 94,643) | 0.63 | 0.64 | 1.40 | 2.84 | 8.93 (5.86–13.60) | |
| Black (n1 = 10,224; n2 = 8,357; n3 = 9,540; n4 = 13,644) | 0.71 | 0.55 | 1.07 | 2.52 | 7.43 (3.28–16.83) | .60 |
| Hispanic (n1 = 8,545; n2 = 7,063; n3 = 11,210; n4 = 16,269) | 0.78 | 0.29 | 0.86 | 1.44 | 3.27 (0.92–11.59) | .04 |
| Primary payment source | ||||||
| Private insurance (n1 = 59,576; n2 = 58,644; n3 = 60,381; n4 = 74,236) | 0.47 | 0.49 | 1.11 | 2.23 | 10.14 (7.28–14.13) | |
| Medicare (n1 = 19,831; n2 = 21,983; n3 = 20,808; n4 = 18,159) | 0.62 | 0.78 | 1.69 | 3.96 | 14.63 (9.69–22.10) | .12 |
| Medicaid (n1 = 8,256; n2 = 6,831; n3 = 10,609; n4 = 15,490) | 0.98 | 0.80 | 1.72 | 2.27 | 3.51 (1.67–7.37) | .004 |
| Self-pay/other (n1 = 27,316; n2 = 12,513; n3 = 11,925; n4 = 16,022) | 1.00 | 0.79 | 1.40 | 3.73 | 5.31 (1.57–17.95) | .28 |
| Patient status | ||||||
| First visit (n1 = 18,405; n2 = 15,242; n3 = 15,219; n4 = 19,343) | 0.29 | 0.24 | 0.93 | 2.38 | 23.36 (11.82–46.17) | .004 |
| Return visit (n1 = 96,081; n2 = 84,157; n3 = 90,668; n4 = 105,213) | 0.70 | 0.66 | 1.36 | 2.67 | 7.26 (4.38–12.03) |
National Ambulatory Medical Care Survey data. Results are presented as weighted percentages.
For each variable, n1 refers to number of surveyed visits in 1995–1998, n2 refers to number of surveyed visits in 1999–2002, n3 refers to number of surveyed visits in 2003–2006, and n4 refers to number of surveyed visits in 2007–2010.
OR denotes odds ratio associated with the transformed survey year variable: [survey year − 1995]/15.
Interaction P values refer to probabilities associated with characteristic group × year interactions. Within a given characteristic, dichotomous variables were defined by row groups with and without P values.
The percentage of first visits to the treating physician that included an opioid prescription increased significantly faster than the corresponding percentage of return visits, as reflected by the patient status × time interaction. Visits including opioids also increased significantly faster among patients with private insurance versus Medicaid, although these groups had similar rates of opioid prescriptions in 2007–2010 (see Table 1).
Patient visits with pain as the primary reason for the visit were more likely than those without such complaints to receive opioids, although the rate of growth in opioid prescriptions did not significantly differ between these 2 groups. During the study period, pain in the extremities and in unspecified sites was associated with particularly rapid increases in receiving an opioid, while back pain was associated with the highest rate of opioid use. In 2007–2010, 20.7% of visits that included an opioid prescription and a back pain diagnosis were for a new problem of less than 3 months’ duration. Significant increases also occurred in the proportion of visits that involved diagnoses of depression and anxiety and included opioid prescriptions (Table 2).
Table 2.
Trends in Medical Visits With Prescription of a Schedule II Opioid, Stratified by Clinical Characteristics, in the United States in 1995–2010a
| Characteristicb | 1995–1998, % | 1999–2002, % | 2003–2006, % | 2007–2010, % | OR (95% CI)c | Interaction Pd |
|---|---|---|---|---|---|---|
| Pain as first reason for visit | ||||||
| Yes (n1 = 25,089; n2 = 20,335; n3 = 19,922; n4 = 22,689) | 0.98 | 1.12 | 2.70 | 5.50 | 11.61 (8.51–15.84) | .16 |
| No (n1 = 89,890; n2 = 80,785; n3 = 85,965; n4 = 101,867) | 0.56 | 0.48 | 0.97 | 1.96 | 6.74 (3.30–13.75) | |
| Type of pain | ||||||
| Head/neck (n1 = 8,933; n2 = 7,497; n3 = 7,804; n4 = 8,981) | 0.77 | 1.11 | 1.97 | 2.91 | 5.85 (3.30–10.36) | .34 |
| Chest (n1 = 2,217; n2 = 1,640; n3 = 1,633; n4 = 1,952) | 0.78 | 0.64 | 2.13 | 2.47 | 5.45 (2.64–11.26) | .37 |
| Abdominal/pelvic (n1 = 3,944; n2 = 3,263; n3 = 3,225; n4 = 3,921) | 1.02 | 1.03 | 2.17 | 3.70 | 7.12 (4.06–12.49) | .74 |
| Back (n1 = 4,241; n2 = 3,430; n3 = 3,497; n4 = 4,405) | 1.89 | 2.92 | 6.23 | 13.19 | 13.23 (8.38–20.89) | .09 |
| Extremities (n1 = 7,381; n2 = 6,003; n3 = 5,698; n4 = 6,783) | 0.69 | 0.73 | 2.41 | 5.37 | 19.08 (11.96–30.42) | .004 |
| Unspecified (n1 = 7,956; n2 = 6,990; n3 = 6,823; n4 = 7,679) | 0.83 | 1.12 | 2.12 | 6.33 | 18.70 (11.53–30.33) | .007 |
| Disposition | ||||||
| No follow-up (n1 = 4,712; n2 = 7,568; n3 = 6,551; n4 = 3,066) | 0.41 | 0.49 | 0.70 | 1.85 | 7.14 (1.58–32.30) | .77 |
| Other (n1 = 62,213; n2 = 93,552; n3 = 99,336; n4 = 57,980) | 0.80 | 0.61 | 1.35 | 2.59 | 9.14 (3.51–23.82) | |
| Physician specialty | ||||||
| Primary care (n1 = 40,933; n2 = 33,262; n3 = 37,318; n4 = 51,229) | 0.47 | 0.61 | 1.46 | 2.51 | 9.27 (7.03–12.23) | .54 |
| Other (n1 = 74,046; n2 = 67,858; n3 = 68,569; n4 = 73,327) | 0.85 | 0.60 | 1.15 | 2.75 | 6.92 (2.82–16.96) | |
| Selected medical or mental health problem | ||||||
| Low back pain (n1 = 2,228; n2 = 2,034; n3 = 2,334; n4 = 3,275) | 2.40 | 3.16 | 8.06 | 14.73 | 13.90 (8.36–23.11) | .07 |
| Cancer (n1 = 5,868; n2 = 5,263; n3 = 6,053; n4 = 7,612) | 1.53 | 1.89 | 2.20 | 4.08 | 3.94 (2.06–7.55) | .05 |
| Substance use (n1 = 981; n2 = 657; n3 = 854; n4 = 1,377) | 20.29 | 1.05 | 4.00 | 5.89 | 0.10 (0.00–3.30) | .009 |
| Depression (n1 = 4,430; n2 = 4,067; n3 = 4,333; n4 = 4,183) | 0.43 | 0.81 | 2.43 | 3.33 | 9.96 (5.45–18.21) | .57 |
| Anxiety (n1 = 1,937; n2 = 1,994; n3 = 2,553; n4 = 2,804) | 0.08 | 0.71 | 1.90 | 2.27 | 10.99 (5.02–24.06) | .49 |
National Ambulatory Medical Care Survey data. Results are presented as weighted percentages.
For each variable, n1 refers to number of surveyed visits in 1995–1998, n2 refers to number of surveyed visits in 1999–2002, n3 refers to number of surveyed visits in 2003–2006, and n4 refers to number of surveyed visits in 2007–2010.
OR denotes odds ratio associated with the transformed survey year variable: [survey year − 1995]/15.
Interaction P values refer to probabilities associated with characteristic group × year interactions. Within a given characteristic, dichotomous variables were defined by row groups with and without P values.
Visits involving a substance use disorder were a notable exception to the increasing use of opioids. Patient visits that involved substance use disorders became significantly less likely to include an opioid prescription. Use of opioids among visits that included a cancer diagnosis increased during the study period, but the increase tended (P = .05) to be slower than the corresponding increase among visits without a cancer diagnosis (see Table 2).
First-Visit Patients Versus Returning Patients
As compared with returning patients who received opioid prescriptions, first-visit patients who received opioids tended to be younger and were much less likely to have been treated by a primary care physician. First-visit patients with opioid prescriptions were also significantly less likely to be diagnosed with back pain, depression, or anxiety than were return-visit patients with opioid prescriptions (Table 3).
Table 3.
Demographic and Clinical Characteristics for Office-Based Physician Visits That Included Prescription of a Schedule II Opioid Shown by Visit Status in the United States in 2003–2010a
| Characteristic | First-Visit Patients (no. visits = 576), % | Return-Visit Patients (no. visits = 4,249), % | χ2 Statistic | P Value |
|---|---|---|---|---|
| Age, y | 4.17 | .006 | ||
| ≤ 17 | 1.70 | 0.87 | ||
| 18–35 | 21.85 | 11.87 | ||
| 36–64 | 58.16 | 61.54 | ||
| 65+ | 18.29 | 25.72 | ||
| Sex | 2.71 | .10 | ||
| Male | 47.90 | 42.08 | ||
| Female | 52.10 | 57.92 | ||
| Race/ethnicity | 2.61 | .07 | ||
| White, non-Hispanicb | 79.26 | 84.34 | ||
| Black, non-Hispanic | 10.82 | 9.19 | ||
| Hispanic | 9.92 | 6.46 | ||
| Primary source of payment | 3.06 | .03 | ||
| Private insurance | 56.79 | 53.08 | ||
| Medicare | 15.04 | 23.58 | ||
| Medicaid | 11.75 | 10.44 | ||
| Self-pay/other | 16.41 | 12.91 | ||
| Primary complaint | 0.59 | .44 | ||
| Pain | 36.38 | 40.23 | ||
| Other | 63.62 | 59.77 | ||
| Selected diagnosis/problem | ||||
| Low back pain | 10.41 | 16.13 | 4.44 | .04 |
| Cancer | 5.68 | 7.56 | 1.14 | .29 |
| Substance use | 1.41 | 1.87 | 0.55 | .46 |
| Depression | 0.64 | 4.69 | 21.96 | < .0001 |
| Anxiety | 0.65 | 2.14 | 7.66 | .006 |
| Physician specialty | 10.67 | < .0001 | ||
| Primary care | 25.37 | 54.14 | ||
| Psychiatry | 0.72 | 1.73 | ||
| Other | 73.91 | 44.13 | ||
| Opioid prescribed | ||||
| Oxycodone | 41.39 | 52.24 | 3.44 | .06 |
| Fentanyl | 8.40 | 11.24 | 1.67 | .20 |
| Hydromorphone | 2.95 | 4.34 | 1.17 | .28 |
| Hydrocodone | 21.03 | 14.78 | 3.48 | .06 |
| Meperidine | 12.91 | 4.52 | 0.93 | .33 |
| Otherc | 16.75 | 20.90 | 1.98 | .16 |
National Ambulatory Medical Care Survey data. Results are presented as weighted percentages.
Includes white, Asian, Native Hawaiian or Other Pacific Islander, and American Indian or Alaska Native.
Other includes oxymorphone, morphine, opium, methadone, levorphanol, diphenoxylate, alphaprodine, cocaine, and glutethimide.
Opioid Use in Visits and Complaints of Pain
In relation to visits that involved opioids and non–pain-related complaints, visits that included opioids for pain complaints were more likely to be made by younger patients and by patients without private insurance, Medicare, or Medicaid. Cancer, substance use disorders, and depression were significantly less common when pain was the primary reason for the visit (Table 4). In post hoc analyses over the entire study period (1995–2010), psychiatrists prescribed opioids in 5.7% and nonpsychiatrists in 6.7% of visits by patients with a pain complaint and a depression diagnosis (P = .65). Psychiatrists prescribed opioids in 3.0% and nonpsychiatrists in 4.0% of visits by patients with a pain complaint and an anxiety disorder diagnosis (P = .50).
Table 4.
Demographic and Clinical Characteristics for Office-Based Physician Visits That Included Prescription of a Schedule II Opioid for Patients With and Without Pain as the Primary Reason for the Visit in the United States in 2003–2010a
| Characteristic | With Pain as Primary Reason for Visit (no. visits = 1,879), % | Without Pain as Primary Reason for Visit (no. visits = 2,946), % | χ2 Statistic | P Value |
|---|---|---|---|---|
| Age, y | 8.03 | < .0001 | ||
| ≤ 17 | 0.65 | 1.16 | ||
| 18–35 | 15.19 | 11.52 | ||
| 36–64 | 65.37 | 58.39 | ||
| 65+ | 18.79 | 28.93 | ||
| Sex | 0.01 | .93 | ||
| Male | 42.85 | 42.65 | ||
| Female | 57.15 | 57.35 | ||
| Race/ethnicity | 2.33 | .10 | ||
| White, non-Hispanicb | 85.82 | 82.43 | ||
| Black, non-Hispanic | 8.47 | 9.97 | ||
| Hispanic | 5.70 | 7.60 | ||
| Primary source of payment | 5.43 | .001 | ||
| Private insurance | 53.67 | 53.37 | ||
| Medicare | 18.71 | 25.22 | ||
| Medicaid | 9.42 | 11.36 | ||
| Self-pay/other | 18.21 | 10.05 | ||
| Visit status | 0.59 | .44 | ||
| New patient | 10.14 | 11.72 | ||
| Returning patient | 89.86 | 88.28 | ||
| Selected diagnosis/problem | ||||
| Low back pain | 23.57 | 10.16 | 37.74 | < .0001 |
| Cancer | 2.83 | 10.34 | 30.12 | < .0001 |
| Substance use | 0.79 | 2.50 | 7.27 | .007 |
| Depression | 3.23 | 4.91 | 3.92 | .048 |
| Anxiety | 1.43 | 2.33 | 3.49 | .06 |
| Physician specialty | 1.47 | .23 | ||
| Primary care | 52.37 | 49.98 | ||
| Psychiatry | 0.99 | 2.03 | ||
| Other | 46.64 | 47.99 | ||
| Opioid prescribed | ||||
| Oxycodone | 57.11 | 47.01 | 11.52 | .0007 |
| Fentanyl | 8.95 | 12.23 | 3.94 | .047 |
| Hydromorphone | 4.95 | 3.67 | 2.35 | .13 |
| Hydrocodone | 14.06 | 16.41 | 2.27 | .13 |
| Meperidine | 4.50 | 6.08 | 0.51 | .47 |
| Otherc | 19.03 | 21.37 | 1.08 | .30 |
National Ambulatory Medical Care Survey data. Results are presented as weighted percentages.
Includes white, Asian, Native Hawaiian or Other Pacific Islander, and American Indian or Alaska Native.
Other includes oxymorphone, morphine, opium, methadone, levorphanol, diphenoxylate, alphaprodine, cocaine, and glutethimide.
DISCUSSION
Over the last several years, there has been a substantial increase in prescription of Schedule II opioids in office-based practice. The increase was particularly rapid among adults aged ≥ 36 years and among patients making their first visit to a physician. Young adults, who as a group are at increased risk of nonmedical use and abuse of prescription opioids,8,10 experienced more modest growth in opioid prescriptions; children and adolescents had no significant increase; and patients with substance use disorders,9,12 who are at especially high risk of opioid misuse, became less likely to receive opioid prescriptions.
Several factors may have contributed to the recent increase in opioid treatment. Widespread clinical concern over undertreatment of pain21 and the publication of clinical guidelines encouraging physicians to adequately manage pain22,23 may have played a role in the increase. In addition, the US Food and Drug Administration approved new oral formulations of fentanyl (1993), oxycodone (1995), and hydromorphone (1998). These and other prescription opioids were heavily promoted to physicians by pharmaceutical companies.24,25 Safety concerns related to some cyclooxygenase inhibitors26 may have further increased clinical reliance on opioids. Real-time prescription monitoring programs27 and the availability of abuse-resistant opioid formulations might have bolstered the willingness of some physicians to prescribe opioids.28 Abuse-resistant opioids, such as extended-release oxymorphone and the osmotic extended-release oral delivery system of hydromorphone, have crush-resistant properties that reduce the likelihood that the opioids can be misused through injection or snorting.
Visits by older patients had the fastest growth in opioid prescriptions, and visits by adults aged 36–64 years were the most likely to include an opioid. Although nonmedical use of prescription opioids in the general population is heavily concentrated among adolescents and young adults,8,10,29 older adults are at the greatest risk of nonmedical use of opioids prescribed directly from their physician.30 Older patients may have more opportunities to receive prescription opioids than younger patients because they make more physician visits31 and more often experience somatic pain.32 In addition to an ongoing emphasis on detection and treatment of problematic opioid use among young people,33,34 a balanced approach requires careful consideration of the risks of nonmedical opioid use by older patients as well, particularly in the context of recent increases in the number of fatal poisonings among older Americans that involved opioid analgesics.35
In contrast to visits by non-Hispanic patients, there was no significant increase in opioid prescriptions during visits by Hispanic patients. In several health settings, Hispanics are less likely than non-Hispanic whites to receive analgesics to manage pain.36 This disparity, which has also been reported for African Americans in relation to whites,37 may reflect ethnic/racial group differences in pain perception38 or a greater reluctance to prescribe opioids to minority patients borne of a stereotype that opioid abuse is more common among racial and ethnic minority patients,39 despite empirical evidence to the contrary.12
Individuals with substance use disorders are well known to be at high risk for prescription opioid misuse,9 abuse, and dependence.11,12 Unlike visits by patients without substance use disorders, which became more likely to include opioid prescriptions during the study period, visits by patients with substance use disorders became less likely to involve opioid prescriptions. There may have been an increase in physician awareness of the risks of opioid abuse in this patient population.40
Adults with anxiety and depressive disorders are also at elevated risk of nonmedical use of prescription opioids.8,10 Longitudinal epidemiologic data support complex bidirectional associations with generalized anxiety disorder and depression related to incident nonmedical prescription opioid use as well as nonmedical use of prescription opioids related to the onset of depression and various anxiety disorders.8,41 Because of the vulnerability to opioid use among patients diagnosed with anxiety or depression disorders, the growth in opioid prescription to these patients may merit particular clinical scrutiny. This concern may be especially true in relation to depressed patients because, in this study, opioid prescriptions tended to be written in visits in which pain was not the primary reason for the visit.
There was also a marked increase in opioid prescriptions in visits involving low back pain. Although prescription opioids may be effective for short-term relief of low back pain, their efficacy in long-term back-pain management is less clear.42 Because nonmedical use of prescription opioids is common among patients with long-term back pain42,43 and most of the opioid prescriptions related to back pain are for long-term problems, clinical care should be exercised in the selection of medications to manage pain in this complicated condition.
Opioid prescriptions increased significantly faster among first visits than return visits. The rapid rise in opioid prescriptions during first visits may represent an appropriate response to historical delays and barriers to pain care,44 shorter opioid treatment episodes with proportionately more first visits, or an overly rapid escalation in pharmacologic pain management. Detailed longitudinal practice-based research could help determine the extent to which community physicians employ an orderly sequence of nonopioid analgesic medications followed by weak opioids if the pain is not properly controlled before considering strong opioids.45
First visits compared with return visits with opioid prescriptions included a significantly greater proportion of younger patients, a demographic group associated with nonmedical use of, abuse of, and dependence on prescription opioids.12 In some first patient visits, physicians may be caught between responding to patient treatment preferences while honoring principles of responsible pain management.46 As compared to return visits with opioid prescriptions, however, first visits with opioid prescriptions did not include a greater proportion of patients with substance use disorders, as would be expected if this group had higher abuse liability.12
A significant increase in opioid treatment extended to visits in which pain was not the primary reason for the visit. These visits involved patients who tended to be older than the opioid-treated patients who had pain as their primary complaint. Because physicians are often the direct source of opioids for older patients with nonmedical opioid use,30 it may be particularly important to regularly reassess the clinical need for opioids in this patient population.
The analyses have several limitations. First, physician nonresponse raises the potential for survey response bias. Second, absence of information concerning dose and duration of opioid prescriptions, use by patients who seek opioids from multiple physicians, or patients who seek early refills limits characterization of patients at high risk for opioid abuse or diversion.47 Third, the diagnoses were based on clinician judgment without expert validation by standardized diagnostic assessment, and clinical diagnostic practices may have changed over the study period. Fourth, the surveys are restricted to office-based medical visits and therefore do not capture visits to emergency departments, hospital outpatient clinics, cancer centers, and various other outpatient settings where opioids are prescribed. The surveys also do not capture most nonmedical use of prescription opioids, which is by individuals who do not obtain the drugs directly from a physician but rather from friends, relatives, drug dealers, and other nonphysician sources.7
An increase in opioid prescribing in office-based medical practice supports calls to increase physician training in the principles of responsible pain management. Greater caution regarding opioid prescription has been urged by prominent pain management specialists, addiction researchers, and public health officials.48,49 The most impressive growth in opioid prescribing occurred not among patient groups that conform to clinical stereotypes of opioid misuse, such as adolescents, young adults, and patients with substance use disorders, but rather among older adults and patients with pain in their extremities or with poorly localized pain. In order to ensure safe pain management, physicians should remain vigilant for clinical indications of problematic opioid use in all of their opioid-treated patients, routinely counsel these patients concerning the risks of abuse and overdose, and emphasize the importance of proper disposal of opioid pills and capsules that are no longer necessary. Although psychiatrists account for only a small proportion of prescribed opioids in office-based medical practice, they have an important role to play in the evaluation and management of patients with prescription opioid use disorders.50 Key challenges ahead involve sharpening the clinical assessment of pain control and the vulnerability to nonmedical opioid use.
Clinical Points.
Prescription of opioid analgesics is increasing in office-based medical practice.
Particularly rapid increases in opioid prescribing are occurring among older adult patients and patients making their first visit to their treating physician.
Physicians should remain vigilant for indications of opioid misuse in all of their patients who are prescribed opioids.
Funding/support:
This research was funded by the Agency for Healthcare Research and Quality (grant U18 HS021112 to Drs Crystal and Olfson), the National Institute on Drug Abuse (grants DA023200 and DA019606 to Dr Blanco), and the National Institute of Mental Health (grant MH076051 to Dr Blanco). Drs Olfson and Blanco are also supported by the New York State Psychiatric Institute.
Role of sponsors:
The sponsors had no role in the design and conduct of the study; the collection, management, analysis, and interpretation of the data; and the preparation or approval of the manuscript.
Footnotes
Drug names: atropine (Atropen and others), carbinoxamine (Karbinal ER and others), fentanyl (Duragesic, Subsys, and others), hydromorphone (Dilaudid, Exalgo, and others), ibuprofen (Caldolor, Ibu-Tab, and others), meperidine (Demerol and others), methadone (Methadose, Dolophine, and others), morphine (Kadian, Avinza, and others), oxycodone (Oxycontin, Oxecta, and others), oxymorphone (Opana, Opana ER, and others), remifentanil (Ultiva), sufentanil (Sufenta and others).
Potential conflicts of interest: None reported.
Additional information: The National Ambulatory Medical Care Survey data for 1995 through 2010 are available as public-use downloadable data files. Instructions for accessing the survey data and documentation are available at http://www.cdc.gov/nchs/ahcd/ahcd_questionnaires.htm.
REFERENCES
- 1.Walwyn WM, Miotto KA, Evans CJ. Opioid pharmaceuticals and addiction: the issues, and research directions seeking solutions. Drug Alcohol Depend. 2010;108(3):156–165. [DOI] [PMC free article] [PubMed] [Google Scholar]
- 2.Substance Abuse and Mental Health Services Administration, Center for Behavioral Health Statistics and Quality. Treatment Episode Data Set (TEDS): 2000–2010. National Admissions to Substance Abuse Treatment Services. DASIS Series S-61, HHS Publication No. (SMA) 12–4701 Rockville, MD: Substance Abuse and Mental Health Services Administration; 2012. [Google Scholar]
- 3.Drug Abuse Warning Network. The Dawn Report: Highlights of the 2010 Drug Abuse Warning Network (DAWN) findings on drug-related emergency department visits. http://www.samhsa.gov/data/2k12/DAWN096/SR096EDHighlights2010.htm. Accessed December 19, 2012.
- 4.Paulozzi L, Baldwin G, Franklin G, et al. CDC Grand Rounds: prescription drug overdoses—a US epidemic. MMRW. 2012;61:10–13. [PubMed] [Google Scholar]
- 5.Compton WM, Volkow ND. Major increases in opioid analgesic abuse in the United States: concerns and strategies. Drug Alcohol Depend. 2006;81(2): 103–107. [DOI] [PubMed] [Google Scholar]
- 6.Executive Office of the President of the United States. Epidemic: Responding to America’s Prescription Drug Abuse Crisis. 2011. http://www.whitehouse.gov/sites/default/files/ondcp/issues-content/prescription-drugs/rx_abuse_plan.pdf. Accessed December 15, 2012.
- 7.Substance Abuse and Mental Health Services Administration. Results from the 2011 National Survey on Drug Use and Health: Summary of National Findings. NSDUH Series H-44, HHS Publication No. (SMA) 12–4713 Rockville, MD: Substance Abuse and Mental Health Services Administration; 2011. [Google Scholar]
- 8.Martins SS, Keyes KM, Storr CL, et al. Pathways between nonmedical opioid use/dependence and psychiatric disorders: results from the National Epidemiologic Survey on Alcohol and Related Conditions. Drug Alcohol Depend. 2009;103(1–2):16–24. [DOI] [PMC free article] [PubMed] [Google Scholar]
- 9.Tetrault JM, Desai RA, Becker WC, et al. Gender and non-medical use of prescription opioids: results from a national US survey. Addiction. 2008; 103(2):258–268. [DOI] [PubMed] [Google Scholar]
- 10.Becker WC, Sullivan LE, Tetrault JM, et al. Non-medical use, abuse and dependence on prescription opioids among US adults: psychiatric, medical and substance use correlates. Drug Alcohol Depend. 2008;94(1–3):38–47. [DOI] [PubMed] [Google Scholar]
- 11.Blanco C, Alderson D, Ogburn E, et al. Changes in the prevalence of non-medical prescription drug use and drug use disorders in the United States: 1991–1992 and 2001–2002. Drug Alcohol Depend. 2007;90(2–3):252–260. [DOI] [PubMed] [Google Scholar]
- 12.Huang B, Dawson DA, Stinson FS, et al. Prevalence, correlates, and comorbidity of nonmedical prescription drug use and drug use disorders in the United States: results of the National Epidemiologic Survey on Alcohol and Related Conditions. J Clin Psychiatry. 2006;67(7):1062–1073. [DOI] [PubMed] [Google Scholar]
- 13.Boyd CJ, Teter CJ, West BT, et al. Non-medical use of prescription analgesics: a three-year national longitudinal study. J Addict Dis. 2009;28(3):232–242. [DOI] [PMC free article] [PubMed] [Google Scholar]
- 14.Governale L. Outpatient Prescription Opioid Utilization in the US, Years 2000–2009. July 22, 2010. http://www.fda.gov/downloads/AdvisoryCommittees/CommitteesMeetingMaterials/Drugs/AnestheticAndLifeSupportDrugsAdvisoryCommittee/UCM220950.pdf. Accessed December 14, 2012.
- 15.Fishman SM. Commentary in response to Paulozzi et al: prescription drug abuse and safe pain management. Pharmacoepidemiol Drug Saf. 2006;15(9): 628–631. [DOI] [PubMed] [Google Scholar]
- 16.Reidenberg MM, Willis O. Prosecution of physicians for prescribing opioids to patients. Clin Pharmacol Ther. 2007;81(6):903–906. [DOI] [PubMed] [Google Scholar]
- 17.Bohnert ASB, Valenstein M, Bair MJ, et al. Association between opioid prescribing patterns and opioid overdose–related deaths. JAMA. 2011; 305(13):1315–1321. [DOI] [PubMed] [Google Scholar]
- 18.United States Drug Enforcement Administration. Drug Scheduling. http://www.justice.gov/dea/druginfo/ds.shtml. Accessed December 18, 2012.
- 19.Cherry DK, Hing E, Woodwell DA, et al. National Ambulatory Medical Care Survey: 2006 summary. Natl Health Stat Report. 2008;6:1–39. [PubMed] [Google Scholar]
- 20.Pletcher MJ, Kertesz SG, Kohn MA, et al. Trends in opioid prescribing by race/ethnicity for patients seeking care in US emergency departments. JAMA. 2008;299(1):70–78. [DOI] [PubMed] [Google Scholar]
- 21.Resnik DB, Rehm M, Minard RB. The undertreatment of pain: scientific, clinical, cultural, and philosophical factors. Med Health Care Philos. 2001;4(3):277–288. [DOI] [PubMed] [Google Scholar]
- 22.Chou R, Fanciullo GJ, Fine PG, et al. ; American Pain Society–American Academy of Pain Medicine Opioids Guidelines Panel. Clinical guidelines for the use of chronic opioid therapy in chronic noncancer pain. J Pain. 2009;10(2):113–130. [DOI] [PMC free article] [PubMed] [Google Scholar]
- 23.Trescot AM, Helm S, Hansen H, et al. Opioids in the Management of Chronic Non-Cancer Pain: An Update of American Society of the Interventional Pain Physicians’ (ASIPP) Guidelines. Pain Physician. 2008;11(suppl):S5–S62. [PubMed] [Google Scholar]
- 24.Van Zee A. The promotion and marketing of oxycontin: commercial triumph, public health tragedy. Am J Public Health. 2009;99(2):221–227. [DOI] [PMC free article] [PubMed] [Google Scholar]
- 25.Perret D, Rosen C. A physician-driven solution—the Association for Medical Ethics, the Physician Payment Sunshine Act, and ethical challenges in pain medicine. Pain Med. 2011;12(9):1361–1375. [DOI] [PubMed] [Google Scholar]
- 26.Farkouh ME, Greenberg BP. An evidence-based review of the cardiovascular risks of nonsteroidal anti-inflammatory drugs. Am J Cardiol. 2009;103(9):1227–1237. [DOI] [PubMed] [Google Scholar]
- 27.Wang J, Christo PJ. The influence of prescription monitoring programs on chronic pain management. Pain Physician. 2009;12(3):507–515. [PubMed] [Google Scholar]
- 28.Bannwarth B. Will abuse-deterrent formulations of opioid analgesics be successful in achieving their purpose? Drugs. 2012;72(13):1713–1723. [DOI] [PubMed] [Google Scholar]
- 29.McCabe SE, West BT, Cranford JA, et al. Medical misuse of controlled medications among adolescents. Arch Pediatr Adolesc Med. 2011;165(8): 729–735. [DOI] [PMC free article] [PubMed] [Google Scholar]
- 30.Becker WC, Tobin DG, Fiellin DA. Nonmedical use of opioid analgesics obtained directly from physicians: prevalence and correlates. Arch Intern Med. 2011;171(11):1034–1036. [DOI] [PubMed] [Google Scholar]
- 31.Cherry D, Lucas C, Decker SL. Population Aging and the Use of Office-Based Physician Services: NCHS Data Brief, No. 41 Hyattsville, MD: National Center for Health Statistics; 2010. [PubMed] [Google Scholar]
- 32.Caudill-Slosberg MA, Schwartz LM, Woloshin S. Office visits and analgesic prescriptions for musculoskeletal pain in US: 1980 vs 2000. Pain. 2004;109(3):514–519. [DOI] [PubMed] [Google Scholar]
- 33.Wu LT, Blazer DG, Li TK, et al. Treatment use and barriers among adolescents with prescription opioid use disorders. Addict Behav. 2011;36(12):1233–1239. [DOI] [PMC free article] [PubMed] [Google Scholar]
- 34.Winters KC, Kaminer Y. Screening and assessing adolescent substance use disorders in clinical populations. J Am Acad Child Adolesc Psychiatry. 2008;47(7):740–744. [DOI] [PMC free article] [PubMed] [Google Scholar]
- 35.Warner M, Chen LH, Makuc DM. Increase in Fatal Poisonings Involving Opioid Analgesics in the United States, 1999–2006. NCHS Data Brief, No 22 Hyattsville, MD: Centers for Disease Control, National Center for Health Statistics; 2009. [PubMed] [Google Scholar]
- 36.Green CR, Anderson KO, Baker TA, et al. The unequal burden of pain: confronting racial and ethnic disparities in pain. Pain Med. 2003;4(3): 277–294. [DOI] [PubMed] [Google Scholar]
- 37.Meghani SH, Byun E, Gallagher RM. Time to take stock: a meta-analysis and systematic review of analgesic treatment disparities for pain in the United States. Pain Med. 2012;13(2):150–174. [DOI] [PubMed] [Google Scholar]
- 38.Rahim-Williams B, Riley JL 3rd, Williams AKK, et al. A quantitative review of ethnic group differences in experimental pain response: do biology, psychology, and culture matter? Pain Med. 2012;13(4):522–540. [DOI] [PMC free article] [PubMed] [Google Scholar]
- 39.Burgess DJ, van Ryn M, Crowley-Matoka M, et al. Understanding the provider contribution to race/ethnicity disparities in pain treatment: insights from dual process models of stereotyping. Pain Med. 2006;7(2):119–134. [DOI] [PubMed] [Google Scholar]
- 40.Bhamb B, Brown D, Hariharan J, et al. Survey of select practice behaviors by primary care physicians on the use of opioids for chronic pain. Curr Med Res Opin. 2006;22(9):1859–1865. [DOI] [PMC free article] [PubMed] [Google Scholar]
- 41.Martins SS, Fenton MC, Keyes KM, et al. Mood and anxiety disorders and their association with non-medical prescription opioid use and prescription opioid-use disorder: longitudinal evidence from the National Epidemiologic Study on Alcohol and Related Conditions. Psychol Med. 2012;42(6):1261–1272. [DOI] [PMC free article] [PubMed] [Google Scholar]
- 42.Martell BA, O’Connor PG, Kerns RD, et al. Systematic review: opioid treatment for chronic back pain: prevalence, efficacy, and association with addiction. Ann Intern Med. 2007;146(2):116–127. [DOI] [PubMed] [Google Scholar]
- 43.Mahowald ML, Singh JA, Majeski P. Opioid use by patients in an orthopedics spine clinic. Arthritis Rheum. 2005;52(1):312–321. [DOI] [PubMed] [Google Scholar]
- 44.Institute of Medicine. Relieving Pain in America: A Blueprint for Transforming Prevention, Care, Education, and Research. Washington, DC: The National Academies Press; 2011. [PubMed] [Google Scholar]
- 45.Vargas-Schaffer G. Is the WHO analgesic ladder still valid? twenty-four years of experience. Can Fam Physician. 2010;56(6):514–517, e202–e205. [PMC free article] [PubMed] [Google Scholar]
- 46.Zgierska A, Miller M, Rabago D. Patient satisfaction, prescription drug abuse, and potential unintended consequences. JAMA. 2012;307(13):1377–1378. [DOI] [PMC free article] [PubMed] [Google Scholar]
- 47.Hall AJ, Logan JE, Toblin RL, et al. Patterns of abuse among unintentional pharmaceutical overdose fatalities. JAMA. 2008;300(22):2613–2620. [DOI] [PubMed] [Google Scholar]
- 48.Catan T. A pain-drug champion has second thoughts. Wall Street Journal, December 17, 2012. [Google Scholar]
- 49.Volkow ND, McLellan TA. Curtailing diversion and abuse of opioid analgesics without jeopardizing pain treatment. JAMA. 2011;305(13):1346–1347. [DOI] [PubMed] [Google Scholar]
- 50.Mark TL, Kassed CA, Vandivort-Warren R, et al. Alcohol and opioid dependence medications: prescription trends, overall and by physician specialty. Drug Alcohol Depend. 2009;99(1–3):345–349. [DOI] [PMC free article] [PubMed] [Google Scholar]