

Abstract
Variations in candidate and donor acceptance criteria may influence access and mortality for liver transplantation. We sought to understand how recipient and donor characteristics vary across centers and how patients interpret this information, and we used these data to develop a tool to provide tailored information to candidates seeking a center (www.transplantcentersearch.org). We analyzed liver recipient data from the Scientific Registry of Transplant Recipients to determine how recipient and donor characteristics (eg, age, Medicaid use, and human immunodeficiency virus status) varied across programs. Data included recipients and donors at each US program between January 1, 2015, and December 31, 2017. The variation in characteristics was plotted with centers stratified by total transplant volume and by volume of each characteristic. A subset of characteristics was plotted to show variation over 3 years. We created mockups of potential reports displaying recipient characteristics alongside pretransplant and posttransplant outcomes and solicited feedback at patient and family interviews and focus groups, which included 39 individuals: 10 pilot interviews with candidates seeking liver transplant at the University of Minnesota-Fairview (UMNF) and 5 focus groups with 13 UMNF candidates, 6 UMNF family members, and 10 national recipients. Transcripts were analyzed using a thematic analysis. Several themes emerged: (1) Candidates experience gaps in existing education about center options; (2) patients requested information about how selection criteria might impact access to transplant; and (3) information tailored to a candidate’s medical characteristics can inform decisions. Characteristics shown on mockups varied across centers (P < 0.01). Variation was widespread for small and large centers. In conclusion, variation exists in recipient and donor characteristics across centers. Liver transplant patients provide positive feedback upon viewing patient-specific search tools.
Patient experiences and access to transplant are influenced by geography; however, variation may also result from differences in program-specific candidate selection criteria. Despite guidelines for liver transplantation candidate selection criteria,(1) variations in practice are common for medical and psychosocial characteristics, eg, obesity,(2) incarceration and marijuana use,(3) and alcoholic liver disease,(4)
Additional selection criteria, such as age, Medicaid insurance, and infectious diseases (eg, human immunodeficiency virus [HIV] and hepatitis C virus [HCV]), are relevant to patients; however, this information is currently not readily accessible. Patients with knowledge of centers treating transplant recipients with similar characteristics to themselves would be able to better decide where to seek access to transplant. Although the number of center choices may vary depending on insurance and other constraints, a majority of candidates, including liver patients, report that it would be reasonable to consider more than 1 program.(5) Little is known about the extent of variability in candidate selection criteria across centers and how this information could be presented to patients and family. There are recent calls to include additional patient-centered program measures in public reports,(6-9) and assessing centers’ recent history transplanting patients with specific characteristics is a potential patient-centered measure.
This mixed methods study, using quantitative and qualitative phases,(10,11) sought to identify the extent of variation across centers and the nature of this variation over time and sought to understand how patients perceive the value of this information. Mixed methods studies can combine the strengths of multiple approaches and have been used in related fields, such as in the development of hospital quality reports(12,13) and in the reduction of barriers to palliative care for liver disease patients.(14) An analysis of Scientific Registry of Transplant Recipients (SRTR) data for liver transplant recipients and donors at each US program between January 1, 2015, and December 31, 2017, identified how patient characteristics vary across centers of differing size and over time. The number and proportion of recipients matching each characteristic for each US center was used as a surrogate for potential variation in selection criteria. The quantitative analysis confirmed the extent of variation of patient characteristics that may affect access to transplant depending on the center. Qualitative methods were used to evaluate mockups of center search tools. The mockups represented new website concepts to display patient-specific data about potential transplant centers, in particular, the volume of recent transplant recipients with characteristics similar to a hypothetical patient. A better understanding of patient perspectives about a center’s recent experience treating similar patients can inform the development of tools to inform decision making among liver transplant candidates and can potentially improve access to transplant.
Patients and Methods
ANALYSIS OF CANDIDATES, RECIPIENTS, AND DONORS
This study used data from the Scientific Registry of Transplant Recipients (SRTR). The SRTR data system includes data on all donor, wait-listed candidates, and transplant recipients in the US, submitted by the members of the Organ Procurement and Transplantation Network (OPTN). The Health Resources and Services Administration (HRSA), U.S. Department of Health and Human Services provides oversight to the activities of the OPTN and SRTR contractors. Data included all liver transplant candidates, recipients, and donors at each US program between January 1, 2015, and December 31, 2017. Analyses were restricted to adult transplant centers that performed at least 1 transplant each year. A total of 25 characteristics were chosen based on a literature review(3) and clinician feedback (J.R.L., W.R.K., and A.K.I.). Characteristics were excluded if recent SRTR data were not available for candidates or recipients (eg, tobacco use, duration of alcohol abstinence). For characteristics that are continuous variables, such as age, a preliminary analysis used multiple cutoff values, if appropriate. For example, counts included the number of recipients with a body mass index (BMI) of >35 kg/m2 as well as of >40 kg/m2. Specific analysis parameters were defined for each characteristic (Supporting Table 2). Chi-square tests for the proportion of recipients with each characteristic were used to determine if variation across centers was statistically significant. Chi-square tests included all center sizes; however, the use of proportions rather than the absolute number of recipients accounted for the expected variation based on center size. Descriptive statistics were used to display the proportion of small (1-25 transplantations), medium (26-75 transplantations), and large (76+ transplantations) centers that transplant low or high numbers of recipients with each of these 25 characteristics. Six recipient characteristics were selected as preliminary information to display on mockups of patient-specific center reports if they reflected variability across centers and were consistent with clinician feedback. These recipient characteristics were further analyzed per center for changes over time. Descriptive plots used the proportion of recipients matching each characteristic for 3 consecutive 1-year periods.
DEVELOPMENT OF PATIENT-SPECIFIC SEARCH TOOLS
Mockups of patient-specific reports were developed using hypothetical center names with realistic data. Mockups used graphic displays consistent with existing SRTR online search tools and included existing center measures and outcome metrics (eg, transplant volume, transplant rate, and posttransplant graft survival). Mockups also included new website concepts to tailor center reports based on characteristics of the patient seeking a center. These website concepts included a data entry screen to enter personal information related to the characteristics used in the search results mockups. The website development also included multiple iterations of methods to display search results. The search results showed a list of potential centers, including existing outcome measures and also hypothetical data about whether recent recipients at a center matched relevant characteristics.
Mockups were iteratively refined based on patient feedback. The data entry screen mockup presented information about why a particular patient characteristic might impact center choices (Fig. 1). For example, the mockup represented a hypothetical 70-year-old candidate and displayed a message: “Centers have different age criteria for candidates.” The graphical style of some mockups evolved based on patient feedback. The mockups of search results included early iterations with text beneath each icon (Fig. 2); in revised mockups, the text was replaced by a single key (Fig. 3). Patient-specific data were displayed in multiple graphical views representing either a numerical format or a summary format. The numerical format (see Fig. 2) included a patient-specific column with a pulldown list of recipient characteristics, such as patients over 70 years of age and living donor. The data in these mockups represented realistic values for the number of recipients for a particular characteristic. Participants viewed both count data and percentages (note that only counts are shown in Fig. 2). The summary format (see Fig. 3) included a column with a list of center attributes, including selection criteria and beneficial services. Beneficial services may be sought by some patients, for example, “Greater Range of Donors” represented centers that were more willing to accept US Public Health Service (PHS) increased risk donors or other risk factors. The summary format was conceptual and did not address methodological approaches to determine when a center would be labeled with a particular service.
FIG. 1.
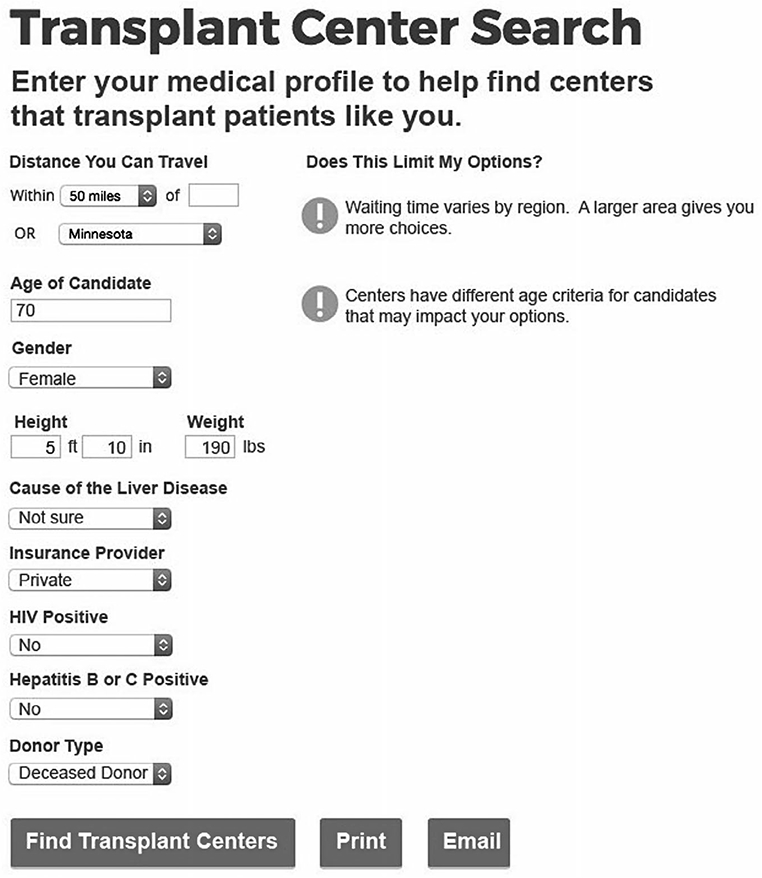
Patient-specific data entry screen mockup discussed in focus groups. The original color figure has been converted to grayscale.
FIG. 2.
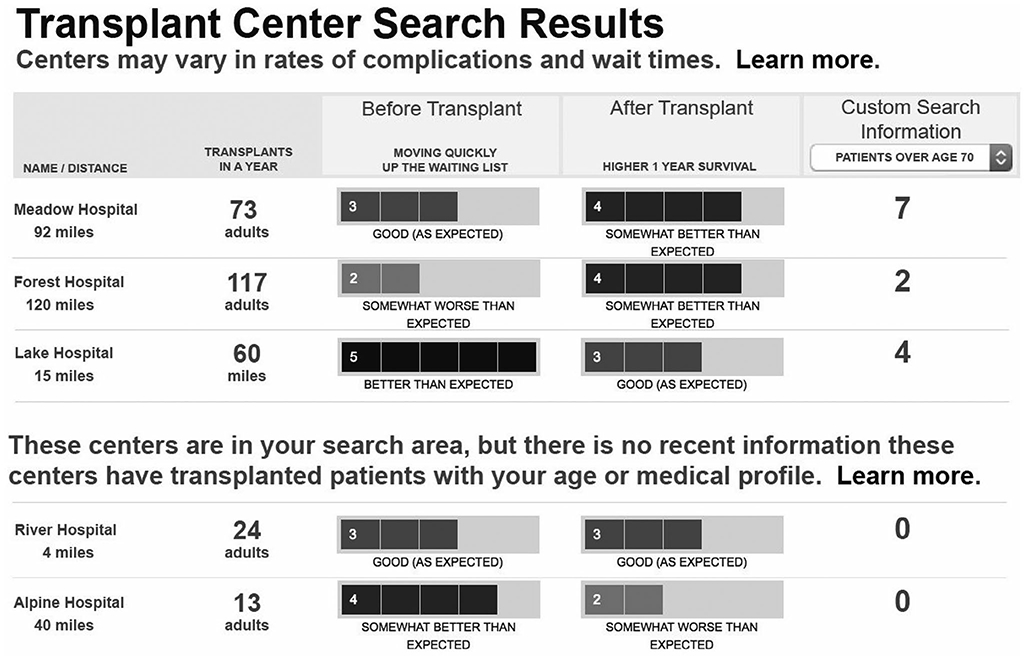
Early iteration of patient-specific search results mockup. The original color figure has been converted to grayscale.
FIG. 3.
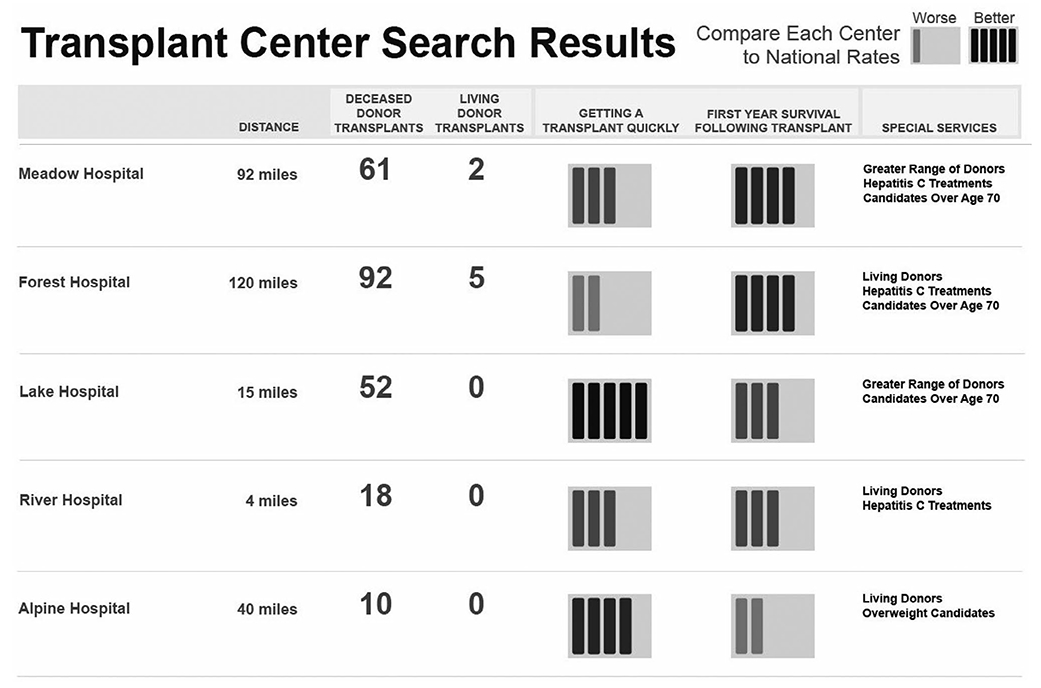
Revised iteration of patient-specific search results mockup. The original color figure has been converted to grayscale.
PATIENT FEEDBACK
We conducted semistructured one-on-one interviews and focus groups with local and national adult (age 18 years or older) transplant candidates and recipients. Local participants were transplant candidates at the University of Minnesota-Fairview (UMNF) clinic in the upper midwestern United States. National participants were recipients from across the United States who were healthy enough to travel. One-on-one interviews elicited patient experiences and informed the development of focus group discussion guides and search tool mockups, whereas focus groups allowed for group interactions and more efficient data collection from national participants about the use of the search tool.
UMNF participants were recruited by research coordinators during or after a regularly scheduled transplant appointment or by mail. The convenience sample included candidates proceeding with an initial evaluation, a retransplant evaluation, or a wait-list follow-up. The first 10 participants were interviewed in person in a clinic conference room. The remaining participants were recruited for focus groups at UMNF.
National transplant recipient focus groups were conducted in Chicago, IL, in a hotel conference room. Participant expenses were paid, including airfare and lodging. Inclusion criteria for national groups included a previous liver transplant (or retransplant). National participants were purposively recruited via e-mail to ensure there was at least 1 participant from most Organ Procurement and Transplantation Network (OPTN) regions. Non-English-speaking candidates were excluded. Each participant gave written, informed consent, and the study was approved by the UMN and Hennepin Healthcare institutional review boards. Participants received a US $40 study honorarium.
Interviews and focus groups were moderated by the same research staff (C.R.S.) trained in qualitative research for human-centered design. A social sciences researcher (M.J.B.) supervised the interviews and focus groups. All focus groups were attended by a transplant physician (A.K.I). The study was presented as an opportunity to learn about patient experiences when choosing a transplant center and to discuss feedback about mockups of new information displays in order to make existing data more usable to patients. The scope of the current analysis includes only discussions about patient-specific report mockups, such as the numerical display (see Fig. 2) and the summary display (see Fig. 3). Discussions outside of this scope, such as comparing pretransplant and posttransplant data, have been reported elsewhere.(15)
Each interview was between 30 and 45 minutes; focus groups were 60-120 minutes long. All participants completed a demographics and comorbidity questionnaire. Postal codes provided were used to determine how many liver transplant centers were located within 100 miles of the patient’s residence (excluding pediatric hospitals and any center with no adult transplants in the previous year).
A structured guide included questions and prompts based on a phenomenological approach to understand how patients choose a center and how new reports generated by patient-specific tools might impact decisions. Discussions were audio recorded and transcribed verbatim. Transcripts were reviewed by 2 analysts (H.F. and C.R.S.). Transcripts were open coded and axial coded through an inductive, thematic analysis.(16,17) Codes were used to organize relevant quotes but were not quantitatively analyzed. All transcripts were coded by the same researcher (H.F.), and 2 transcripts were independently coded by another researcher (C.R.S.). The team of 4 researchers met and discussed discrepancies and reached a consensus on themes consistently expressed by patients and on suitable quotes to reflect patient perspectives. Dedoose coding software (Dedoose, Hermosa Beach, CA) was used to organize data and identify supporting quotations. The methods Supplement (Supporting Table 1) includes additional details for reporting interviews and focus groups using Consolidated criteria for Reporting Qualitative research (COREQ) guidelines.(18)
Results
CENTER VARIATION IN RECIPIENT AND DONOR CHARACTERISTICS
The variability of the 25 recipient and donor characteristics is shown in Supporting Fig. 1. Some characteristics are common, and others are uncommon, as shown by a summary of the distribution of recipient characteristics (Supporting Table 3). For example, only 0.5% of recipients were HIV+, and 20.7% of recipients were of age >65 years. Small centers (1-25 transplants/year) were less likely to have transplanted many recipient characteristics compared with medium (26-75 transplants/year) and large centers (76+ transplants/year). Supporting Fig. 1 includes P values for each characteristic. Out of the 25 characteristics, 19 were statistically significant and suggest variation that was not random. A subset of 6 characteristics with P < 0.01 were shown on mockups of center reports (Fig. 4). This subset demonstrated that within only the subset of large centers, variation for transplants with characteristics such as living donors, HCV+ donor and recipient, and Medicaid insurance may range from 0 to over 21 at a single center. Figure 5 shows variation over time for recipients over age 65 years at each US center (similar data for over 70 years of age is shown in Supporting Fig. 2). Data showing the range of proportions over time are shaded for small, medium, and large centers. Results demonstrate variability within centers over a period of 3 years; however, variability across centers is evident. The mean proportion of recipients age ≥65 years for 3 consecutive years ranged from approximately 0.1 to 0.4 (Fig. 5). The distribution includes small-, medium-, and large-volume programs both at the low and high range of proportions. Plots of variation over time of additional characteristics (eg, BMI, Medicaid, HCV, HIV, and living donor organ) are included in Supporting Figs. 2-8.
FIG. 4.
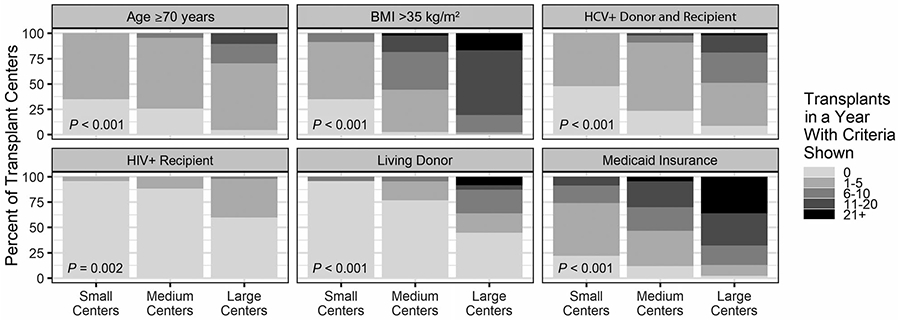
The distribution of transplant recipient and donor volumes for small (1-25 transplants/year), medium (26-75 transplants/year), and large (76+ transplants/year) centers for each recipient and donor characteristic (P < 0.01 for all characteristics). The darker shading reflects a higher number of recipients/donors at a center for each characteristic. A larger shaded area reflects a greater proportion of US centers for each center size. HCV+ donor and recipient indicates that the recipient has HCV+ serology status and the donor has HCV+ serology status. HIV+ recipient indicates that the recipient has HIV+ serology status.
FIG. 5.
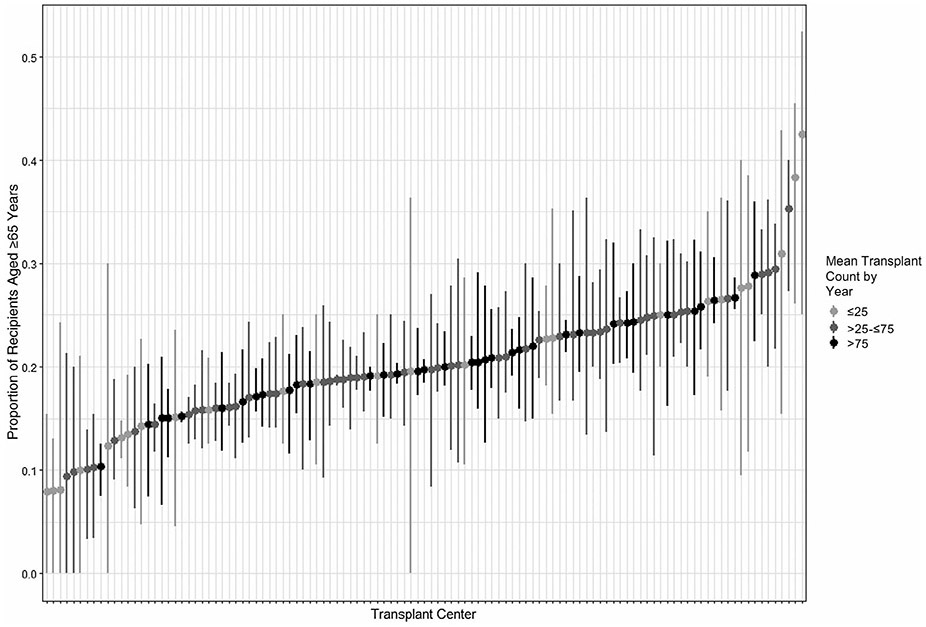
The proportion of recipients of age ≥65 years for each US center for 3 consecutive 1-year periods (2015-2017). Points represent the mean proportions for each transplant center, and the lines represent the minimum-maximum range for each transplant center.
FEEDBACK ON PATIENT-SPECIFIC SEARCH TOOLS
The patient interviews and focus groups and the development of mockups occurred over a time frame of 12 months. A total of 10 participants from UMNF participated in interviews, and 29 participants joined focus groups: 13 candidates at UMNF, 6 family members of UMNF candidates, and 10 national recipients (Table 1). The 5 total groups ranged in size from 4 to 9 participants. Themes and supporting quotes about patient experiences and feedback for the patient-specific mockups are provided here.
TABLE 1.
Characteristics of Liver Transplant Candidates, Family, and Recipients
| UMNF Patients and Family |
|||
|---|---|---|---|
| Local Candidates (n = 23) |
Local Family Members (n = 6) |
National Recipients (n = 10) |
|
| Interview participants, n | 10 | NA | NA |
| Focus group participants (number of groups), n | 13 (2 groups) | 6 (1 group) | 10 (2 groups) |
| Transplant centers within 100 miles | 3 (3-3) | NA | 2 (0-7) |
| Age, years | 57.2 ± 10.0 | 60.8 ± 10.8 | 56.2 ± 15.5 |
| Sex | |||
| Male | 20 (87) | 2 (33) | 3 (30) |
| Race | |||
| Black | 1 (4) | 1 (17) | 0 (0) |
| White | 20 (87) | 4 (67) | 8 (80) |
| Hispanic | 1 (4) | 0 (0) | 0 (0) |
| Other | 1 (4) | 1 (17) | 1 (10) |
| Education | |||
| Less than high school | 2 (9) | 0 (0) | 0 (0) |
| High school | 3 (13) | 2 (33) | 1 (10) |
| At least some college | 15 (65) | 4 (67) | 5 (50) |
| Graduate education | 2 (9) | 0 (0) | 4 (40) |
| Annual household income | |||
| <US $15,000 | 6 (26) | 0 (0) | 0 (0) |
| US $ 15,000-$30,000 | 4 (17) | 2 (33) | 1 (10) |
| US $30,001-$45,000 | 2 (9) | 3 (50) | 0 (0) |
| US $45,001-$60,000 | 2 (9) | 0 (0) | 1 (10) |
| US $60,001-$75,000 | 3 (13) | 0 (0) | 4 (40) |
| >US $75,000 | 4 (17) | 1 (17) | 3 (30) |
| Declined to answer | 2 (9) | 0 (0) | 1 (10) |
| Number of household members | 1.5 ± 0.7 | 2.5 ± 1.7 | 1.7 ± 0.5 |
| Form(s) of insurance* | |||
| Private | 15 (65) | 5 (83) | 6 (60) |
| Medicare | 2 (9) | 2 (33) | 5 (50) |
| Medicaid | 6 (26) | 0 (0) | 0 (0) |
| Not insured | 0 (0) | 0 (0) | 0 (20) |
| Other | 3 (13) | 0 (0) | 1 (10) |
| Self-reported health status | |||
| Excellent | 0 (0) | 0 (0) | 2 (20) |
| Very good | 3 (13) | 2 (33) | 5 (50) |
| Good | 10 (43) | 3 (50) | 3 (30) |
| Fair | 8 (35) | 1 (17) | 0 (0) |
| Poor | 2 (9) | 0 (0) | 0 (0) |
| Has had previous transplant | 1 (4) | NA | 10 (100) |
| Currently on the waiting list | |||
| Yes | 15 (65) | NA | 0 (0) |
| No | 4 (17) | NA | 10 (100) |
| Not sure | 4 (17) | NA | 0 (0) |
NOTE: Data are given as n (%), mean ± standard deviation, or median (range) unless otherwise noted. All questions had <5% missing.
Omitted from the family member questionnaire. Form(s) of insurance allowed multiple selections.
THEME 1: CANDIDATES EXPERIENCE GAPS IN EXISTING EDUCATION ABOUT CENTER OPTIONS
The range of knowledge about center options varied. Although some were aware of geographic variations by medical characteristic (eg, Model for End-Stage Liver Disease [MELD] scores), others reported little awareness of available options or about variability across centers.
And I learned only about other transplant possibilities after the fact when I joined a transplant support team at [my center]… So there are a lot of pieces that I think we don’t know as pretransplant patients that we could be educated about. (national recipient)
Different regions, the MELD score is different in different regions. (local candidate)
I am only familiar with what we have here. I have no information about any other organization in any part of the country that may be better or worse. (local candidate)
Transplant centers are so proprietary, they don’t promote that you can go somewhere else and get listed. (national recipient)
I’ve been made aware that different levels of availability exist. I don’t know where [this center] falls as far as the waiting times and things like that. (local candidate)
I learned a lot from that meeting and just from pamphlets that they gave us. But it didn’t really explain a lot about, like, when I went online and found out your health score doesn’t have to be as high in certain regions, like it does here. That would’ve been helpful to know. (local candidate)
THEME 2: PATIENTS REQUESTED INFORMATION ABOUT HOW SELECTION CRITERIA MIGHT IMPACT ACCESS TO TRANSPLANT
As participants viewed mockups and discussed data entry screens for personal characteristics (see Fig. 1), they described a need for guidance to help interpret why entering the information was important. Few participants described previous knowledge about which selection criteria vary across centers (eg, HIV status).
It’s asking for a lot of information that most transplant candidates don’t know why it’s being asked or how it would affect the transplant. (national recipient)
I just want a liver. I just want to get something that’s going to save my life. So for me, I see that and now I’m thinking there’s information that I don’t know. So maybe a good thing there would be a link for me to go read about it if we think that that’s important. (national recipient)
Are they even going to understand [what is on the patient characteristics entry page]? I mean we know that there are regions and different transplant centers, but there are people out there that just… I mean at the beginning, you don’t know that. (national recipient)
I like [the data entry] with its warnings… I, myself am an HIV+ person, and I just found out about the Hope Act… I’m first on their list. So, something that could be added if somebody answers yes to HIV+. (local candidate)
THEME 3: INFORMATION TAILORED TO A CANDIDATE’S CHARACTERISTICS CAN INFORM DECISIONS
Participants provided scenarios about how the information shown on patient-specific search results (see Figs. 2 and 3) might be used by patients who are learning about options and making treatment decisions. Some comments suggested additional improvements to usability (eg, small pop-up boxes with additional details).
So, if somebody is more apt to be treating more patients with [HCV], I think that would definitely weigh in my decision. (national recipient)
This makes my life easier. I’ve got 3 choices up there. If those don’t work out, then I go to the other ones, but it made my life easier. That’s good. (national recipient)
What I see is that they don’t have any recent experience. They are not going to be my first places to check out. (national recipient)
That’s the way of saying you most likely can’t get a transplant but you might want to check with the center because maybe their cutoff is 70 but you’re 71 and… an athlete so they still might want to transplant you. (national recipient)
That [custom data column] customizes it a little bit better… this is how it pertains to you. (local candidate)
For me, maybe I don’t care about wait-list survival, but I definitely care about greater range of donors. So that metric I want to look at with all of these. (national recipient)
I think it’s interesting… if you hover over [the summary display links] and it shows some sort of data, that’s interesting as well. Because it is a data driven kind of website, you’ll want that. (national recipient)
Discussion
The analysis of recent recipient data was a first step to justify work on patient-specific reports and is complementary to qualitative feedback of mockups designed to provide patient-specific information about transplant centers. The qualitative feedback provided evidence that patients value seeing information about how a transplant center’s recent recipients match their own characteristics. The results suggest that this information may help address questions from patients who seek centers with expertise relevant to candidates with specific conditions.(19) For the liver transplant population, many factors may be important in decisions. On the basis of data currently available from national registry (eg, SRTR) reports, choosing a transplant center based on outcome measures, like transplant rates, may have significant effects on mortality.(20) However, underlying systems and decisions that impact referral and candidate selection are complex, and subgroups with specific characteristics may require additional information. Understanding how variation in selection criteria might impact patient outcomes requires further research. The present studies provide an ongoing opportunity to engage stakeholders to develop patient-specific tools. The patient feedback was used to refine search tool concepts and create a functioning online site to further evaluate patient priorities and behavior (www.transplantcentersearch.org).
The results demonstrate that variability across centers persists over time for multiple characteristics. Many transplant candidates and recipients were not aware that variations across centers could impact access to transplant (see theme 1) and were interested in learning about relevant patient characteristics as part of the search tool (see theme 2). Understanding the sources of variation and interactions with center size is important future work. A simple assessment, such as the numerical display of recipient data (see Fig. 2), may help candidates identify options. A candidate may choose to consider a transplant center with greater expertise with a certain characteristic regardless of whether this expertise was the result of transplant center practice (eg, selection criteria) or regional demographics. Geographic differences exist in waiting time and MELD scores(21,22) as well as listing rates.(23) An analogous scenario is a candidate who temporarily relocates or is on multiple lists to avoid regions with a long waiting time,(24) regardless of the causes of regional disparities in waiting time.
The patient-specific data provide information about recent recipients rather than recent candidates, which may obscure centers that have listed patients meeting these characteristics but have not yet had a donor match. On the other hand, a reliance on candidate data may not provide validation that these candidates are transplanted. For example, centers may list candidates with a high BMI, yet these candidates are 11% to 29% less likely to receive a transplant (BMI 35-40 and 40-60 kg/m2, respectively) than other candidates.(25) The analysis of SRTR data identified patient characteristics that varied across centers; however, the present study does not identify causes of this variation. Although differences attributed to center behavior have been identified,(2-4) the relative contributions of center behavior and local or regional demographics are not known.
The information provided to patients could be used in different ways depending on the characteristic, and examples of how new information might influence decisions were offered by patients (see theme 3). Recently established procedures may be uncommon, such as use of HIV+ donor organs; therefore, an HIV+ candidate might benefit from knowledge of the relatively few centers with this relevant expertise. Other selection criteria may be widespread, but not universal, such as accepting Medicaid candidates. These candidates may benefit from understanding if a potential center is one of the few centers that have not recently transplanted patients like themselves. Other characteristics may reflect potential variations in expertise along a gradient. For example, nearly all large programs recently transplanted at least 1 candidate with a BMI >35 kg/m2. However, the range may be relevant to patients, where some large centers transplant fewer than 5 and others more than 21.
Not all candidates will face limitations in access to transplant due to individual characteristics shown on these mockups. However, out of the 8082 recipients analyzed (see Supporting Table 3), several factors impacted at least 10% of the recipient population: 20.7% were over the age of 65 years; 17.6% used Medicaid insurance; and 14.0% had a BMI >35 kg/m2. These candidates are at an increased risk of seeking an evaluation where they may be declined. They could benefit from patient-specific data to show which transplant centers have accepted candidates like them. The tailored information about recent recipients is intended to be used as a supplement to other information sources, including pretransplant and posttransplant center outcomes, and also trusted sources valued by a candidate (eg, referral or support group recommendations). This is particularly relevant for a candidate who does not match characteristics evaluated here. For example, a candidate who is 50 years old with a BMI of 25 kg/m2 and no infectious disease may instead prioritize differences in transplant rate. Recent research confirms that when comparing metrics of wait-list mortality, transplant rate, and 1-year organ survival, the highest correlation with patient survival after listing for liver candidates is a higher transplant rate.(20) Helping patients interpret quality reports can impact decision making.(15)
Candidates may also consider transplant center practice related to donor criteria and offer acceptance, as center-specific variations exist in quality of donor organs(26) and offer acceptance aggressiveness.(27) For example, 27.5% of recipients in 2017 received a PHS increased risk donor, and the results showing variation across centers for use of PHS increased risk donors (see Supporting Fig. 1) are consistent with past research. Although not shown in mockups, focus group discussions noted the potential to view alternative options in the “Custom Search Information” column (see Fig. 2). For example, a candidate interested in maximizing their potential donor pool could use similar reports to view counts of recipients receiving increased infectious risk donors or metrics based on offer acceptance aggressiveness.(28,29)
The results report themes common across many patients; however, differing perspectives were also observed. In group settings, the feedback for several items was mixed; for example, some participants shared a preference for the numerical display and others for the summary display. Mixed feedback was informative because it suggested that decisions could include additional considerations, such as ease of implementation, and it was also evidence that participants were providing independent assessments. This conceptual work raises important issues to guide future research:
Testing the impact of the search tool on decision making among transplant candidates and on candidate acceptance criteria at programs.
Effectively communicating the data, specifically for small programs or programs with personnel changes, to mitigate risks of unintended consequences (eg, a disincentive to select small centers).
Modeling if specific characteristics are a greater contribution to mortality risks.
Evaluating methods to identify relevant center-specific expertise for rare diseases or characteristics that are lacking national registry data.
The combined studies include a number of important limitations. Quantitative studies provide evidence of variability and changes over time, but they do not identify how much variation might be due to candidate selection criteria. The recipient data analysis does not have the ability to predict if a candidate is more likely to be listed at centers with higher recent experience transplanting similar patients. We attempted to model variation across centers for more common characteristics. We were unable to use models to assess the statistical significance of variations in donor and recipient factors, in part because the considerable number of programs and variations in transplant volume posed problems for analysis. We attempted to use logistic regression, mixed effects models, and correlation coefficients, but none produced robust models (data not shown). Qualitative studies primarily reflect candidates from a single center and a small national sample that may not be representative of all liver transplant candidates; therefore, the study population may limit generalizability. The study participants were recruited during or after transplant evaluations, and therefore, any decisions about visiting a specific transplant center had already been made. This limited real-time discussion of how a decision could have been impacted by additional information. Audio recordings for focus groups did not include speaker identities, so therefore, the demographics of individual speakers are not reported.
In conclusion, there is variation in recipient and donor characteristics across centers that may impact access to transplant for liver transplant candidates. Liver transplant candidates and recipients described a need for guidance to help interpret the personalized tools and provided positive feedback when viewing patient-specific search tools that displayed a center’s recent experience transplanting recipients with similar characteristics. Additional research is needed to understand the impacts of selection criteria differences on patient outcomes and how patients who use a functioning search tool would prioritize and use information about centers that have recent experience transplanting similar recipients.
Supplementary Material
Acknowledgments
This research was partially supported by the Agency for Healthcare Research and Quality (AHRQ) R01 HS 24527 (Ajay K. Israni) and AHRQ and Patient-Centered Outcomes Research Institute (PCORI) K12 HS26379 (Cory R. Schaffhausen) and National Institutes of Health’s National Center for Advancing Translational Sciences, grants TL1R002493 and UL1TR002494 (Warren. T McKinney). The data reported here have been supplied by the Hennepin Healthcare Research Institute (HHRI) as the contractor for the Scientific Registry of Transplant Recipients (SRTR). The interpretation and reporting of these data are the responsibility of the author(s) and in no way should be seen as an official policy of or interpretation by the SRTR or the U.S. Government.
Abbreviations:
- BMI
body mass index
- COREQ
Consolidated criteria for Reporting Qualitative research
- HCV
hepatitis C virus
- HIV
human immunodeficiency virus
- MELD
Model for End-Stage Liver Disease
- NA
not available
- OPTN
Organ Procurement and Transplantation Network
- PHS
US Public Health Service
- SRTR
Scientific Registry of Transplant Recipients
- UMN
University of Minnesota
- UMNF
University of Minnesota-Fairview
Footnotes
Additional supporting information may be found in the online version of this article.
Potential conflict of interest: Nothing to report.
REFERENCES
- 1).Martin P, DiMartini A, Feng S, Brown R, Fallon M. Evaluation for liver transplantation in adults: 2013 practice guideline by the American Association for the Study of Liver Diseases and the American Society of Transplantation. Hepatology 2014;59:1144–1165. [DOI] [PubMed] [Google Scholar]
- 2).Fayek SA, Quintini C, Chavin KD, Marsh CL. The current state of liver transplantation in the United States: Perspective from American Society of Transplant Surgeons (ASTS) Scientific Studies Committee and endorsed by ASTS Council. Am J Transplant 2016;16:3093–3104. [DOI] [PubMed] [Google Scholar]
- 3).Secunda K, Gordon EJ, Sohn MW, Shinkunas LA, Kaldjian LC, Voigt MD, Levitsky J. National survey of provider opinions on controversial characteristics of liver transplant candidates. Liver Transpl 2013;19:395–403. [DOI] [PubMed] [Google Scholar]
- 4).Hasanin M, Dubay DA, McGuire BM, Schiano T, Singal AK. Liver transplantation for alcoholic hepatitis: a survey of liver transplant centers. Liver Transpl 2015;21:1449–1452. [DOI] [PubMed] [Google Scholar]
- 5).Schaffhausen CR, Bruin MJ, Chu S, Wey A, Snyder JJ, Kasiske BK, Israni AK. The importance of transplant program measures: surveys of three national patient advocacy groups. Clin Transplant 2018;32:e13426. [DOI] [PMC free article] [PubMed] [Google Scholar]
- 6).Patzer RE. Quality metrics in transplantation—a new emphasis on transplant access. Am J Transplant 2018;18:1301–1302. [DOI] [PubMed] [Google Scholar]
- 7).Brett KE, Ritchie LJ, Ertel E, Bennett A, Knoll GA. Quality metrics in solid organ transplantation: a systematic review. Transplantation 2018;102:e308–e330. [DOI] [PMC free article] [PubMed] [Google Scholar]
- 8).Kasiske BL, Wey A, Salkowski N, Zaun D, Schaffhausen CR, Israni AK, Snyder JJ. Seeking new answers to old questions about public reporting of transplant program performance in the United States. Am J Transplant 2019;10:317–323. [DOI] [PMC free article] [PubMed] [Google Scholar]
- 9).Greenwald M Shifting the conversation on outcomes reporting. Am J Transplant 2018;18:1303–1304. [DOI] [PubMed] [Google Scholar]
- 10).Creswell JW, Plano Clark VL. Designing and Conducting Mixed Methods Research, 2nd ed. Thousand Oaks, CA: Sage; 2011. [Google Scholar]
- 11).Plano Clark VL, Ivankova NV. Mixed Methods Research: A Guide to the Field. Thousand Oaks, CA: Sage; 2016. [Google Scholar]
- 12).Hibbard JH, Greene J, Daniel D. What is quality anyway? performance reports that clearly communicate to consumers the meaning of quality of care. Med Care Res Rev 2010;67:275–293. [DOI] [PubMed] [Google Scholar]
- 13).Peters E, Dieckmann N, Dixon A, Hibbard JH, Mertz CK. Less is more in presenting quality information to consumers. Med Care Res Rev 2007;64:169–190. [DOI] [PubMed] [Google Scholar]
- 14).Low J, Davis S, Vickerstaff V, Greenslade L, Hopkins K, Langford A, et al. Advanced chronic liver disease in the last year of life: a mixed methods study to understand how care in a specialist liver unit could be improved. BMJ Open 2017;7:e016887. [DOI] [PMC free article] [PubMed] [Google Scholar]
- 15).Schaffhausen C, Bruin M, Chu S, Wey A, McKinney W, Snyder J, et al. Comparing pretransplant and posttransplant outcomes when choosing a transplant center: focus groups and a randomized survey. Transplantation 2020;104:201–210. [DOI] [PMC free article] [PubMed] [Google Scholar]
- 16).Patton MQ. Qualitative Research and Evaluation Methods: Integrating Theory and Practice. London, UK: Sage Publications; 2015. [Google Scholar]
- 17).Maxwell JA. Qualitative Research: An Interactive Design. Thousand Oaks, CA: Sage; 2005. [Google Scholar]
- 18).Tong A, Sainsbury P, Craig J. Consolidated criteria for reporting qualitative research (COREQ): a 32-item checklist for interviews and focus groups. Int J Qual Health Care 2007;19:349–357. [DOI] [PubMed] [Google Scholar]
- 19).Schaffhausen CR, Bruin MJ, Chesley D, McBride M, Snyder JJ, Kasiske BL, Israni AK. What patients and members of their support networks ask about transplant program data. Clin Transplant 2017;31:e13125. [DOI] [PMC free article] [PubMed] [Google Scholar]
- 20).Wey A, Gustafson SK, Salkowski N, Kasiske BL, Skeans M, Schaffhausen CR, et al. Association of pretransplant and posttransplant program ratings with candidate mortality after listing. Am J Transplant 2019;19:399–406. [DOI] [PMC free article] [PubMed] [Google Scholar]
- 21).Hart A, Schladt RD, Zeglin RJ, Pyke PJ, Kim CW, Lake LJ, et al. Predicting outcomes on the liver transplant waiting list in the United States: accounting for large regional variation in organ availability and priority allocation points. Transplantation 2016;100:2153–2159. [DOI] [PMC free article] [PubMed] [Google Scholar]
- 22).Yeh H, Smoot E, Schoenfeld DA, Markmann JF. Geographic inequity in access to livers for transplantation. Transplantation 2011;91:479–486. [DOI] [PMC free article] [PubMed] [Google Scholar]
- 23).Adler JT, Dong N, Markmann JF, Schoenfeld D, Yeh H. Role of patient factors and practice patterns in determining access to liver waitlist. Am J Transplant 2015;15:1836–1842. [DOI] [PubMed] [Google Scholar]
- 24).Cholankeril G, Yoo ER, Perumpail RB, Younossi ZM, Ahmed A. Disparities in liver transplantation resulting from variations in regional donor supply and multiple listing practices. Clin Gastroenterol Hepatol 2017;15:313–315. [DOI] [PubMed] [Google Scholar]
- 25).Segev DL, Thompson RE, Locke JE, Simpkins CE, Thuluvath PJ, Montgomery RA, Maley WR. Prolonged waiting times for liver transplantation in obese patients. Ann Surg 2008;248:863–870. [DOI] [PubMed] [Google Scholar]
- 26).Volk ML, Reichert HA, Lok AS, Hayward RA. Variation in organ quality between liver transplant centers. Am J Transplant 2011;11:958–964. [DOI] [PMC free article] [PubMed] [Google Scholar]
- 27).Goldberg DS, French B, Lewis JD, Scott FI, Mamtani R, Gilroy R, et al. Liver transplant center variability in accepting organ offers and its impact on patient survival. J Hepatol 2016;64:843–851. [DOI] [PMC free article] [PubMed] [Google Scholar]
- 28).Garonzik-Wang JM, James NT, Arendonk KJV, Gupta N, Orandi BJ, Hall EC, et al. The aggressive phenotype revisited: utilization of higher-risk liver allografts. Am J Transplant 2013;13: 936–942. [DOI] [PubMed] [Google Scholar]
- 29).Wey A, Pyke J, Schladt DP, Gentry SE, Weaver T, Salkowski N, et al. Offer acceptance practices and geographic variability in allocation model for end-stage liver disease at transplant. Liver Transpl 2018;24:478–487. [DOI] [PMC free article] [PubMed] [Google Scholar]
Associated Data
This section collects any data citations, data availability statements, or supplementary materials included in this article.