

Abstract
The accurate diagnosis of scar type and severity relies on histopathology of biopsied tissue, which is invasive and time-consuming, causes discomfort and may exacerbate scarring. Here, we show that imaging nanoprobes for the live-cell detection of intracellular messenger RNA (mRNA) (also known as NanoFlares) enable measurements of the expression of connective tissue growth factor (CTGF) as a visual indicator of hypertrophic scars and keloids. During cell culture, NanoFlares enabled the distinction of hypertrophic and keloidal fibroblasts from normal fibroblasts, and the detection of changes in CTGF expression resulting from the regulatory effects of transforming growth factor-β (TGF-β) agonists and TGF-β antagonists. We also applied the NanoFlares topically to the skin of live mice and rabbits, and to ex vivo human skin models. Transepidermal penetration of the NanoFlares enabled the visual and spectroscopic quantification of underlying abnormal fibroblasts on the basis of CTGF mRNA expression. Our proof-of-concept studies of topically applied NanoFlare technology as a means of biopsy-free scar diagnosis may eventually inform therapeutic decisions on the basis of the mRNA-expression patterns of skin disorders.
Changes in messenger RNA (mRNA) expression have been shown to be a promising biomarker for early diagnosis and prognosis of diseases such as cancer1,2. The analysis of mRNA expression requires procurement of tissue by invasive biopsy, followed by destructive tests such as quantitative polymerase chain reaction (qPCR) or in situ hybridization methods. Although dermal skin tissue is highly accessible, its removal obligatorily results in scarring. A non-invasive and convenient method for detecting the expression of cutaneous mRNA would be a highly desirable diagnostic technology, but would require passage through the epidermal barrier following topical application. Nucleic-acid-based molecular beacons are only suitable for in vitro examination, since they do not readily cross the stratum corneum. This is due to their hydrophilic nature and being significantly larger than 500 Da3. NanoFlares are a type of gold nanoparticle spherical-nucleic-acid (SNA) technology, comprising a short fluorophore-labelled ‘reporter strand’ bound to a longer oligonucleotide ‘recognition sequence’ immobilized on a gold nanoparticle core. The reporter strand is quenched in the absence of its mRNA target due to its proximity with the gold nanoparticle core. In the presence of its target, the reporter strand is displaced, and its fluorescence signal restores. NanoFlares have emerged as powerful tools for the sequence-specific intracellular detection of mRNA4–9. The SNAs that define them are actively recognized by class A scavenger receptors and internalized via the endosomal pathway10,11. Before being degraded, they are released into the cytoplasm and have been used for both monitoring the presence of specific RNA targets and effecting sequence-specific gene knockdown12–15. Since they are fluorescent ‘turn-on’ probes, a small amount of endosomal escape leads to stochiometrically meaningful amounts for both detection and knockdown purposes. Notably, NanoFlares have minimal impact on stem cell pluripotency markers and remain within cells for a period of days9. Fluorescence intensity is, in most cases, proportional to the quantity of the available gene target. Early research has shown that SNA species are able to penetrate the stratum corneum to reach epidermal and even dermal cells13,15, suggesting that NanoFlares could be topically applied for non-invasive diagnostic testing, including as a tool for monitoring the success of gene suppressive topically delivered SNA-based nanotherapy.
To examine this possibility, we studied the utility of NanoFlare technology for the minimally invasive and real-time detection of mRNA biomarkers in hypertrophic and keloidal scars, which are aberrant fibrotic responses to skin injury. Scars reflect gene expression alterations in the dermis (deeper skin layer), allowing one to test the extent of penetration after topical application. Cultured dermal fibroblasts from hypertrophic and keloidal scars overexpress connective tissue growth factor (CTGF) and transforming growth factor-β (TGF-β), leading to collagen overproduction. Recognition of this dermal mRNA overexpression signature enables preliminary in vitro studies to optimize gene detection. Early detection to predict scar outcome would increase the opportunities for intervention when the scar is still immature and clinical intervention is most successful16,17, rather than when the abnormal scar is fully developed. A non-invasive technique for detecting these aberrant scars (hypertrophic and keloidal scars) is particularly welcome, given their propensity to worsen if biopsied18.
Using CTGF mRNA as a prototype genetic target overexpressed in both hypertrophic scars and keloids, we show that CTGF NanoFlares respond to their target with high specificity by producing an increased fluorescence signal. This allows visualization and quantification of CTGF mRNA expression in live fibroblasts in vitro. The NanoFlare signal also correlates well with mRNA expression by qPCR analysis and allows the differentiation of hypertrophic scar fibroblasts (HSFs) and keloidal scar fibroblasts (KSFs) from normal dermis fibroblasts (NDFs). In addition to quantifying stably expressed mRNA biomarkers, NanoFlares also permit monitoring of dynamic cellular mRNA expression. Changes in the CTGF expression of cells induced by alterations in upstream TGF-β were also reliably detected. Finally, NanoFlares applied to in vivo (mice and rabbit) and ex vivo (human) scar models through topical application showed excellent penetration and target detection. In these models, fluorescent signals from topically applied NanoFlares could be used to distinguish NDFs, HSFs and KSFs, as well as corresponding peri-scar cell populations, and provide a means for quantifying the extent of abnormal scarring.
Results
Identification of abnormal fibroblasts with NanoFlares in vitro.
Abnormal scar and normal skin-derived fibroblasts differ in several ways. For example, HSFs are more contractile and have a higher rate of collagen synthesis, giving rise to the typical dermal scar tissue morphology (excessive collagen production abutting on the epidermis)19. Compared with NDFs, HSFs also have higher levels of expression of α-smooth muscle actin, a protein that accounts for their contractile nature (Supplementary Fig. 1a,b), CTGF (Supplementary Fig. 1c) and TGF-β20. Thus, these biomarkers distinguish HSFs from NDFs. Based on the approximately ninefold increased gene expression of CTGF (Supplementary Fig. 1c) and its well-established role as a downstream target of TGF signalling activity21, CTGF was chosen as the model biomarker for this proof-of-concept study.
For initial sensitivity studies of the NanoFlare, a 20-base-pair oligonucleotide (Basic Local Alignment Search Tool E-value: 3 ×10⁻⁶ for Homo sapiens CTGF), perfectly complementary to the CTGF NanoFlare detection strand, was used as a surrogate for CTGF mRNA (perfect CTGF target). To assess hybridization, the signal of NanoFlares treated with DNase I was considered as the positive control (100%), while the background fluorescence intensity of NanoFlares was used as the negative control (0%). When the NanoFlare concentration was fixed at 100 pM during the hybridization assay, increasing the target sequence concentration from 1.28 to 800 nM resulted in a gradual increase in the fluorescence signal before the signal intensity stabilized due to the saturation of NanoFlares and target sequence binding (Supplementary Fig. 2a). Later, the target sequence was fixed at 800 nM, and the concentration of NanoFlare was varied between 0.41 and 300 pM (Supplementary Fig. 2b). A NanoFlare signal intensity plateau was observed at 100 pM, and additional NanoFlares did not generate higher intensity. This suggests that the ratio for optimal signal between the target sequence and NanoFlares was ~8,000:1.
To examine the specificity of the CTGF NanoFlares, we used scrambled (SCRM) NanoFlares (detection sequences not corresponding with any known gene) as a negative non-coding control. As shown in Fig. 1a, the mixing of CTGF NanoFlares and the target sequence resulted in a significant increase in fluorescence signal (~5.5-fold) compared with the original NanoFlare solution signal. In contrast, there was no significant increase in the fluorescence signal when SCRM NanoFlares were used. Moreover, when two different NanoFlares carrying complementary fluorophores (that is, CTGF labelled with Cy5, and glyceraldehyde 3-phosphate dehydrogenase (GAPDH) labelled with Cy3) were mixed, the addition of the CTGF target sequence resulted in a similar increase in the Cy5 signal intensity (Fig. 1a), without a discernible change in the Cy3 signal intensity (Supplementary Fig. 3). Both single (CTGF) and dual (CTGF and GAPDH) NanoFlare solution hybridization experiments confirmed the specificity of NanoFlares to CTGF mRNA, its intended target.
Fig. 1 |. In vitro assessment of NanoFlare (NF) specificity to target mRNA.
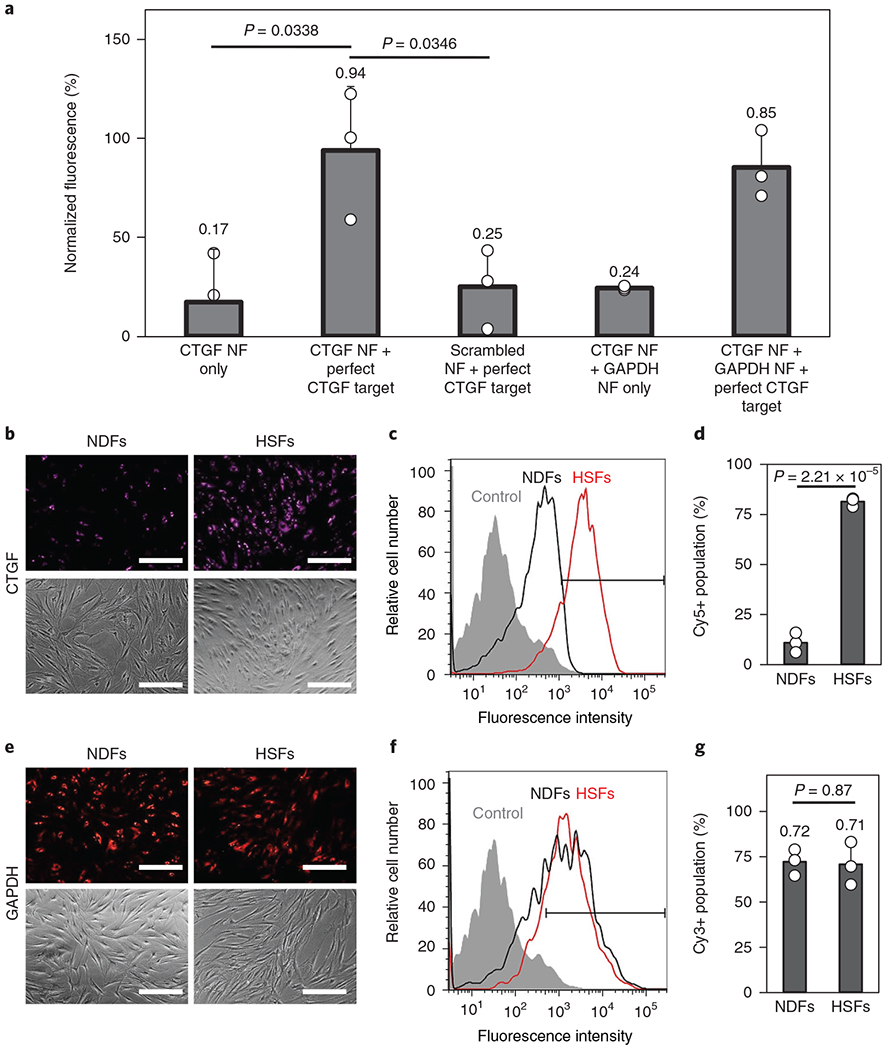
a, Hybridization assays between CTGF NFs, GAPDH NFs, scrambled NFs and the perfect CTGF target (n = 3). b,c, Fluorescence imaging (b) and flow cytometry (c) of NDFs and HSFs after CTGF NF labelling. d, Quantification of the Cy5 positively gated fluorescent cells from the flow cytometry analysis seen in c (n = 3). e,f, Fluorescence imaging (e) and flow cytometry (f) of NDFs and HSFs after GAPDH NF labelling. g, Quantification of the Cy3 positively gated cells expressing GAPDH from the flow cytometry analysis seen in f (n = 3). Scale bars, 100 μm. Values are means ± s.d.
Subsequently, NanoFlares were used to reveal the cellular expression of CTGF mRNA in live HSFs and NDFs (shown in Supplementary Fig. 1c). As shown in Fig. 1b–d, CTGF NanoFlare labelling induced a stronger fluorescence in HSFs. Flow cytometry revealed that the average fluorescence intensity of HSFs was ten times that of NDFs (Fig. 1c). By defining cell populations that showed a stronger fluorescence signal compared with unlabelled cells as Cy5+, approximately 80% of HSFs were gated positive compared with ~10% of NDFs (Fig. 1d). Confocal imaging further revealed that the CTGF NanoFlare fluorescence signal was localized within the cell cytoplasm (Supplementary Fig. 4a).
Unlike the observations made using CTGF NanoFlares, HSFs and NDFs showed similar fluorescence signal intensities using GAPDH NanoFlares (Fig. 1e). This similarity was further verified using flow cytometry (Fig. 1f), in which approximately 70% of both cell types were gated positive for the GAPDH signal (Fig. 1g). Similar to the CTGF signal, the GAPDH NanoFlare signal emitted from the cytoplasmic region (Supplementary Fig. 4b). NanoFlare specificity was further observed when SCRM NanoFlares expressed minimal cytoplasmic fluorescence signal (Supplementary Fig. 4c). Thus, NanoFlares have high detection specificity, allowing HSFs to be distinguished from NDFs by CTGF expression levels.
Our studies also found that CTGF overexpression is not limited to cells derived from hypertrophic scar tissue. qPCR analysis showed that fibroblasts derived from skin adjacent (< 10 mm margin) to hypertrophic scars—peri-hypertrophic scar fibroblasts (PHSFs)—expressed CTGF at approximately fourfold higher levels than NDFs (Supplementary Fig. 5). KSFs and fibroblasts derived from skin adjacent to keloid scars (that is, peri-keloid scars) (PKSFs) expressed CTGF at approximately twofold higher levels than NDFs. To determine whether NanoFlares were sensitive enough to distinguish between these five different fibroblasts sources, we labelled the five different cell types with CTGF NanoFlares. Fluorescence imaging revealed that HSFs showed the strongest fluorescence (Fig. 2a and Supplementary Fig. 6). By quantifying and then normalizing the fluorescence signal from CTGF NanoFlares (purple) against the fluorescence signal from nuclear staining in each cell (blue), CTGF expression was found to be highest in HSFs and lowest in NDFs with an 11.2 ± 1.13-fold difference (Fig. 2b). PKSFs, KSFs and PHSFs expressed signal intensities of 2.3 ± 0.29, 4.5 ± 0.98 and 6.2 ± 1.64, respectively, demonstrating that NanoFlares could be used to distinguish between these various scar types and peri-scar cells as a result of differential CTGF expression. The expression of CTGF was significantly lower in NDFs than in KSFs, PHSFs and HSFs, whereas the expression in HSFs was significantly higher than in the rest of the cells (Fig. 2b). Quantification of NanoFlare imaging correlated well with CTGF mRNA expression assessed by qPCR (coefficient of determination, R2 = 0.9899) (Fig. 2c).
Fig. 2 |. Discriminating fibroblasts by CTGF expression levels using NanoFlares (NF).
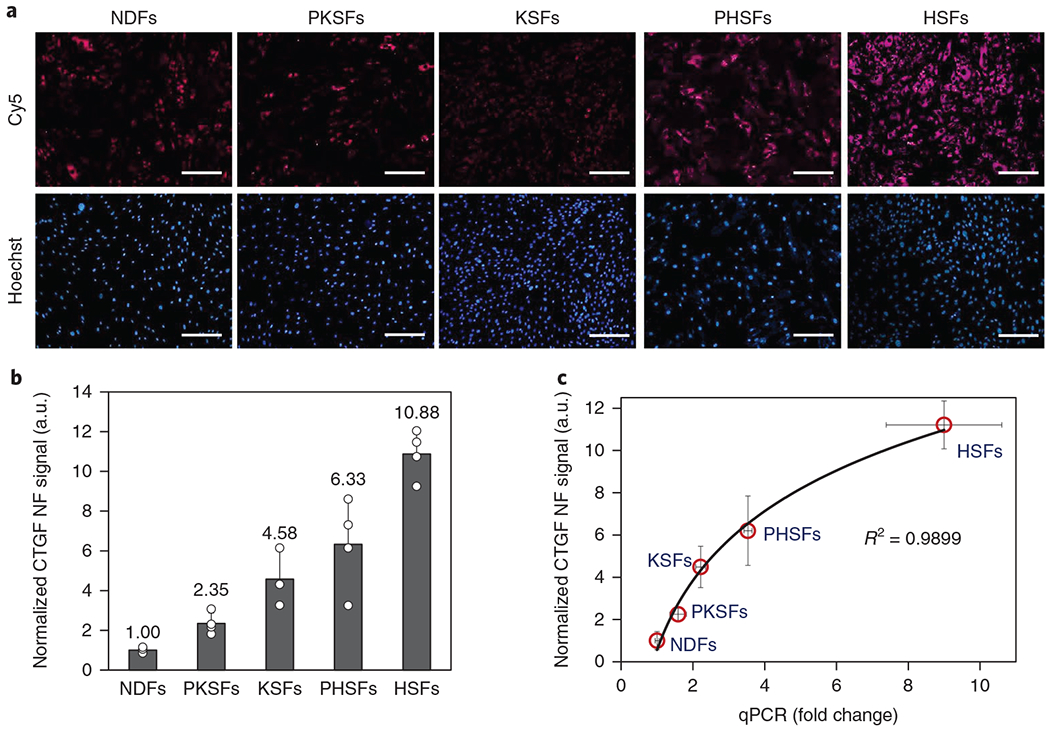
a, Representative fluorescence images of NDFs, PKSFs, KSFs, PHSFs and HSFs labelled with CTGF NFs (Cy5) and Hoechst. Scale bars, 100 μm. b, Quantification and normalization of the CTGF NF signal against NDF and nuclear staining signal (Hoechst, n = 4). c, Correlation between the normalized CTGF NF signal and normalized qPCR results (n = 4). Values are means ± s.d.
Screening of effective agents for gene regulation in abnormal fibroblasts.
Besides the ability to detect stably expressed CTGF profiles, NanoFlares also enable in situ monitoring of gene changes; for example, upon treatment with chemical factors. The addition of TGF-β1 growth factor is known to induce a concentration-dependent increase in CTGF expression22, while suppression of TGF-β receptor expression reduces the expression of downstream CTGF23. Here, we treated HSFs with TGF-β1 RepSox (a TGF-β receptor inhibitor), and small interfering RNA (siRNA) directed against the TGF-β1 receptor with nonsense siRNA as a control (Fig. 3a,b). In HSFs, CTGF was significantly reduced by the addition of RepSox (1.75-fold) and siRNA against the TGF-β1 receptor (5.37-fold), but not the nonsense TGF-β1 receptor siRNA control; the addition of TGF-β1 growth factor did not significantly increase the CTGF NanoFlare signal, probably due to saturated signalling receptors. In contrast, the addition of TGF-β1 growth factor to NDFs led to a 4.95-fold elevation of CTGF signal (Fig. 3c,d), whereas RepSox, TGF-β1 receptor siRNA (TGF-β antagonists) and nonsense siRNA controls did not influence the CTGF NanoFlare emission intensity. To further evaluate CTGF NanoFlare specificity, NDFs were treated with TGF-β1 and labelled with GAPDH NanoFlares. Both flow cytometry analysis (Supplementary Fig. 7a) and imaging (Supplementary Fig. 7b) confirmed that TGF-β1 treatment caused no detectable change in GAPDH expression levels, positioning GAPDH as a suitable reference gene.
Fig. 3 |. Monitoring TGF-β-induced CTGF expression changes with NanoFlares.
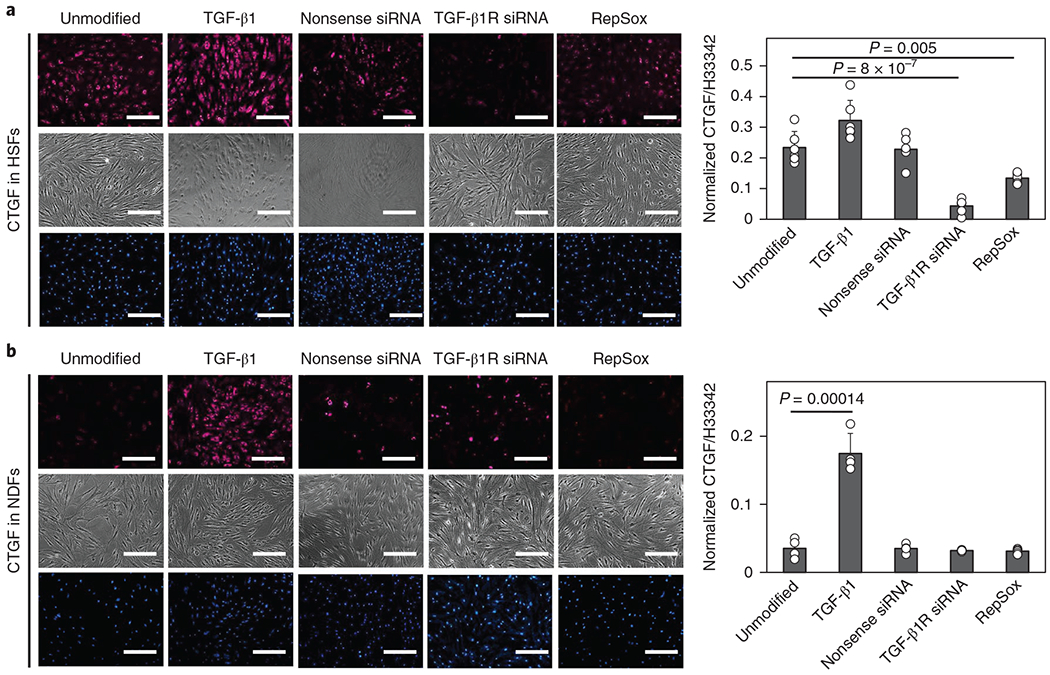
a,b, Left: images of HSFs (a, n = 5) and NDFs (b, n = 4) treated with TGF-β1, RepSox, siRNA against the TGF-β1 receptor (TGF-β1R) or nonsense siRNA before NanoFlare labelling and image analysis (top, CTGF-Cy5 NanoFlare (magenta); middle, phase contrast; bottom, Hoechst (H)33342-labelled cell nuclei (blue) imaging). Right: quantification of the cellular fluorescence intensity of the various conditions. Scale bars, 100 μm. Values are means ± s.d.
After NanoFlare labelling, fluorescence signals gradually decreased with time. For example, cellular fluorescence in HSFs labelled with GAPDH NanoFlares decreased by 10.7, 14.8 and 33.0% on days 1, 2 and 3 post-labelling, respectively, and reached a signal equivalent to SCRM NanoFlares after 4 days (Supplementary Fig. 8a,b). The CTGF NanoFlare signal in HSFs also decreased over time (Supplementary Fig. 8c,d). Despite the signal attenuation, differences in CTGF mRNA expression could still be detected. As shown in Supplementary Fig. 8c,d, RepSox-treated HSFs (Rep:HSFs) consistently showed a lower CTGF NanoFlares signal than untreated HSFs over a period of four days post-labelling.
Thus far, we have shown that NanoFlares can specifically and sensitively detect CTGF biomarker overexpression in HSFs, as well as its fluctuations following treatment with agonists and antagonists of upstream TGF-β signalling. This ability to identify changes in the expression of CTGF when treated with biological agents suggests that NanoFlares can serve as a rapid and convenient screening assay to determine the mechanism of, and predict the response to, drugs such as decorin24, rapamycin25 and pirfenidone26, which have been used to treat abnormal scars. Although RepSox and thiazovivin have not been reported for hypertrophic scar therapy, they are potentially suitable because they efficiently inhibit TGF-β27 and Rho kinase28, which influences hypertrophic scars.
The testing platform consisted of target cells (that is, HSFs), drug candidates and various NanoFlares. All drug candidates had negligible influence on cell viability (Supplementary Fig. 8e). The CTGF NanoFlare signal was also compared with expression levels from SCRM and GAPDH NanoFlares for non-specific signals and reference genes, respectively. The emitted NanoFlare signals were obtained using a multi-plate reader. As proof-of-concept, we treated HSFs with TGF-β1 RepSox, rapamycin, decorin, thiazovivin and pirfenidone for 24–48 h (depending on established protocols and manufacturer instructions) and labelled them with a mixture of CTGF (670 nm) and GAPDH (570 nm) NanoFlares as well as Hoechst (461 nm), the cell nuclei stain. Thereafter, signals from CTGF or GAPDH NanoFlares were normalized to the Hoechst signal (Fig. 4a). If the CTGF signal decreased, yet GAPDH did not significantly change, the compound could be considered effective in suppressing CTGF expression, suggesting it would be a promising therapeutic candidate.
Fig. 4 |. NanoFlares (NFs) as a rapid screening assay to determine the mechanism of anti-hypertrophic scar drug candidates.
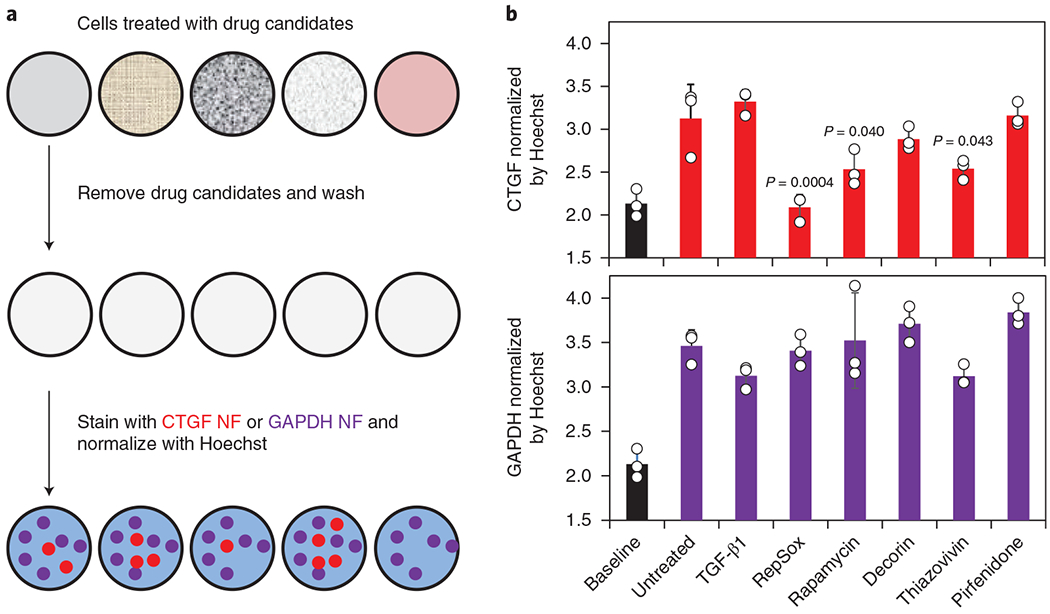
a, Process workflow showing the treatment of wells, with different compounds (that is, TGF-β1, RepSox, rapamycin, decorin, thiazovivin and pirfenidone) being normalized by the Hoechst signal. Samples were processed using the indicated steps before signal acquisition. b, Quantification of CTGF and GAPDH NF signals following treatment with the chemical compounds. CTGF and GAPDH NF signals of all samples were compared with those of untreated cells by one-way ANOVA. Baseline (black) values represent non-coding SCRM NF expression (n = 3). Values are means ± s.d.
As shown in Fig. 4b, the GAPDH NanoFlare signal did not significantly change in any of the test groups, suggesting its suitability as a stably expressed reference gene during drug screening. Similar to observations in Fig. 3a,b, TGF-β1 treatment did not generate a significant change in the CTGF NanoFlare signal of HSFs. RepSox generated the most significant CTGF suppression (reduced NanoFlare signal similar to baseline SCRM NanoFlare levels), followed by rapamycin and thiazovivin. The anti-scarring drugs pirfenidone and decorin trended to reduction in CTGF signal, but did not reach significance. These results demonstrate that NanoFlares can be adapted for high-throughput screening use to identify genetic mechanisms induced by candidate therapeutic agents using a single microplate. Its versatility in combining various gene targets and fluorophores make this flexible strategy applicable to high-throughput screening, facilitating the discovery and optimization of new therapeutics, particularly for the emerging fields of personalized and precision medicine.
Identification of abnormal fibroblasts with NanoFlares in vivo.
With NanoFlares demonstrating remarkable specificity, versatility and sensitivity in two-dimensional culture, we investigated whether they could detect the CTGF biomarker overexpressed in HSFs in vivo. A subcutaneous Matrigel plug model was chosen to determine NanoFlare detection feasibility in vivo. HSFs and CTGF NanoFlares were mixed in Matrigel (Fig. 5a) with Hoechst signal as the reference, and the NanoFlare signal was clearly visible through the Matrigel before transplantation (Fig. 5b). Subsequently, a plug was subcutaneously injected into the dorsal aspect of the fore- and hindlimbs in hairless mice (Fig. 5c). The optimal cell density per Matrigel plug (6 × 10⁶ cells plug−1) was selected as the minimal concentration that generated a desirable signal using a similar NanoFlare concentration (Supplementary Fig. 9). Similar to in vitro data, implanted plugs containing HSFs showed the strongest fluorescence compared with those containing either PHSFs or NDFs (Figs. 5c,d). Using the NDF signal as a baseline, a 6.1-fold increase in the fluorescence signal for HSFs versus a 2.6-fold increase for PHSFs (Fig. 5d and Supplementary Fig. 10) was observed in vivo. For SCRM-NanoFlare-labelled cells (NDFs, PHSFs and HSFs), fluorescence signals were not significantly different.
Fig. 5 |. Non-invasive detection of NanoFlare signals in live mice.
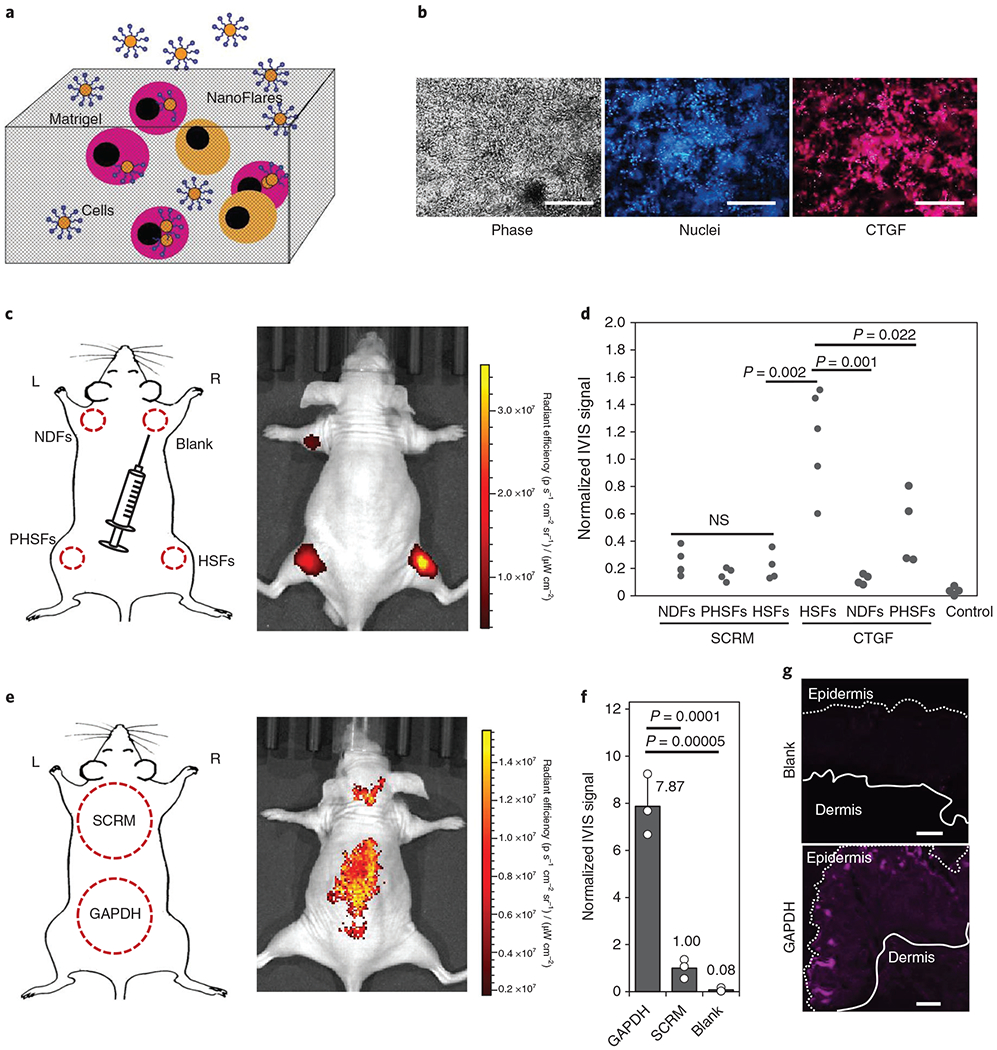
a, Schematic of the Matrigel laden with NanoFlares and cells. b, In vitro imaging of NanoFlare-labelled HSFs in Matrigel using phase contrast (left), Hoechst-labelled cell nuclei (middle, blue) and CTGF-Cy5 NanoFlare (right, magenta) imaging. c, Schematic and representative IVIS image of the subcutaneous injection of NDFs (SCRM-Cy5), PHSFs (SCRM-Cy5), HSFs (Cy5) and empty gel (blank). The dotted areas represent the approximate regions of injected cells. d, Dot plots of the IVIS signals generated from NDFs, PHSFs, HSFs and negative controls without cells labelled with either SCRM or CTGF NanoFlares (n ≥ 4). e, Schematic and representative IVIS image of the topically applied SCRM and GAPDH NanoFlares. The dotted regions represent the approximate areas of application. f, Normalized IVIS signals of the topically applied GAPDH and SCRM NanoFlares and empty gel (blank) (n = 3). g, Representative Cy5 fluorescent images of the topically applied empty gel (blank, top) and GAPDH NanoFlare (bottom) on mouse skin (epidermal and dermal sides are indicated). Scale bars, 100 μm. Values are means ± s.d. L, left; NS, not significant; R, right.
To further evaluate transepidermal penetration and detection properties using NanoFlares, mouse GAPDH (mGAPDH; commonly used as a reference gene due to its ubiquitous and stable expression)-Cy5 and SCRM (non-coding-control) NanoFlares were topically applied to the dorsal region of hairless mice for 48 h before In Vivo Imaging System (IVIS) imaging. A schematic showing the approximate region of topical application and a representative IVIS image are shown in Fig. 5e. In contrast with the SCRM NanoFlares application region, mGAPDH NanoFlares generated a strong signal, which was almost eightfold higher than the signal generated by SCRM NanoFlares (Fig. 5f). The IVIS signal was further validated by imaging skin sections harvested from unlabelled skin (blank) and regions strongly expressing Cy5 (Fig. 5g). In contrast with unlabelled skin, which generated little discernible signal (Fig. 5g, upper image), the region with GAPDH application (Fig. 5g, lower image) showed strong signal localization near the skin surface. Thus, topically applied NanoFlares can penetrate mouse skin and generate signals for specific intracellular genetic targets in vivo.
Despite the promising results from in vivo mouse studies, penetration of human skin is a greater challenge and could compromise the clinical translation of NanoFlares. Compared with mouse skin, humans have more layers of epidermal cells and fewer hair follicles (potential route of entry), which presents a more challenging epidermal barrier for NanoFlare penetration29. As a substitute for clinical patients, excess skin from abdominoplasty procedures was obtained to create ex vivo abnormal scar disease models. The tissue cryopreservation, processing and culture conditions maintained skin tissue viability and structural integrity30. The thickness of whole skin from these models was within the range of normal skin (epidermis and dermis) in vivo (1.3–2.9 mm)31. To assess the transdermal penetration properties of NanoFlares, ‘uptake control’ NanoFlares that persistently generated Cy5 fluorescence were topically applied on the surface of this live skin model (Supplementary Fig. 11). Skin samples were obtained 48 h after application for quantification of the Cy5 signals by image analysis. Compared with unmodified skin (blank), Cy5 signals was much higher in the particle-treated skin samples (Supplementary Fig. 11a). Quantification of NanoFlare distribution revealed that they could be found at depths of up to 1.4 mm (Supplementary Fig. 11b). At depths > 1 mm from the epidermis, the NanoFlare concentration was approximately 60% lower than concentration levels observed at the skin surface.
To create a whole tissue abnormal scar disease model, dye-labelled fibroblasts were injected into the dermal region of the ex vivo human skin model before NanoFlares were topically applied on the skin surface (Fig. 6a and Supplementary Fig. 12). Representative images showed that dye-labelled HSFs localized to the dermis region (below the epidermis) following cell injection (Supplementary Fig. 12). The model skin tissue was then imaged using two different fluorescent channels—570 and 670 nm—to detect signals from the labelled cells (DiI) and disease biomarker (Cy5), respectively. Different combinations of NanoFlares (CTGF or SCRM) and cells (Rep:HSFs, HSFs or NDFs) were employed to determine whether NanoFlares could identify the extent of disease phenotype as a function of CTGF expression.
Fig. 6 |. Topically applied NanoFlare detection of abnormal scar cells within ex vivo skin.
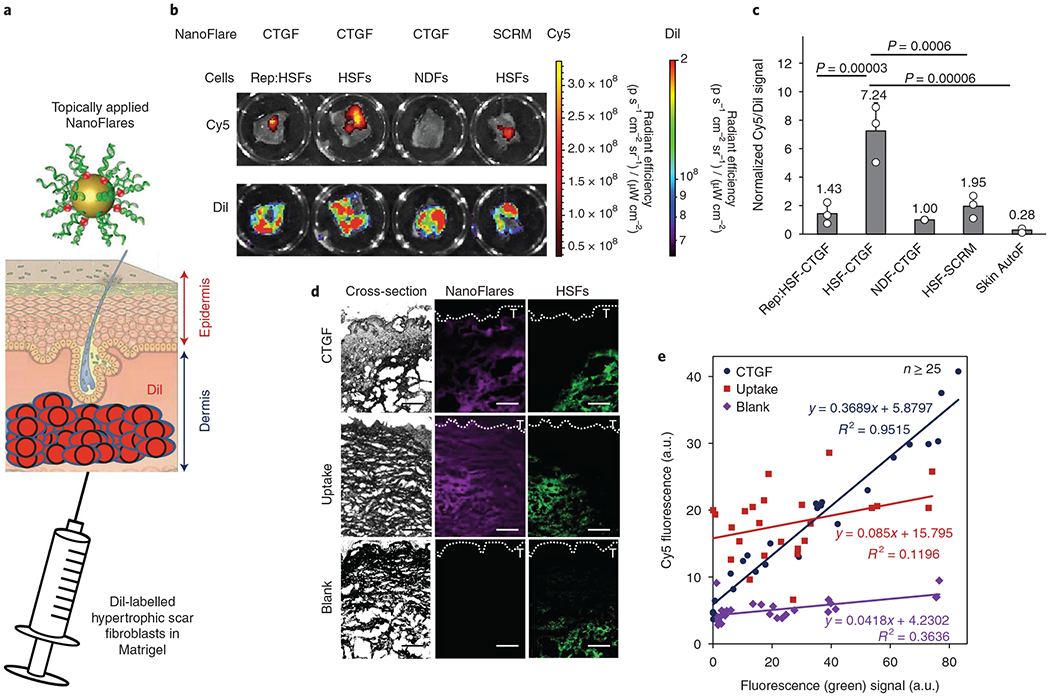
a, Schematic of the topical application of NanoFlares in Aquaphor (a common skin moisturizer) to ex vivo human skin in culture that has been injected through the dermal side with DiI-labelled cells (HSFs and NDFs). b, Representative IVIS images of Cy5- and Dil-labelled NDFs, HSFs and Rep:HSFs. c, Quantification (n = 3) of skin sections modified with DiI-labelled NDFs, HSFs and Rep:HSFs (2 × 10⁶ cells per skin section) compared to the signal from skin autofluorescence (Skin AutoF; no exogenous cells). Each skin sample was treated with the indicated NanoFlare (CTGF or SCRM). d, Representative images of modified skin sections (HSF engineered skin with CTGF NanoFlares and skin sections treated with uptake NanoFlares) and unmodified skin (blank) containing DiI-labelled HSFs (green) and NanoFlares (purple). T denotes the skin surface. e, Quantification of the results shown in d. Correlation values between labelled cells and NanoFlare signal is indicated within the graph. Values are means ± s.d.
From the emitted DiI signal, we discerned that the number of implanted cells was approximately constant (Fig. 6b). From representative IVIS images (Fig. 6b) and the graphed plot (Fig. 6c), HSFs emitted a greater than sevenfold higher Cy5 signal (Fig. 6c) than NDFs. CTGF signal specificity was further ascertained by the lower signal from SCRM NanoFlares. Moreover, NanoFlares also showed that Rep:HSFs expressed similar CTGF expression to NDFs. This suggests that topically applied CTGF NanoFlares can be used to monitor abnormal scar responses to therapy.
To identify the source of the NanoFlare signal, HSF engineered skin engineered with CTGF NanoFlares (HSF-CTGF) was compared with skin sections treated with uptake NanoFlares and unmodified skin (blank). Whereas the CTGF NanoFlare signal localized with HSFs (green signal), uptake NanoFlares indiscriminately expressed Cy5 with signal throughout the skin section, even in locations devoid of HSFs (Fig. 6d). In contrast, the CTGF signal largely coincided with DiI (Fig. 6d). To quantify this relationship, NanoFlare (purple) and HSF (green) signals from various regions of skin were plotted and their relationship examined (Fig. 6e). For uptake NanoFlares, there was little correlation between Cy5 and DiI signals, suggesting minimal overlap between NanoFlare and HSF location. In contrast, CTGF NanoFlares expressed a higher correlation between the NanoFlare and HSF signals. In regions with low DiI, low Cy5 expression could similarly be found, but a higher Cy5 signal corresponded with higher DiI expression (Fig. 6e). This good degree of correlation between CTGF(Cy5) and HSF(DiI) was repeatedly observed (Supplementary Fig. 13). NanoFlare signals were also found to increase with respect to time (Supplementary Fig. 14a), with maximal expression from the HSF-CTGF group 48 h post-application. Furthermore, HSF-SCRM, NDF-CTGF and Rep:HSF-CTGF groups expressed significant amounts of non-specific Cy5 signal at the skin surface (removed by washing), whereas the HSF-CTGF signal consisted mostly (94%) of in situ signal from the tissue (Supplementary Fig. 14b). Non-specific signal from the HSF-SCRM, NDF-CTGF and Rep:HSF-CTGF groups accounted for ≥37% of the total signal measured (due to the minimal signal generated within the tissue), whereas the proportion for HSF-CTGF was significantly lower (6%). This further illustrates the high detection specificity of CTGF NanoFlares in the disease model.
Next, NanoFlares were used to detect mixtures with different proportions of HSFs. To mimic clinical scenarios, a pre-determined number of unlabelled abnormal scar fibroblasts and NDFs were injected into ex vivo human skin (Supplementary Fig. 15a). Two NanoFlares (CTGF-Cy5 and GAPDH-Cy3) were simultaneously applied topically to the ex vivo skin surface with the expectation that the Cy3 signal would detect the total number of cells (HSFs, NDFs and native cells) and the Cy5 signal would quantify abnormal scar fibroblasts overexpressing CTGF. The Cy5/Cy3 signal ratio was then used to detect the proportion of HSFs to NDFs in the given skin sample. IVIS imaging was used to acquire Cy3 and Cy5 signal emission 48 h after NanoFlare application. Unmodified skin emitted minimal Cy3 (GAPDH) signal compared with all other modified skins, which expressed a similar signal to each other (Supplementary Fig. 15b). Adding 2.5 × 10⁵ HSFs to a total population of 2 × 10⁶ cells (12.5% HSFs) did not significantly increase the normalized Cy5/Cy3 signal (Supplementary Fig. 15b,c). However, when the proportion of HSFs was increased to 37.5% or above, a significant increase in signal was observed. The Cy5/Cy3 signal ratio did not significantly increase when HSFs were further increased to 100%. (Supplementary Fig. 15b,c). This demonstrated that the extent of abnormal scarring can be monitored using a dual NanoFlare strategy consisting of a disease biomarker (CTGF) normalized to the signal from an internal control (GAPDH).
Molecular diagnosis of hypertrophic scarring in a rabbit ear wound model.
NanoFlares were then extended to evaluate molecular diagnosis on a rabbit ear wound disease model for hypertrophic scarring (Fig. 7a)32. To minimize experimental bias, each group was applied to different anatomical locations of the rabbit ear by rotating the order of topical applications for each consecutive subject. Moreover, the study was performed single-blinded, with the applications and analysis workflow kept separate (see Methods for more details). Following wound closure, exuberant neodermis growth akin to hypertrophic scars was observed at the original wound location (Fig. 7b)23. Representative haematoxylin and eosin (H&E)-stained images show dermis tissue elevation (Fig. 7b, lower) compared with unwounded skin (Fig. 7b, upper). After 18 days of wound healing, NanoFlares were topically applied on the healed ear wounds (‘scars’), as well as unwounded skin (Fig. 7c). Crucially, CTGF NanoFlares fully hybridized with Oryctolagus cuniculus CTGF mRNA based on Basic Local Alignment Search Tool genetic sequence analysis (E = 9 × 10⁸), suggesting that the NanoFlare sequences directed against human cells can be applied to the rabbit model. IVIS was performed on whole rabbit ears 48 h after topical application (Fig. 7c). SCRM, CTGF and GAPDH NanoFlares had higher expression levels compared with the vehicle-only group (Fig. 7d). Higher expression levels were observed in CTGF and GAPDH scars compared with their unwounded counterparts (Fig. 7d). In particular, CTGF expression was significantly (fivefold) higher in the scars compared with the unwounded regions. GAPDH NanoFlares showed higher (2.43-fold) expression in wounds compared with unwounded skin (Fig. 7d). In Supplementary Fig. 16, higher Hoechst signals are observed in scars (both SCRM and GAPDH) compared with their unwounded counterparts, implying the propensity for higher cell numbers in scars. SCRM NanoFlares also expressed non-specific signals, whereas minimal autofluorescence was observed in unmodified skin (Supplementary Fig. 16). To avoid the interference of non-specific NanoFlare signals, a ratiometric measurement involving division of the CTGF signal from the non-specific SCRM signal was taken. Normalized CTGF expression was 3.45-fold higher in scar tissue compared with unwounded tissue (Fig. 7e). Higher CTGF expression (Cy5) in the scar tissue compared with unwounded tissue was similarly observed in the representative images (Fig. 7f). This demonstrates the capability of NanoFlares for transdermal penetration and detection of disease biomarkers (that is, CTGF) from abnormal scar cells.
Fig. 7 |. NanoFlare detection of abnormal scar cells in a rabbit ear wound model.
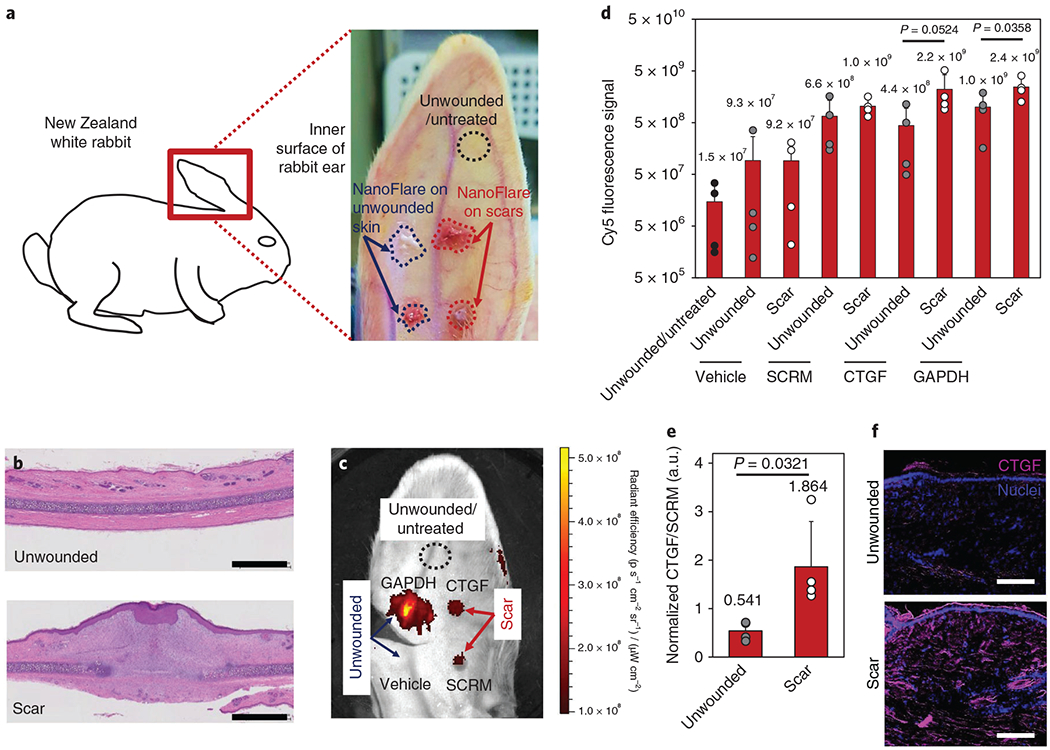
a, Schematic of the rabbit ear scar model. NanoFlares were topically applied to healed wounds (that is, scars formed following 7 mm punch biopsies) and unwounded skin. b, H&E-stained unwounded (upper) and scar (lower) ear tissue. Scale bars, 2 mm. c, Representative IVIS image of the rabbit ear showing the unwounded and untreated skin, as well as NanoFlare (CTGF, GAPDH and SCRM) and vehicle fluorescence for the scars and unwounded skin. d, Cy5 fluorescence signals obtained for different applications (CTGF, SCRM and GAPDH NanoFlares and vehicle) on scars and unwounded rabbit skin (n = 4). e, Normalized CTGF/SCRM signal in unwounded and scar regions (n = 4). f, Representative images of Cy5 through unwounded and scar sections following topical NanoFlare application. Scale bars, 100 μm. Values are means ± s.d.
The rabbit ear wound model was further used to evaluate CTGF NanoFlare diagnostic capabilities with respect to abnormal scar formation. Specifically, we sought to compare the extent of wound healing and scar tissue formation with CTGF NanoFlare signal generation, thereby identifying NanoFlare diagnostic benefit. Would healing is a process that progresses through phases of early inflammation, the formation of dermal granulation tissue and epidermal cell migration, and eventually the formation of a fully formed epidermis32. Since the wounds were not fully epithelialized until days 8–14, wounds were monitored for 18 days. CTGF, GAPDH and SCRM NanoFlares and vehicle were applied to the wounds (days 2, 6, 12 and 18) and unwounded skin (Fig. 8a). To ascertain wound evolution, tissue was excised from the wounds for histology and stained with H&E at the indicated time points (Fig. 8b and Supplementary Fig. 17a). To quantify the degree of wounding and scarring, scar elevation index (SEI) measurements were obtained by histology33. SEI measures the ratio of total scar connective tissue to the underlying dermis area, with the underlying dermis determined by the unwounded dermis height. From a value of 1 (unwounded skin), an early-stage wound (day 2) has an SEI of 0.16. The SEI value increased progressively, reaching a maximum SEI of 1.642 on day 18 when the abnormal scar was formed (Fig. 8c). Representative images showed that the CTGF signal was initially low (day 2) compared with GAPDH levels before rising 4.8-fold on day 18 (Fig. 8d). The CTGF NanoFlares signal from unwounded skin was only ~40% of the signal from wounded skin at the early stage (day 2) (Fig. 8e). In contrast, the signals from the SCRM and GAPDH NanoFlares (Fig. 8d) and the vehicle control group (Supplementary Fig. 17b) were stably expressed throughout the experimental period. The CTGF and GAPDH signals were normalized by SCRM and quantified over a period of 18 days (Fig. 8e). The CTGF NanoFlares signal gradually increased, with the greatest increase between days12 and 18 (2.7-fold). This increase in signal coincided with full skin epithelialization (>day 14). In contrast, GAPDH expression increased by 2.5-fold between days 2 and 6, exclusively during early skin epithelialization. Critically, the CTGF expression kinetics matched the trend of SEI values (R2 = 0.995; Fig. 8f) better than GAPDH, the reference gene (R2 = 0.4434; Fig. 8f). Thus, topically applied CTGF NanoFlares detected abnormal scar formation non-invasively (particularly during full skin epithelialization) and distinguished it from unwounded skin.
Fig. 8 |. Diagnosis of rabbit ear abnormal scars with CTGF NanoFlares.
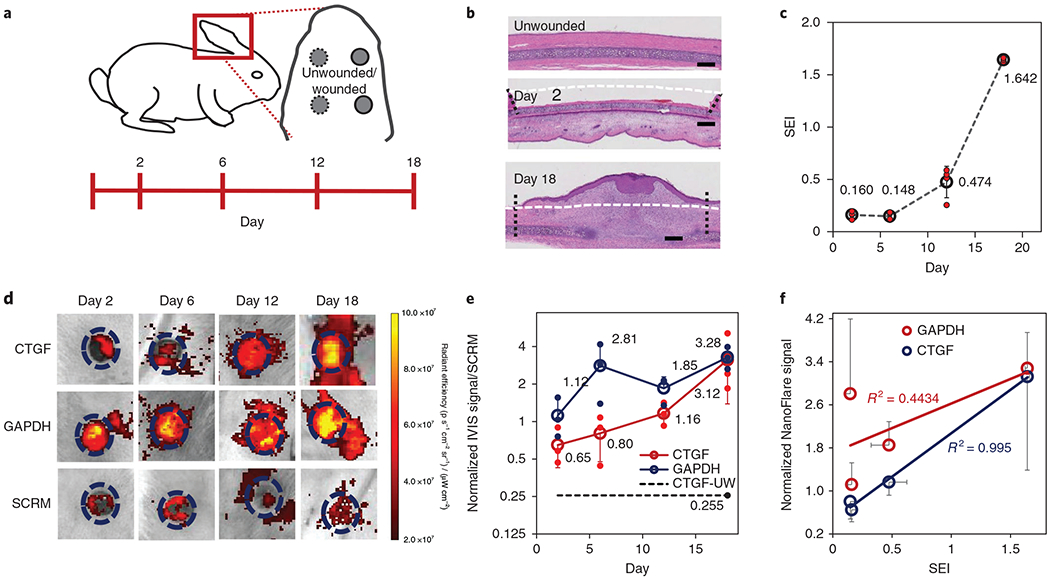
a, Schematic of the rabbit ear scar model. CTGF, GAPDH and SCRM NanoFlares and vehicle were topically applied to wounds (created by 7 mm punch biopsy) and unwounded skin on days 2, 6, 12 and 18 after wound generation. b, Representative H&E-stained histology sections for unwounded skin and wounds on days 2 and 18. Scale bars, 1 mm. Areas demarcating the wound site (vertical lines) and original tissue boundaries (horizontal line) are indicated. c, Graph of scar elevation index (SEI) with respect to time (n = 4). d, Representative IVIS images of CTGF, GAPDH and SCRM NanoFlare fluorescence on wounds for days 2, 6, 12 and 18. Dashed circle represents the boundaries of the original wound. e, Quantification of IVIS signals for the CTGF and GAPDH NanoFlares on wounds and the CTGF NanoFlare on unwounded skin (CTGF-UW), each normalized by SCRM NanoFlares, with respect to time (n = 3). f, Correlation of GAPDH and CTGF NanoFlare signals with SEI (n = 3). Values are means ± s.d.
Discussion
The gold standard for accurate diagnosis of skin diseases is from histopathology of biopsied tissue34. Apart from the invasiveness, discomfort and time-consuming nature of this procedure, biopsy into the dermis leaves scarring. Recently, we showed that SNAs readily penetrate skin to reach epidermal and dermal layers in mouse and human skin models13,15. This inspired us to explore whether SNA NanoFlares could be used to detect cutaneous disease biomarkers following topical application. As proof-of-principle, we focused on abnormal scar fibroblasts to allow testing of the detection and quantification of expression, even in the deeper dermis. To achieve this goal, three challenges were overcome: (1) identifying and validating a candidate biomarker to distinguish abnormal cells/tissue (that is, CTGF for HSFs); (2) assessing the sensitivity of NanoFlares for biomarker identification in disease; and (3) confirming that NanoFlare specificity is preserved following transepidermal penetration.
Initially, we sampled NDFs and four types of abnormal fibroblast (PKSFs, KSFs, PHSFs and HSFs) derived from (unpooled) patient cells to detect CTGF and GAPDH expression levels (Supplementary Fig. 5). CTGF expression was cell-specific (in descending order) in HSFs, PHSFs, KSFs, PKSFs and NDFs (Fig. 2b,c). When tested in cells, CTGF NanoFlares expressed approximately tenfold higher mean fluorescence intensity and eightfold more positively gated HSFs compared with NDFs (Fig. 1c). Using the fibroblasts derived from normal skin, peri-lesional skin and lesional scar tissue, the CTGF expression from NanoFlares correlated well with expression generated by qPCR assays (Fig. 2b,c), suggesting sufficient signal resolution to classify/categorize scar-derived fibroblasts using NanoFlare-assessed CTGF expression levels. In vivo testing with NanoFlares could be coupled with in vivo topical gene-silencing SNA therapy, not only for scars with SNAs directed against CTGF or TGF-β, but also for a wide variety of other genetic, metabolic, neoplastic and inflammatory skin disorders. In previous studies, topically delivered SNAs effectively silenced the epidermal growth factor receptor15, ganglioside GM3 synthase to reverse diabetic wound healing impairment in diabetic mice13, and tumour necrosis factor-α to prevent inflammatory skin disease in psoriasis mouse models;35 in these reports, penetration of human skin equivalents and abdominoplasty skin ex vivo was demonstrated.
NanoFlares faithfully detected fluctuations in CTGF levels following treatment with agonists and antagonists of TGF-β signalling. The signal magnitude increased when stimulated with excess TGF-β 1 growth factor, decreased when the TGF-β1 receptor was suppressed using siRNA, and remained unchanged when non-coding (SCRM) siRNA was introduced (Fig. 3a). This demonstrates how NanoFlares can monitor treatment progress by detecting biomarker expression levels. Having ascertained detection sensitivity, NanoFlares were further applied for drug screening (Fig. 4). They revealed that some drug candidates directly inhibit CTGF expression (that is, RepSox, rapamycin and thiazovivin), whereas other anti-scarring drugs (that is, perfenidone and decorin) do not significantly impact CTGF expression levels. This demonstrates how NanoFlares can be exploited as a facile, multiplexed non-invasive molecular biology assay for drug screening without time-consuming gene integration procedures36,37. NanoFlares were further used in ex vivo skin tissue and animal disease models. Topically applied NanoFlares on mice detected approximately eightfold higher expression of GAPDH mRNA compared with non-coding NanoFlares (SCRM). This suggests that NanoFlares readily penetrate mouse skin, generating a fluorescence signal in the presence of the corresponding mRNA (Fig. 5e,f). Due to morphological differences between mouse and human skin, abnormal scar models constituted from ex vivo human skin were used to further evaluate NanoFlare efficacy. These models involved injecting HSFs into the dermal region of full-thickness skin. For eventual clinical implementation, NanoFlares need to successfully traverse human skin epithelium. Human skin contains more epithelial skin layers than mouse skin29, which potentially impedes NanoFlare delivery. Promisingly, NanoFlares penetrated the epidermis of ex vivo human skin, diffusing throughout the dermis to a depth of ≥1.4 mm (Supplementary Fig. 11). Within skin tissue, NanoFlares retain high detection specificity, generating strong fluorescence signals in CTGF-overexpressing HSFs (Fig. 6d,e). Furthermore, CTGF NanoFlares successfully discriminate HSF-modified skin (disease phenotype), NDFs (healthy control phenotype) and Rep:HSFs (treated phenotype) (Fig. 6a–c).
Critically, topically applied NanoFlares exhibit transdermal penetration properties, retaining high detection specificity within ex vivo human tissue models. Diagnostic capability was further improved using ratiometric measures consisting of dual NanoFlares for a reference gene (GAPDH) and a functional biomarker (CTGF). Comparing the Cy5 (disease phenotype) and Cy3 (total cells) signals allows one to estimate different HSF and NDF ratios (Supplementary Fig. 15). Based on our model scar systems, a dual NanoFlare approach may allow the extent of abnormal scarring to be monitored within immature lesions or to gauge real-time responses to anti-scarring therapeutics. In the analysis, separating (deconvoluting) signal contributions from multiple fluorophores was non-trivial. The ‘spectral unmixing’ algorithm38,39 was used to objectively identify signals from individual channels (that is, Cy3 or Cy5). This methodology might result in experimental (that is, nanoparticle quenching40) or analytical artefacts (for example, analytical ‘photobleaching’38), but using larger regions of interest for signal analysis could mitigate such effects. This multi-NanoFlare approach was further demonstrated on an abnormal scar model based on wounding the inner sides of rabbits’ ears (Fig. 7). Compared with unwounded skin, wounded skin expressed higher specific rates of CTGF expression, further validating the potential of NanoFlares for clinical translation.
Using abnormal scars as a prototype disease on various preclinical models (cells, mice, viable human skin and rabbits), we have demonstrated a molecular diagnostic method for skin diseases underpinned by the molecular specificity and transdermal penetration of SNA NanoFlares. In the rabbit model, which spontaneously developed abnormal scar tissue, CTGF NanoFlares identified key events (for example, the onset of abnormal scar formation) non-invasively. In particular, good correlation (R2 = 0.995) was observed between CTGF NanoFlare expression and the SEI—a quantitative measure of abnormal scarring. This concept and its methodology can easily be extended to other skin disorders such as cancers and autoimmune/inflammatory diseases characterized by the overexpression of well-defined gene biomarkers. By identifying suitable biomarkers that discriminate between the diseased and healthy phenotypes, SNA NanoFlares with suitable gene recognition sequences can be readily designed with high specificity and sensitivity. Following topical delivery, NanoFlares may even identify the margins of skin cancers through overexpressed disease biomarkers to ensure complete tumour resection. Since remnant melanoma tissue significantly contributes to patient mortality41, NanoFlare guidance could bring about greater certainty of complete cancer tissue excision.
Outlook
Given the ease of delivering NanoFlares topically, the convenience for clinicians to assess disease status and monitor therapeutic response is increased. By extension, easy topical delivery could even enable patients to remotely self-perform certain stages of the diagnostic process, thereby alleviating the healthcare burden. In addition, NanoFlares shorten the diagnostic time compared with biopsy-based methods. Whereas histopathology is a laborious process consisting of numerous steps lasting up to 1 week and primarily measures protein levels semi-quantitatively, NanoFlares require between 24 and 48 h to fully penetrate the skin dermis and detect intracellular biomarkers. The convenience of their application and readout can drastically shorten time to diagnosis and contribute to personalized therapy based on the molecular features of lesional skin. To date, SNAs with gold nanoparticle cores have been reported to exhibit high tolerability in clinical trials42, which suggests that gold-based NanoFlare diagnostics may be readily used in humans directly. Yet, SNAs are highly versatile, permitting re-design to incorporate gold-free liposomal43 and micellar44 SNAs that have well-established clinical usage. In essence, the molecular specificity and skin-penetrating properties of SNA NanoFlares bring increased convenience and reduced diagnostic time, and potentially simplify the diagnosis of skin diseases.
Methods
NanoFlare application on ex vivo human skin.
Ex vivo human skin samples were obtained from CellResearch. Frozen samples were cut to approximately 1.5 cm × 1.5 cm, thawed, and recovered for 48 h at 37 °C under 5% CO2 in cell culture medium containing 10% foetal bovine serum. Except as otherwise stated, NanoFlares were topically applied and visualized using the same procedure as in mouse experiments. Initially, skin samples were cryo-sectioned and imaged for penetration of uptake Cy5 NanoFlares. Then, CTGF-Cy5 NanoFlare penetration on skin samples modified with membrane dye-stained (Vybrant DiI, 5 μM) NDFs, HSFs and Rep:HSFs (all 2 × 10⁶ cells) was visualized through IVIS imaging and fluorescence imaging following cryo-sectioning. Pre-gelled cell solutions were prepared as previously mentioned, and injected into the centre of the dermis region. Lastly, IVIS imaging was used to evaluate the topical co-application of CTGF-Cy5 and GAPDH-Cy3 NanoFlares on skin injected with varying numbers of HSFs (0.25, 0.75 and 2 × 10⁶ together with a corresponding number of NDFs for a total of 2 × 10⁶ cells injected per skin section). IVIS imaging was performed on at least triplicate samples of ex vivo skin and repeated unless otherwise stated.
Rabbit ear abnormal scar model.
This model has been described in greater detail previously32. Briefly, New Zealand white female rabbits were anaesthetized using ketamine (60 mg kg−1) and xylazine (5 mg kg−1) before generating wounds on the rabbit ear. Each ear received two wounds with an additional two spots serving as unwounded skin (treated with NanoFlares) and one additional spot as unwounded and untreated (NanoFlare-free). The wounds were created using a 7 mm biopsy punch (Stiefel; Fisher Scientific Singapore), with flesh stripped to the cartilage base on the ventral side of the ear. Care was taken to ensure complete removal of the epidermis, dermis and perichondrium. Any signs of bleeding were treated with manual compression.
To minimize the likelihood of experimental bias, randomization and single-blinding was implemented in the study. To remove variability from individual wounds as a result of anatomical location, the topical applications (CTGF, GAPDH and SCRM NanoFlares and vehicle) were assigned to wounded and unwounded spots numbered 1–4. The sequence of applications (C, G, S, V) was matched to the spot number (corresponding to a fixed location) for each ear. For every subsequent ear, the order of topical application was rotated clockwise and paired to the corresponding spot (for example ear 1: C1, ear 2: V1, ear 3: S1, and so on). Overall, topical applications were equally distributed throughout the different ear anatomical locations. To further reduce experimental bias, single-blinding was implemented. Topical applications was performed by investigator 1, who was kept separate from the image acquisition workflow. The harvested ears were imaged by investigator 2, who collected the raw data and performed the analysis. Thereafter, the identity of the various groups was revealed by investigator 1 and matched with the experimental data.
The wounds were left to heal naturally for 2, 6, 12 or 18 days. Excess neodermis tissue was formed, which gave rise to the appearance of an abnormal scar. On the four spots (two wounded and two unwounded), NanoFlares were topically applied with either CTGF, GAPDH, SCRM or vehicle. Then, 48 h later, the rabbits were euthanized and the entire ear was harvested for fluorescence imaging using an IVIS SpectrumCT system (PerkinElmer). To quantify the signal generated from CTGF and GAPDH NanoFlares, acquired signals were divided by the SCRM (non-coding) NanoFlare signal. This assumes that expression levels were proportional to the number of cells present. The site of the original wound was harvested and stained with H&E. The field of view, which covered the entire rabbit ear (13.6 cm), height distance and optical gain were kept constant throughout the measurement and visualized using the same procedure in mouse and human experiments. At the end, the averaged Cy5 fluorescence intensity from each region of interest was recorded. IVIS imaging was performed on quadruplicate rabbit subjects and repeated.
All animal experiments were approved by the Institutional Animal Care and Use Committees (IACUCs: #BN16098) of Nanyang Technological University, Singapore.
Wound and scar elevation evaluation.
Wounds and scars were evaluated by harvesting ear tissue at the indicated time points (days 2, 6, 12 and 18). Briefly, the experiments involved immediately fixing tissue in neutral buffered formalin (10%) for 48 h before paraffin block mounting and sectioning for histology. Tissue sections were stained with H&E before imaging. The SEI measurements were obtained by measuring the ratio of the scar connective tissue area to the area of underlying dermis. Values > 1, 1 and < 1 indicated abnormal scar formation, no new tissue formation and an epithelial gap/ingrowth, respectively.
Statistical analysis.
Statistical tests (t-tests or one-way analysis of variance (ANOVA)) were carried out to obtain P value significance. Microsoft Excel was used to perform the t-tests. A suitable post-hoc test was chosen using the IBM SPSS Statistics 22 software. Alternatively, a one-way ANOVA with post-hoc analysis was performed using a web-based statistics calculator from http://astatsa.com/OneWay_Anova_with_TukeyHSD/.
Reporting Summary.
Further information on experimental design is available in the Nature Research Reporting Summary linked to this article.
Supplementary Material
Acknowledgements
This work was supported by the NTU-Northwestern Institute for Nanomedicine. We thank G. Yu (current location: Nanjing University of Posts and Telecommunications, China) for assistance with animal handling.
Footnotes
Competing interests
A patent application based on the reported data has been filed. C.A.M. is a cofounder of Aurasense (the company that co-developed and licensed the NanoFlare technology to Merck-Millipore, which produced over 1,600 commercial versions of NanoFlares sold under the trade name SmartFlares).
Supplementary information is available for this paper at https://doi.org/10.1038/s41551-018-0218-x.
Data availability.
The authors declare that all data supporting the findings of this study are available within the paper and its Supplementary Information.
References
- 1.Van de Vijver MJ et al. A gene-expression signature as a predictor of survival in breast cancer. N. Engl. J. Med 347, 1999–2009 (2002). [DOI] [PubMed] [Google Scholar]
- 2.Yao M et al. Gene expression analysis of renal carcinoma: adipose differentiation-related protein as a potential diagnostic and prognostic biomarker for clear-cell renal carcinoma. J. Pathol 205, 377–387 (2005). [DOI] [PubMed] [Google Scholar]
- 3.Zakrewsky M, Kumar S & Mitragotri S Nucleic acid delivery into skin for the treatment of skin disease: proofs-of-concept, potential impact, and remaining challenges. J. Control. Release 219, 445–456 (2015). [DOI] [PMC free article] [PubMed] [Google Scholar]
- 4.Prigodich AE et al. Multiplexed nanoflares: mRNA detection in live cells. Anal. Chem 84, 2062–2066 (2012). [DOI] [PMC free article] [PubMed] [Google Scholar]
- 5.Halo TL et al. NanoFlares for the detection, isolation, and culture of live tumor cells from human blood. Proc. Natl Acad. Sci. USA 111, 17104–17109 (2014). [DOI] [PMC free article] [PubMed] [Google Scholar]
- 6.Giljohann DA et al. Gold nanoparticles for biology and medicine. Angew. Chem. Int. Ed 49, 3280–3294 (2010). [DOI] [PMC free article] [PubMed] [Google Scholar]
- 7.Chinen AB et al. Nanoparticle probes for the detection of cancer biomarkers, cells, and tissues by fluorescence. Chem. Rev 115, 10530–10574 (2015). [DOI] [PMC free article] [PubMed] [Google Scholar]
- 8.Yang Y et al. FRET nanoflares for intracellular mRNA detection: avoiding false positive signals and minimizing effects of system fluctuations. J. Am. Chem. Soc 137, 8340–8343 (2015). [DOI] [PubMed] [Google Scholar]
- 9.Lahm H et al. Live fluorescent RNA-based detection of pluripotency gene expression in embryonic and induced pluripotent stem cells of different species. Stem Cells 33, 392–402 (2015). [DOI] [PubMed] [Google Scholar]
- 10.Choi CHJ, Hao L, Narayan SP, Auyeung E & Mirkin CA Mechanism for the endocytosis of spherical nucleic acid nanoparticle conjugates. Proc. Natl Acad. Sci. USA 110, 7625–7630 (2013). [DOI] [PMC free article] [PubMed] [Google Scholar]
- 11.Wu XA, Choi CHJ, Zhang C, Hao L & Mirkin CA Intracellular fate of spherical nucleic acid nanoparticle conjugates. J. Am. Chem. Soc 136, 7726–7733 (2014). [DOI] [PMC free article] [PubMed] [Google Scholar]
- 12.Jensen SA et al. Spherical nucleic acid nanoparticle conjugates as an RNAi-based therapy for glioblastoma. Sci. Transl. Med 5, 209ra152 (2013). [DOI] [PMC free article] [PubMed] [Google Scholar]
- 13.Randeria PS et al. siRNA-based spherical nucleic acids reverse impaired wound healing in diabetic mice by ganglioside GM3 synthase knockdown. Proc. Natl Acad. Sci. USA 112, 5573–5578 (2015). [DOI] [PMC free article] [PubMed] [Google Scholar]
- 14.Sita TL et al. Dual bioluminescence and near-infrared fluorescence monitoring to evaluate spherical nucleic acid nanoconjugate activity in vivo. Proc. Natl Acad. Sci. USA 114, 4129–4134 (2017). [DOI] [PMC free article] [PubMed] [Google Scholar]
- 15.Zheng D et al. Topical delivery of siRNA-based spherical nucleic acid nanoparticle conjugates for gene regulation. Proc. Natl Acad. Sci. USA 109, 11975–11980 (2012). [DOI] [PMC free article] [PubMed] [Google Scholar]
- 16.Alster TS & Tanzi EL Hypertrophic scars and keloids: etiology and management. Am. J. Clin. Dermatol 4, 235–243 (2003). [DOI] [PubMed] [Google Scholar]
- 17.Gold MH et al. Updated international clinical recommendations on scar management: part 2—algorithms for scar prevention and treatment. Dermatol. Surg. 40, 825–831 (2014). [DOI] [PubMed] [Google Scholar]
- 18.Wolfram D, Tzankov A, Pülzl P & Piza-Katzer H Hypertrophic scars and keloids—a review of their pathophysiology, risk factors, and therapeutic management. Dermatol. Surg. 35, 171–181 (2009). [DOI] [PubMed] [Google Scholar]
- 19.Sarrazy V, Billet F, Micallef L, Coulomb B & Desmoulière A Mechanisms of pathological scarring: role of myofibroblasts and current developments. Wound Repair Regen. 19, s10–s15 (2011). [DOI] [PubMed] [Google Scholar]
- 20.Van der Veer WM et al. Potential cellular and molecular causes of hypertrophic scar formation. Burns 35, 15–29 (2009). [DOI] [PubMed] [Google Scholar]
- 21.Grotendorst GR Connective tissue growth factor: a mediator of TGF-beta action on fibroblasts. Cytokine Growth Factor Rev. 8, 171–179 (1997). [DOI] [PubMed] [Google Scholar]
- 22.Leask A & Abraham DJ TGF-beta signaling and the fibrotic response. FASEB J. 18, 816–827 (2004). [DOI] [PubMed] [Google Scholar]
- 23.Wang YW et al. siRNA-targeting transforming growth factor-beta type I receptor reduces wound scarring and extracellular matrix deposition of scar tissue. J. Investig. Dermatol. 134, 2016–2025 (2014). [DOI] [PubMed] [Google Scholar]
- 24.Zhang Z et al. Recombinant human decorin inhibits TGF-β1-induced contraction of collagen lattice by hypertrophic scar fibroblasts. Burns 35, 527–537 (2009). [DOI] [PubMed] [Google Scholar]
- 25.Wong VW, You F, Januszyk M, Gurtner GC & Kuang AA Transcriptional profiling of rapamycin-treated fibroblasts from hypertrophic and keloid scars. Ann. Plast. Surg. 72, 711–719 (2014). [DOI] [PMC free article] [PubMed] [Google Scholar]
- 26.Armendariz-Borunda J et al. A controlled clinical trial with pirfenidone in the treatment of pathological skin scarring caused by burns in pediatric patients. Ann. Plast. Surg. 68, 22–28 (2012). [DOI] [PubMed] [Google Scholar]
- 27.Ichida JK et al. A small-molecule inhibitor of TGF-beta signaling replaces sox2 in reprogramming by inducing nanog. Cell. Stem Cell. 5, 491–503 (2009). [DOI] [PMC free article] [PubMed] [Google Scholar]
- 28.Lin T et al. A chemical platform for improved induction of human iPSCs. Nat. Methods 6, 805–808 (2009). [DOI] [PMC free article] [PubMed] [Google Scholar]
- 29.Nestle FO, Di Meglio P, Qin JZ & Nickoloff BJ Skin immune sentinels in health and disease. Nat. Rev. Immunol. 9, 679–691 (2009). [DOI] [PMC free article] [PubMed] [Google Scholar]
- 30.Kua EHJ, Goh CQ, Ting Y, Chua A & Song C Comparing the use of glycerol preserved and cryopreserved allogenic skin for the treatment of severe burns: differences in clinical outcomes and in vitro tissue viability. Cell Tissue Bank. 13, 269–279 (2012). [DOI] [PubMed] [Google Scholar]
- 31.Pasyk KA, Argenta LC & Hassett C Quantitative analysis of the thickness of human skin and subcutaneous tissue following controlled expansion with a silicone implant. Plast. Reconstr. Surg 81, 516–523 (1988). [DOI] [PubMed] [Google Scholar]
- 32.Kloeters O, Tandara A & Mustoe TA Hypertrophic scar model in the rabbit ear: a reproducible model for studying scar tissue behavior with new observations on silicone gel sheeting for scar reduction. Wound Repair Regen. 15, S40–S45 (2007). [DOI] [PubMed] [Google Scholar]
- 33.Yeo DC, Balmayor ER, Schantz J-T & Xu C Microneedle physical contact as a therapeutic for abnormal scars. Eur. J. Med. Res 22, 28 (2017). [DOI] [PMC free article] [PubMed] [Google Scholar]
- 34.Sellheyer K & Bergfeld WF A retrospective biopsy study of the clinical diagnostic accuracy of common skin diseases by different specialties compared with dermatology. J. Am. Acad. Dermatol. 52, 823–830 (2005). [DOI] [PubMed] [Google Scholar]
- 35.Lewandowski KT et al. Topically delivered tumor necrosis factor-α-targeted gene regulation for psoriasis. J. Investig. Dermatol. 137, 2027–2030 (2017). [DOI] [PMC free article] [PubMed] [Google Scholar]
- 36.Avior Y, Sagi I & Benvenisty N Pluripotent stem cells in disease modelling and drug discovery. Nat. Rev. Mol. Cell Biol 17, 170–182 (2016). [DOI] [PubMed] [Google Scholar]
- 37.Choi SM et al. Efficient drug screening and gene correction for treating liver disease using patient-specific stem cells. Hepatology 57, 2458–2468 (2013). [DOI] [PMC free article] [PubMed] [Google Scholar]
- 38.Gammon ST, Leevy WM, Gross S, Gokel GW & Piwnica-Worms D Spectral unmixing of multicolored bioluminescence emitted from heterogeneous biological sources. Anal. Chem. 78, 1520–1527 (2006). [DOI] [PMC free article] [PubMed] [Google Scholar]
- 39.Beziere N et al. Dynamic imaging of PEGylated indocyanine green (ICG) liposomes within the tumor microenvironment using multi-spectral optoacoustic tomography (MSOT). Biomaterials 37, 415–424 (2015). [DOI] [PubMed] [Google Scholar]
- 40.Vujačić A et al. Fluorescence quenching of 5,5’-disulfopropyl-3,3’-dichlorothiacyanine dye adsorbed on gold nanoparticles. J. Phys. Chem. C 117, 6567–6577 (2013). [Google Scholar]
- 41.Hayes AJ et al. Wide versus narrow excision margins for high-risk, primary cutaneous melanomas: long-term follow-up of survival in a randomised trial. Lancet Oncol 17, 184–192 (2016). [DOI] [PMC free article] [PubMed] [Google Scholar]
- 42.Anselmo AC & Mitragotri S Nanoparticles in the clinic. Bioeng. Transl. Med. 1, 10–29 (2016). [DOI] [PMC free article] [PubMed] [Google Scholar]
- 43.Banga RJ, Chernyak N, Narayan SP, Nguyen ST & Mirkin CA Liposomal spherical nucleic acids. J. Am. Chem. Soc. 136, 9866–9869 (2014). [DOI] [PMC free article] [PubMed] [Google Scholar]
- 44.Banga RJ et al. Cross-linked micellar spherical nucleic acids from thermoresponsive templates. J. Am. Chem. Soc. 139, 4278–4281 (2017). [DOI] [PMC free article] [PubMed] [Google Scholar]
Associated Data
This section collects any data citations, data availability statements, or supplementary materials included in this article.
Supplementary Materials
Data Availability Statement
The authors declare that all data supporting the findings of this study are available within the paper and its Supplementary Information.