

Abstract
Renal echo planar diffusion tensor imaging (DTI) has clinical potential but suffers from geometric distortion. We evaluated feasibility of reversed gradient distortion correction in 10 diabetic patients and 6 volunteers. Renal area, apparent diffusion coefficient, fractional anisotropy, and tensor eigenvalues were measured on uncorrected and distortion-corrected DTI. Corrected DTI correlated better than uncorrected DTI (r = 0.904 vs 0. 840, P = 0.002) with reference anatomic T2-weighted imaging, with no significant difference in DTI metrics.
Keywords: distortion correction, diffusion imaging, reversed gradient
Diffusion tensor imaging (DTI) is emerging as a useful technique for structural and functional evaluation of the kidneys. It provides quantitative and directional information on the Brownian motion of water molecules in vivo, as reflected by the parameters’ apparent diffusion coefficient (ADC) and fractional anisotropy (FA), respectively.1 These parameters are altered by microstructural changes within the kidney, which is normally highly ordered because of the presence of numerous radially oriented tubules, collecting ducts and vessels, with greater structural order in the renal medulla than the cortex. Multiple studies have demonstrated feasibility of DWI and DTI biomarkers in detecting and characterizing various lesions and diseases within native as well as transplant kidneys.1–3 In chronic renal disease, progressive cortical interstitial fibrosis results in restricted water diffusion and can be detected as a decrease in renal ADC.4–7 Loss of the normal ordered microstructure can also be detected as a decrease in FA.8 At a later stage, loss of renal parenchyma becomes severe enough to be detected as a decrease in renal volume on magnetic resonance imaging (MRI)9 or other imaging modalities. Fractional anisotropy and ADC have the potential to be more sensitive imaging biomarkers than conventional serum and urine biomarkers and if validated, may aid early detection of disease and potentially decrease the need for invasive renal biopsies.10,11
Echo-planar imaging (EPI) is frequently used to perform DTI because it allows relatively rapid image acquisition within a time frame of 100 ms or less, minimizing motion artifact for a given slice.12 Unfortunately, because of the low bandwidth in the phase-encoding direction, EPI is extremely sensitive to inhomogeneities in the magnetic field, which can cause severe spatial and intensity distortion.1,13,14 Field inhomogeneities arise from multiple sources including scanner imperfections and subject-specific susceptibility variations (for example, gas-tissue interfaces within the lung bases or gastrointestinal tract). The result is artefactual warping of the image most pronounced in the phase-encoding direction. This artifact can be managed with distortion correction to preserve magnetic resonance (MR) image quality and allow accurate coregistration between DWI and anatomical images. This is especially important in the kidney because it allows separate ADC and FA measurements to be obtained from the renal cortex and medulla. Second, accurate anatomical coregistration is crucial in the evaluation of focal renal lesions, such as pyelonephritis, complicated cysts, or tumors. In prior studies, several techniques have been used to reduce susceptibility artifact during acquisition by reducing the readout time/echo train length. These include parallel imaging (generalized autocalibrating partially parallel acquisitions),15 multishot EPI (readout-segmented EPI),7 and spatially selective or “zoomed” EPI.16 However, postacquisition distortion correction offers an alternate strategy, particularly if readout segmented or spatially selective techniques are not available.
Different approaches have been proposed to perform reliable and efficient distortion correction. An early and widely used approach is the field map method17 in which a map of the background field inhomogeneity is calculated based on phase differences between a pair of conventional gradient echo images. This approach is highly susceptible to motion artifact as the gradient echo images require several minutes of acquisition time. Several more advanced techniques have subsequently been described and have shown high accuracy in distortion correction in EPI of the brain.18–22 One of the fastest and most robust techniques is the “reversed gradient” method which exploits the fact that if the phase-encoding gradients are reversed in polarity, then distortions due to field inhomogeneity will be precisely reversed.13,21,22 In this method the undistorted image is calculated from 2 EPI images acquired with the phase-encoding gradient in opposite directions. The additional reversed-direction phase-encoding sequence can be rapidly acquired and postprocessed. Beyond neuroimaging, the technique has been described for breast23 and prostate24 imaging, and there is recent healthy volunteer experience in the kidneys.25 However, experience in patients has not previously been reported. Renal distortion correction is challenging to perform due to respiratory motion and multiple adjacent gas-containing viscera that contribute to susceptibility artifact.
In this study, we evaluate the feasibility and efficacy of the reversed gradient distortion correction method for DTI of the kidneys acquired with an echo planar readout in healthy volunteers and patients with type 1 diabetes, hypothesizing that renal area measurements derived from distortion corrected DTI will correlate better with anatomic imaging than uncorrected DTI. We also examine the effect of distortion correction on the parameters ADC, FA, and tensor eigenvalues (λ1, λ2, and λ3), hypothesizing that distortion correction will not significantly alter renal DTI metrics.
MATERIALS AND METHODS
Subjects
Imaging was performed on patients and healthy volunteers enrolled in a single-center clinical trial of renal MRI of patients with type 1 diabetes and healthy volunteers, with institutional ethics approval, and informed consent obtained from all subjects. Inclusion criteria for the trial were age (18 years or older), for healthy volunteers, no known history of cardiovascular or renal disease, and for patients, an established clinical diagnosis of type 1 diabetes mellitus (T1DM). The only relevant exclusion criterion was any absolute or relative contraindication to MRI (including pregnancy).
Ten patients with T1DM (6 men/4 women; mean age, 44 years [range, 19–62 years]) and 6 healthy volunteers (3 men/3 women; mean age, 44 years [range, 28–63 years]) were included in this study. The mean estimated glomerular filtration rate (eGFR) of the diabetic patients was 84 mL/min per 1.73 m2 (range, 55–91 mL/min per 1.73 m2), estimated from standard serum collection using the Modification of Diet in Renal Disease (MDRD) equation. The mean estimated glomerular filtration rate (eGFR) of the healthy volunteers (with no history of cardiac, renal, or respiratory disease) was 84 mL/min per 1.73 m2 (range, 66–91 mL/min per 1.73 m2). In total, 32 kidneys were studied. All subjects were fasted for the examination with controlled water intake before MR imaging to standardize hydration status. An endocrinologist (J.S., anonymized for review) was present to manage serum glucose for all patient visits.
Image Acquisition
The MR images were obtained using a 3-T system (Skyra; Siemens Healthineers, Erlangen, Germany) over a 12-month period. The clinical trial protocol included a DTI sequence with the following parameters: repetition time (TR)/echo time (TE), 1800/81 ms; field of view (FOV), 400 × 400 mm2; matrix, 340 × 340; slice thickness, 3 mm; 7 slices; b values 0 and 500 s/mm2 in 12 directions and 4 averages with a feet-to-head phase-encode direction and spin-echo EPI readout in oblique coronal orientation, and respiratory bellows for respiratory compensation. A feet-to-head phase encode direction was selected based on prior experience by Notohamiprodjo et al,26 who reported that this orientation preserved bilateral symmetry and minimized overlap with adjacent organs. In addition, an acquisition with identical parameters but a reversed head-to-feet phase-encode direction and a single b value of 0 s/mm2 was performed. The additional scan time from the reversed (head-to-feet) acquisition was approximately 30 to 40 seconds per subject. For anatomical correlation, expiratory phase breath-hold (matching the respiratory gated acquisition) T2-weighted Half-Fourier Acquisition Single-shot Turbo spin Echo imaging (HASTE) images [T2WI] were obtained covering the full extent of the kidneys with the following parameters: repetition time (TR)/echo time (TE), 1000/95 ms; field of view (FOV), 420 × 420 mm2; matrix, 640 × 640; slice thickness, 5 mm in identical orientation, with an identical center slice.
Image Postprocessing
All images were anonymized before review by a nonreader author (S.F. anonymized for review). Geometric distortion correction was performed using the reversed gradient method described in Holland et al13 (Fig. 1), using the Computational Morphometry Toolkit (https://www.nitrc.org/projects/cmtk) (Menlo Park, CA). An additional step was necessary before distortion correction for many subjects, related to use of a feet-to-head phase-encode direction for the complete DTI acquisition. This resulted in artefactual elongation of the kidney (and compression in the reversed head-to-feet b0 image) in the phase encoding (PE) direction as depicted in Figure 1. As a result, the stomach had to frequently be masked out of the images before distortion correction because of the significant artifact affecting the left kidney.
FIGURE 1.
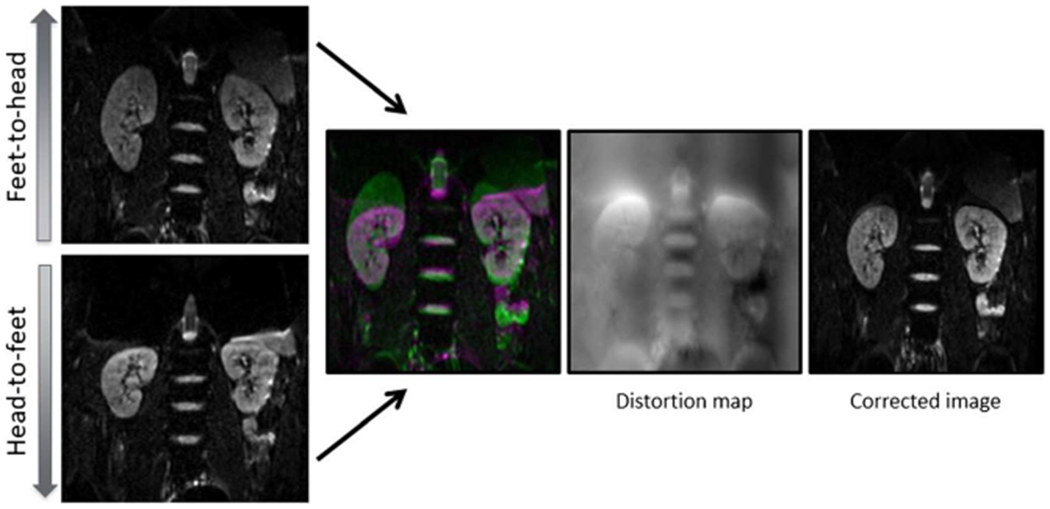
Pictorial representation of the reversed gradient method for distortion correction. The same slice of anatomy is acquired twice with the phase-encoding gradient set in opposite directions (note that the kidneys are elongated on the feet-to-head acquisition and shortened on the head-to-feet acquisition). A distortion map is calculated by comparing the 2 b0 images, using the algorithm described in the text. This map can then be applied to the entire DTI data set. Figure 1 can be viewed online in color at www.jcat.org.
For each subject, an experienced abdominal radiologist (R1, R.P.L., anonymized for review) with over 10 years body MR experience first selected a single representative slice from the T2WI HASTE sequence and a matching slice on the DTI data sets. The slice was chosen to include the longest craniocaudal dimension of both kidneys in the anterior-posterior direction. The same radiologist then segmented each kidney on the selected T2WI slice, including cortex and medulla, but excluding the renal pelvis, as the reference standard area for each kidney. After at least a 2-week period, whole kidney segmentation of the uncorrected and corrected DTI data sets was performed independently by the experienced abdominal radiologist and an inexperienced radiology trainee (R2, J.C.L., anonymized for review) with 0 years’ experience reading body MRI, after a training session by the senior reader. All segmentation was manually performed using an in-house program created in Matlab R2015b (The MathWorks, Natick, MA). The DTI parametric maps, including ADC, FA, and λ1, λ2 and λ3 eigenvalues, were calculated for both uncorrected and corrected diffusion series (Fig. 2) in Matlab.
FIGURE 2.
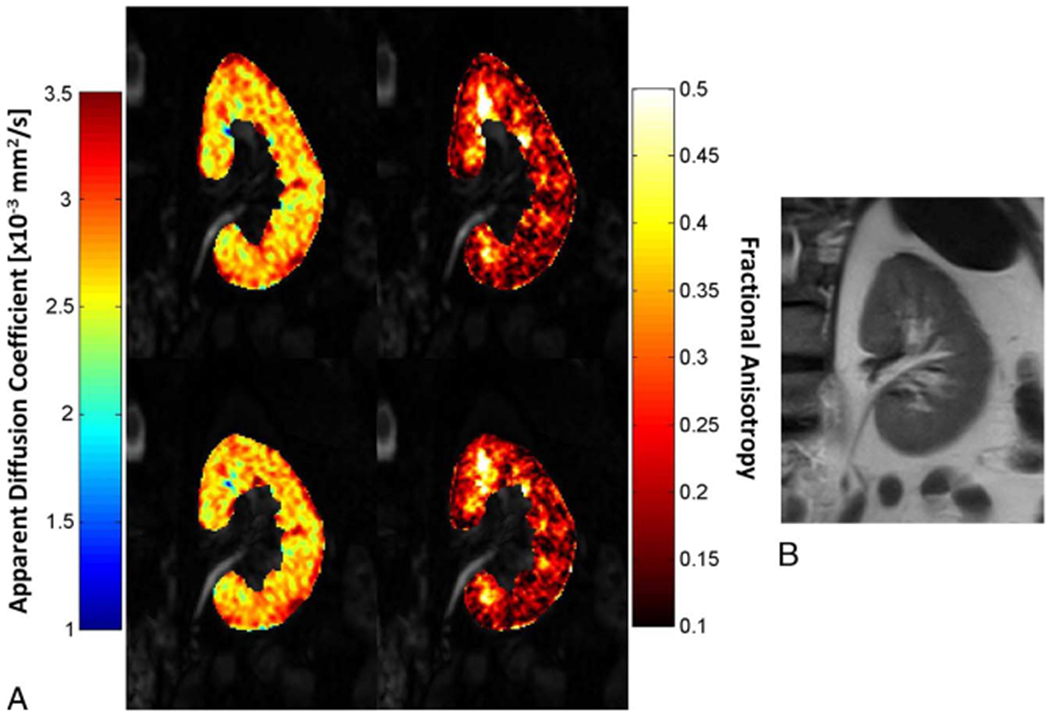
A, The ADC and FA parametric maps of the left kidney for 1 patient with type 1 diabetes (50-year-old man) before correction (top), and after correction (bottom) overlaid over DTI b0 images. B, Corresponding T2WI slice. Figure 2 can be viewed online in color atwww.jcat.org.
Statistical Analysis
The segmented renal areas from T2WI, corrected and uncorrected DTI sequences, were compared using Pearson correlation and the paired Wilcoxon signed-rank test. Intraclass correlation between the readers was also assessed. The DTI parameters (FA, ADC, eigenvalues) obtained (using the same whole-kidney segmented ROI for all parameters) separately from uncorrected and corrected DTI data sets were compared using the paired t test after the Kolmogorov-Smirnov test demonstrating normally distributed data. A P value less than 0.05 was considered significant unless adjustment for multiple comparisons (Bonferroni method) was applied. Statistical analysis was performed using SPSS Statistics for Windows, Version 21.0 (IBM, Chicago, IL).
RESULTS
Geometric distortion correction was successfully performed in all cases. Median and interquartile ranges of renal areas segmented on T2-weighted, uncorrected b0, and corrected b0 images are presented in Table 1.
TABLE 1.
Median [Interquartile Range] of the Renal Areas Segmented on Each Sequence Divided by Reader and Laterality
| Left Kidney |
Right Kidney |
|||
|---|---|---|---|---|
| Senior Reader | Junior Reader | Senior Reader | Junior Reader | |
| T2-weighted HASTE | 40.85 [27.35–46.80] | N/A | 38.40 [28.54–58.97] | N/A |
| Uncorrected DTI b0 | 44.09 [30.89–56.66] | 43.86 [30.63–57.56] | 42.78 [27.67–60.89] | 40.55 [30.19–63.86] |
| Corrected DTI b0 | 39.25 [30.99–49.79] | 41.89 [31.16–49.79] | 36.70 [25.90–64.03] | 39.29 [27.88–65.67] |
All results expressed in cm2.
N/A indicates not applicable.
There was no significant difference in renal area between T2-weighted and corrected b0 images (P > 0.2 for both readers). However, there were significant differences between the uncorrected b0 and T2-weighted images, and between uncorrected and corrected b0 images (P < 0.01 for both readers). The Pearson correlation coefficient between segmented area on T2-weighted and corrected b0 images was higher (r = 0.904 for the experienced reader, r = 0.910 for the inexperienced reader) than the correlation between the area segmented in T2-weighted and uncorrected b0 images (r = 0.840, r = 0.837). Figure 3 presents a scatter/boxplot comparing the segmented renal areas obtained by the experienced reader on T2-weighted, uncorrected b0 and corrected b0 images.
FIGURE 3.

Scatter/boxplot showing the area segmented by the experienced reader for the 32 kidneys on the 3 sequences. Median (solid line). Mean (dashed line). Pearson correlation between T2WI and uncorrected b0 was r = 0.840; between T2WI and corrected b0 was r = 0.904. Figure 3 can be viewed online in color atwww.jcat.org.
Excellent agreement was found between both readers with an intraclass correlation coefficient of 0.97 and 0.98 for renal areas on the uncorrected b0 and corrected b0 images, respectively.
The median and interquartile ranges of the DTI parametric maps for all cases are presented in Table 2 using the experienced reader’s segmentation. No significant difference was found between DTI parameters on the uncorrected and corrected images (P > 0.05 for all cases).
TABLE 2.
Median [Interquartile Range] of the DTI Parameters Obtained for Each Kidney
| ADC (mm2/s) | FA | λ1 | λ2 | λ3 | |
|---|---|---|---|---|---|
| Uncorrected DTI | 2.44 [2.18–2.73] | 0.20 [0.14–0.26] | 2.99 [2.46–3.35] | 2.34 [2.15–2.64] | 1.98 [1.70–2.27] |
| Corrected DTI | 2.40 [2.16–2.73] | 0.20 [0.14–0.27] | 2.97 [2.46–3.35] | 2.31 [2.12–2.63] | 1.98 [1.65–2.27] |
DISCUSSION
After distortion correction with the “reversed gradient” method, our results show a higher agreement between the area segmented on T2WI, the anatomic reference standard, and the area segmented on corresponding slices in the corrected DTI series. Visually, there was noticeably closer correlation between the corrected images and the higher resolution anatomical images (Fig. 4). This is in contrast to the uncorrected DTI series, where the renal area was significantly different from the reference standard. Hence, this method of distortion correction increases the accuracy of coregistration between DTI series and higher resolution anatomical images. An additional benefit of this method is that it should also correct for some of the in-plane intensity distortion that occurs due to magnetic field inhomogeneity, although this was not explicitly assessed.
FIGURE 4.

Single slice segmentation from a representative subject. A, Uncorrected DTI b0 image (head-to-feet PE direction) with left kidney ROI (blue). B, Corrected DTI b0 image with left kidney ROI (yellow). C, Anatomic T2 weighted image overlaid with ROIs from A and B. Figure 4 can be viewed online in color at www.jcat.org.
Our results also demonstrate that the ADC, FA, and eigenvalues derived from DTI were not significantly affected by the distortion correction process in our cohort, which included both healthy volunteers and patients with T1DM without established renal disease. This is important in validating the clinical applicability of the reversed gradient method and is concordant with findings from a recent study, which proposed incorporating the reversed gradient method into a standardized DTI postprocessing pipeline.25 The ADC values obtained in this study are in line with published results in the literature.12 For instance, 1 study reported bilateral mean renal ADC of 2.33 ± 0.09 (× 10−3 mm2/s),27 and another reported renal parenchymal ADC of 2.32 ± 0.07 averaged from cortical and medullary ROIs.28 Notably, the FA obtained in this study is slightly lower than reported in the literature (0.22 ± 0.04 in the cortex, 0.34 ± 0.08 in the medulla).12 This difference may be attributable to multiple factors, such as acquisition parameters (recent efforts have been made to standardize these to facilitate comparison of results across studies12), the single compartment nature of our segmentation, variability in ROI placement, or even potentially a true decrease in FA in the setting of diabetic kidney disease, which has been reported in previous studies,28,29 although conflicting results have also been reported.11
In this study, we performed additional motion compensation by using respiratory bellows for triggering of the DTI acquisitions, permitting free breathing during the scan. An alternative would have been to use a breath-hold acquisition, which is highly dependent on patient cooperation and limits the total achievable scan time at the expense of signal to noise ratio (SNR). Breath-holding was used for the single anatomical T2WI sequence but not for DTI, because this would require prohibitively long breath-holds or multiple breath-holds for matched diffusion directions and b values, leading to image misregistration. As an example, a previous renal DTI study reported a breath-hold duration of 26 seconds despite using generalized autocalibrating partially parallel acquisitions15 to shorten the acquisition time.30 Although our healthy volunteers and relatively well T1DM patients may have tolerated this breath-hold duration, in the clinical setting, it would be intolerable for many patients with renal disease, who are vulnerable to fluid overload and often have other medical comorbidities contributing to dyspnea.
The need to mask out the stomach before distortion correction increased postprocessing time and required further manual input that might impact reproducibility. One alternative approach would be to obtain the DTI acquisition with PE in the left-right direction, as has been reported in other studies.25,31,32 More recently, small field-of-view or “zoomed” EPI is an alternative sequence to consider for renal DTI, using a spatially selective excitation to exclude unwanted structures, including much of the stomach from the field of view.16 Similarly, multishot readout-segmented EPI could also minimize geometric distortion, but with the downside of longer imaging time and greater sensitivity to motion artifacts.7 The latter 2 sequences were not available on the scanner on which the study was performed.
Our study has a number of limitations. First, the small sample size limits its statistical power, which is relevant in detecting significant change to the DTI biomarkers as discussed above. However, the sample size is similar to previously published renal DTI studies.25,26 Another limitation is that the DTI and T2WI sequences were acquired using different slice thicknesses, which may have reduced the correlation between the measured renal slices. The impact of this is likely to be small, as very high correlation was observed between the corrected DTI and T2WI renal areas.
Our dependence on manual segmentation may also impact the reproducibility of the technique. The presence of various nonrenal structures, including vessels, cysts, and other lesions, complicates manual segmentation. Note that this limitation is not unique to our study, because renal segmentation is a necessary step in obtaining a whole range of potential imaging biomarkers, such as renal volume, tissue R2*, perfusion, and diffusion metrics. Despite the growing number of published studies in this field, segmentation has yet to be fully automated.1,12,25
In this study, distortion correction and segmentation were only performed on 1 selected slice as the DTI protocol did not cover the whole kidney because of time constraints. The method can be extrapolated to include multiple slices to obtain whole kidney coverage. Furthermore, we extracted parenchymal biomarkers for an entire renal slice as a single compartment. These biomarkers do have the potential for clinical use—for example, mean renal ADC has been shown to correlate with the presence as well as clinical stage of diabetic kidney disease.27,28 However, obtaining biomarkers separately from the renal cortex and medulla may provide even higher accuracy in detecting and staging diabetic kidney disease.1,11 Hence, 1 direction for further study would be to evaluate the impact of this distortion correction method on DTI biomarkers obtained separately from the renal cortex and medulla. Another avenue for further study would be to consider the impact of distortion correction on renal tractography, which is still in its infancy as a clinical application.2,26,30,33,34 While a recent article has reported that renal tractography may benefit from the distortion correction method used in our study,25 robust quantitative evaluation with a larger sample size remains necessary.
Renal diffusion-weighted MRI is increasingly recognized as a valuable source of imaging biomarkers, which can aid in disease detection and clinical decision making. However, it is vulnerable to image distortion due to susceptibility artifact, particularly with a single-shot echo planar readout. In our experience, we found that reversed gradient distortion correction was feasible for single-shot EPI DTI of the kidneys, with good correlation to anatomic imaging and no significant impact on DTI metrics obtained from a single slice whole-kidney ROI.
Acknowledgments
Grant support for this project was received from the Diabetes Australia Research Trust.
EIE’s institution has received research funding from Bayer, Sanofi, Novo Nordisk, Gilead for unrelated diabetes research work. RPL’s institution has received research funding from Boehringer Ingelheim for research not related to this project. The remaining authors declare no conflict of interest.
REFERENCES
- 1.Caroli A, Schneider M, Friedli I, et al. Diffusion-weighted magnetic resonance imaging to assess diffuse renal pathology: a systematic review and statement paper. Nephrol Dial Transplant . 2018;33(suppl 2): ii29–ii40. [DOI] [PMC free article] [PubMed] [Google Scholar]
- 2.Gaudiano C, Clementi V, Busato F, et al. Diffusion tensor imaging and tractography of the kidneys: assessment of chronic parenchymal diseases. Eur Radiol . 2013;23:1678–1685. [DOI] [PubMed] [Google Scholar]
- 3.Taouli B, Beer AJ, Chenevert T, et al. Diffusion-weighted imaging outside the brain: consensus statement from an ISMRM-sponsored workshop. J Magn Reson Imaging . 2016;44:521–540. [DOI] [PMC free article] [PubMed] [Google Scholar]
- 4.Zhao J, Wang ZJ, Liu M, et al. Assessment of renal fibrosis in chronic kidney disease using diffusion-weighted MRI. Clin Radiol . 2014;69: 1117–1122. [DOI] [PubMed] [Google Scholar]
- 5.Li Q, Li J, Zhang L, et al. Diffusion-weighted imaging in assessing renal pathology of chronic kidney disease: a preliminary clinical study. Eur J Radiol. 2014;83:756–762. [DOI] [PubMed] [Google Scholar]
- 6.Inoue T, Kozawa E, Okada H, et al. Noninvasive evaluation of kidney hypoxia and fibrosis using magnetic resonance imaging. J Am Soc Nephrol. 2011;22:1429–1434. [DOI] [PMC free article] [PubMed] [Google Scholar]
- 7.Friedli I, Crowe LA, de Perrot T, et al. Comparison of readout-segmented and conventional single-shot for echo-planar diffusion-weighted imaging in the assessment of kidney interstitial fibrosis. J Magn Reson Imaging . 2017; 46:1631–1640. [DOI] [PubMed] [Google Scholar]
- 8.Liu Z, Xu Y, Zhang J, et al. Chronic kidney disease: pathological and functional assessment with diffusion tensor imaging at 3T MR. Eur Radiol . 2015;25:652–660. [DOI] [PubMed] [Google Scholar]
- 9.Zollner FG, Svarstad E, Munthe-Kaas AZ, et al. Assessment of kidney volumes from MRI: acquisition and segmentation techniques. AJR Am J Roentgenol. 2012;199:1060–1069. [DOI] [PubMed] [Google Scholar]
- 10.Steiger P, Barbieri S, Kruse A, et al. Selection for biopsy of kidney transplant patients by diffusion-weighted MRI. Eur Radiol . 2017;27: 4336–4344. [DOI] [PubMed] [Google Scholar]
- 11.Razek A, Al-Adlany M, Alhadidy AM, et al. Diffusion tensor imaging of the renal cortex in diabetic patients: correlation with urinary and serum biomarkers. Abdom Radiol(NY). 2017;42:1493–1500. [DOI] [PubMed] [Google Scholar]
- 12.Ljimani A, Caroli A, Laustsen C, et al. Consensus-based technical recommendations for clinical translation of renal diffusion-weighted MRI. MAGMA. 2019. [DOI] [PMC free article] [PubMed] [Google Scholar]
- 13.Holland D, Kuperman JM, Dale AM. Efficient correction of inhomogeneous static magnetic field-induced distortion in echo planar imaging. NeuroImage. 2010;50:175–183. [DOI] [PMC free article] [PubMed] [Google Scholar]
- 14.Poustchi-Amin M, Mirowitz SA, Brown JJ, et al. Principles and applications of echo-planar imaging: a review for the general radiologist. Radiographics . 2001;21:767–779. [DOI] [PubMed] [Google Scholar]
- 15.Griswold MA, Jakob PM, Heidemann RM, et al. Generalized autocalibrating partially parallel acquisitions (GRAPPA). Magn Reson Med. 2002;47:1202–1210. [DOI] [PubMed] [Google Scholar]
- 16.He YL, Hausmann D, Morelli JN, et al. Renal zoomed EPI-DWI with spatially-selective radiofrequency excitation pulses in two dimensions. Eur J Radiol . 2016;85:1773–1777. [DOI] [PubMed] [Google Scholar]
- 17.Jezzard P, Balaban RS. Correction for geometric distortion in echo planar images from B0 field variations. Magn Reson Med. 1995;34:65–73. [DOI] [PubMed] [Google Scholar]
- 18.Robson MD, Gore JC, Constable RT. Measurement of the point spread function in MRI using constant time imaging. Magn Reson Med . 1997;38: 733–740. [DOI] [PubMed] [Google Scholar]
- 19.Xiang QS, Ye FQ. Correction for geometric distortion and N/2 ghosting in EPI by phase labeling for additional coordinate encoding (PLACE). Magn Reson Med . 2007;57:731–741. [DOI] [PubMed] [Google Scholar]
- 20.Priest AN, De Vita E, Thomas DL, et al. EPI distortion correction from a simultaneously acquired distortion map using TRAIL. J Magn Reson Imaging . 2006;23:597–603. [DOI] [PubMed] [Google Scholar]
- 21.Morgan PS, Bowtell RW, McIntyre DJ, et al. Correction of spatial distortion in EPI due to inhomogeneous static magnetic fields using the reversed gradient method. J Magn Reson Imaging . 2004;19:499–507. [DOI] [PubMed] [Google Scholar]
- 22.Andersson JL, Skare S, Ashburner J. How to correct susceptibility distortions in spin-echo echo-planar images: application to diffusion tensor imaging. NeuroImage . 2003;20:870–888. [DOI] [PubMed] [Google Scholar]
- 23.Teruel JR, Fjosne HE, Ostlie A, et al. Inhomogeneous static magnetic field-induced distortion correction applied to diffusion weighted MRI of the breast at 3T. Magn Reson Med . 2015;74:1138–1144. [DOI] [PubMed] [Google Scholar]
- 24.Rakow-Penner RA, White NS, Margolis DJA, et al. Prostate diffusion imaging with distortion correction. Magn Reson Imaging . 2015;33:1178–1181. [DOI] [PMC free article] [PubMed] [Google Scholar]
- 25.Borrelli P, Cavaliere C, Basso L, et al. Diffusion tensor imaging of the kidney: design and evaluation of a reliable processing pipeline. Sci Rep . 2019;9:12789. [DOI] [PMC free article] [PubMed] [Google Scholar]
- 26.Notohamiprodjo M, Dietrich O, Horger W, et al. Diffusion tensor imaging (DTI) of the kidney at 3 tesla-feasibility, protocol evaluation and comparison to 1.5 tesla. Investig Radiol. 2010;45:245–254. [DOI] [PubMed] [Google Scholar]
- 27.Cakmak P, Yagci AB, Dursun B, et al. Renal diffusion-weighted imaging in diabetic nephropathy: correlation with clinical stages of disease. Diagn Interv Radiol. 2014;20:374–378. [DOI] [PMC free article] [PubMed] [Google Scholar]
- 28.Chen X, Xiao W, Li X, et al. In vivo evaluation of renal function using diffusion weighted imaging and diffusion tensor imaging in type 2 diabetics with normoalbuminuria versus microalbuminuria. Front Med . 2014;8: 471–476. [DOI] [PubMed] [Google Scholar]
- 29.Lu L, Sedor JR, Gulani V, et al. Use of diffusion tensor MRI to identify early changes in diabetic nephropathy. Am J Nephrol . 2011;34:476–482. [DOI] [PMC free article] [PubMed] [Google Scholar]
- 30.Notohamiprodjo M, Glaser C, Herrmann KA, et al. Diffusion tensor imaging of the kidney with parallel imaging: initial clinical experience. Investig Radiol. 2008;43:677–685. [DOI] [PubMed] [Google Scholar]
- 31.Chuck NC, Steidle G, Blume I, et al. Diffusion tensor imaging of the kidneys: influence of b-value and number of encoding directions on image quality and diffusion tensor parameters. J Clin Imaging Sci. 2013;3:53. [DOI] [PMC free article] [PubMed] [Google Scholar]
- 32.Chan RW, Von Deuster C, Stoeck CT, et al. High-resolution diffusion tensor imaging of the human kidneys using a free-breathing, multi-slice, targeted field of view approach. NMR Biomed . 2014;27:1300–1312. [DOI] [PMC free article] [PubMed] [Google Scholar]
- 33.Delgado J, Berman JI, Maya C, et al. Pilot study on renal magnetic resonance diffusion tensor imaging: are quantitative diffusion tensor imaging values useful in the evaluation of children with ureteropelvic junction obstruction? Pediatr Radiol . 2019;49:175–186. [DOI] [PubMed] [Google Scholar]
- 34.Hueper K, Gutberlet M, Rodt T, et al. Diffusion tensor imaging and tractography for assessment of renal allograft dysfunction-initial results. Eur Radiol . 2011;21:2427–2433. [DOI] [PubMed] [Google Scholar]