Abstract
Primary tumor-derived factors (TDFs) act upon normal cells to generate a pre-metastatic niche, which promotes colonization of target organs by disseminated malignant cells. Here we report that TDFs-induced activation of the p38α kinase in lung fibroblasts plays a critical role in the formation of a pre-metastatic niche in the lungs and subsequent pulmonary metastases. Activation of p38α led to inactivation of type I interferon signaling and stimulation of expression of fibroblast activation protein (FAP). FAP played a key role in remodeling of the extracellular matrix as well as inducing the expression of chemokines that enable lung infiltration by neutrophils. Increased activity of p38 in normal cells was associated with metastatic disease and poor prognosis in human melanoma patients whereas inactivation of p38 suppressed lung metastases. We discuss the p38α-driven mechanisms stimulating the metastatic processes and potential use of p38 inhibitors in adjuvant therapy of metastatic cancers.
Keywords: metastatic cancer, p38 kinase, p38 inhibitor, fibroblast activation protein, pre-metastatic niche, lung metastasis, melanoma, pancreatic ductal adenocarcinoma, adjuvant therapy, tumor-derived factors, interferon, IFNAR1
Malignant cells secrete membranous vesicles and soluble factors that target normal cells in the bone marrow and peripheral tissues to generate pre-metastatic niches in the target organs. These niches provide a beacon and a safe haven for circulating tumor cells enabling their homing and subsequent metastatic colonization1–4.
Lungs are a primary site for hematogenous metastasis of many malignant tumors5,6. Many tumor-derived soluble factors3,7 and extracellular vesicles3,8,9 act upon bone marrow-derived and lung cells resulting in a lung myeloid infiltration, expression of specific inflammatory genes (e.g. S100a8/9) and a localized stromagenic switch exemplified by the activation of lung fibroblasts and ensuing extracellular matrix remodeling events (e.g. accumulation of fibronectin, etc)1,4,10. These common elements of pre-metastatic niches provide favorable conditions for proliferation and survival of disseminated malignant cells, leading to metastatic colonization1,4,11.
The pro-metastatic secretome of primary tumors contains a multitude of factors, which activate a variety of sensors on different types of normal cells in the bone marrow and lung leading to the generation of pre-metastatic niches2,9. Despite such mechanistic diversity, these pathways converge to evoke the equivalent phenotypic manifestations of a pulmonary niche1,4,11. These commonalities suggest that numerous stimuli act through many sensors to trigger a common pathway underlying the generation of the niche. Here we sought to identify and characterize such signaling events activated by tumor-derived factors (TDFs) that act upon healthy cells to promote the formation of a pre-metastatic niche in the lungs.
Many danger-associated molecular patterns and inflammatory cytokines generated by malignant cells activate the p38 stress-activated protein kinases12. Among α/β/γ/δ isoforms of this sub-family, p38α, encoded by the MAPK14 gene, is ubiquitously expressed12. P38α phosphorylates numerous important substrates (e.g. ATF2, CHOP, CREB, etc) and plays a key role in many homeostatic functions and in pathogenesis of inflammation and cancer13–15. Activation of p38α by melanoma TDFs downregulates the IFNAR1 chain of type I interferon (IFN) receptor16, which otherwise acts to suppress distant metastases in mouse melanoma models17,18.
Here we report that TDFs from metastatic malignant cells activate p38α in lung fibroblasts and trigger a sequence of downstream intracellular events including downregulation of IFNAR1 and ensuing induction of the fibroblast activation protein (FAP, which is implicated in many aspects of tumorigenesis19–21). FAP expression and its protease activity are, in turn, required for accumulation of lung fibronectin and induction of CXCL1-like chemokines and recruitment of neutrophils. These events generate favorable conditions for metastatic pulmonary colonization. Whereas activation of p38α in normal cells from melanoma patients correlates with increased metastatic disease and poor prognosis, use of p38 inhibitors in the context of adjuvant therapy notably decreases lung metastases of mouse melanoma. In all, these results support a key role of p38α kinase in development of a pre-metastatic niche and metastatic lung colonization.
Results
TDFs from highly metastatic tumor cells activate p38 kinase and promote the p38-dependent generation of pulmonary pre-metastatic niche
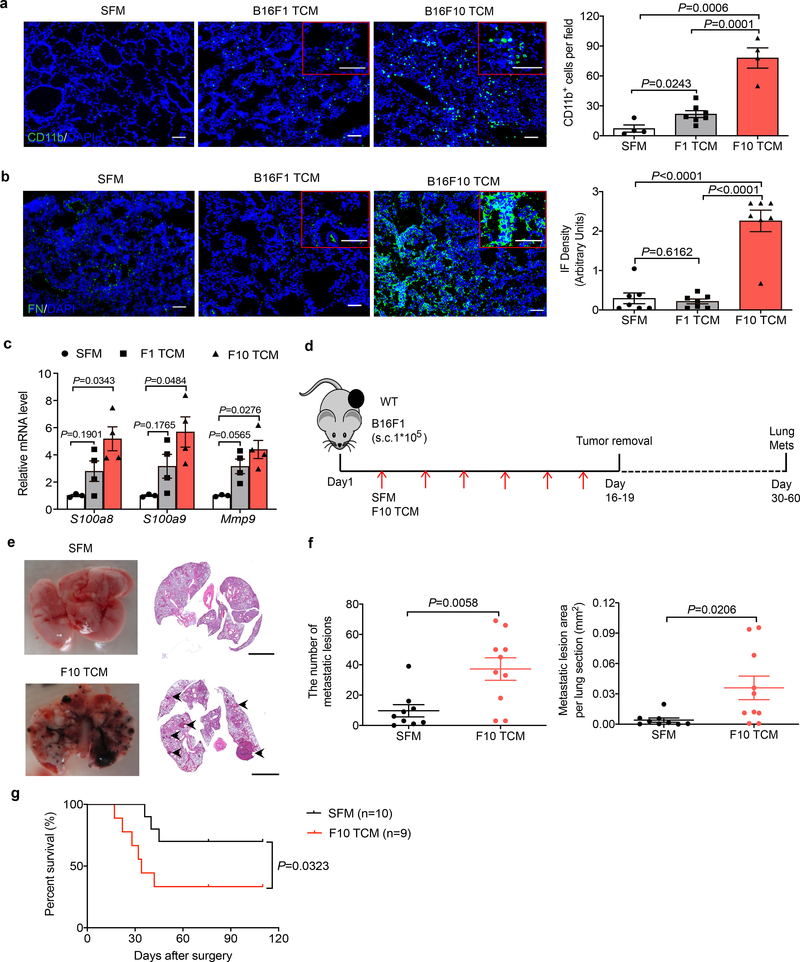
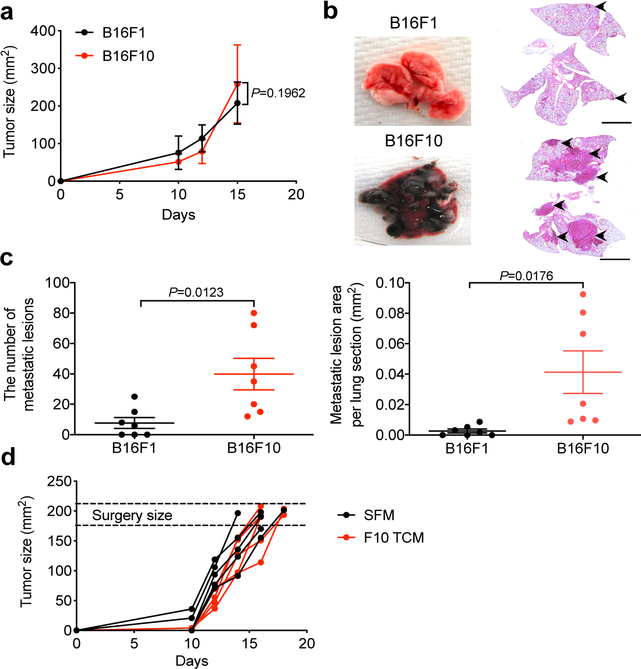
We sought to characterize the signaling pathways activated in normal cells by tumor-derived factors (TDFs), which drive the generation of a pre-metastatic niche in the lungs. Given that lung metastases can be stimulated by both tumor-derived extracellular vesicles8,9 and soluble molecules7 that can be released by primary tumors into the systemic circulation, we administered into mice the entire cell culture media conditioned by syngeneic cancer cells. Here we used B16 mouse melanoma-derived isogenic cell lines exhibiting high (B16F10) or low (B16F1) metastatic activity (characterized in ref.22 and Extended Data Fig. 1a–c). Intravenous administration of B16F10 cell-conditioned media into wild type (WT) mice led to a robust generation of a pre-metastatic niche in the lungs manifested by myeloid infiltration (Fig. 1a), accumulation of fibronectin (Fig. 1b) and increased expression of S100a8, S100a9 and Mmp9 genes (Fig. 1c). Importantly, these changes were less pronounced in response to TDFs from less metastatic B16F1 cells (Fig. 1a–c).
Figure 1. Tumor derived factors from highly metastatic melanoma cells induce the pre-metastatic niche and stimulate pulmonary metastases.
a. A representative immunofluorescence staining of CD11b (left) and quantification of CD11b+ cells (right) in the lung tissues from WT mice treated with tumor cell conditioned media (TCM) from B16F1, or B16F10 cells or with serum-free media (SFM) as control (100 μl i.v., 3x per week for 3 weeks). Quantitative data shown as mean±SEM (n=4 mice for SFM and F10 TCM group, n=7 mice for F1 TCM group). Two-tailed Unpaired t test was performed for the comparisons between two groups. Here and henceforth, the inset shows a zoomed (2x) area of the stained image. Scale bar: 100 μm.
b. A representative immunofluorescence staining of fibronectin (left) and the quantification of fibronectin level (right) in the lung tissues from WT mice treated with B16F1 TCM, or B16F10 TCM or SFM as control (100 μl i.v., 3x per week for 3 weeks). Scale bar: 100 μm. Quantitative data shown as mean±SEM (n=7 mice per group). Two-tailed Unpaired t test was performed for the comparisons between two groups.
c. qPCR analysis of mRNA levels of the niche genes in the lung tissues from WT mice treated with B16F1 TCM, or B16F10 TCM or SFM as control (100 μl i.v., 3x per week for 3 weeks). Data shown as mean±SEM (n=3 mice for SFM group, n=4 mice for F1 TCM and F10 TCM group). Two-way ANOVA and Tukey’s multiple comparisons test were performed.
d. Schematic illustration for analysis of the lung metastasis in the B16F1 tumor bearing mice treated with SFM or B16F10 TCM (100 μl every other day until primary tumor removal upon reaching the size ~200 mm2).
e. Representative lung images and the corresponding H&E-stained lung sections in the B16F1 tumor bearing mice treated with SFM or B16F10 TCM after surgery. Scale bar: 1 mm. Similar results were obtained from three independent experiments.
f. Quantification of the number of metastatic lesions and total area in the lung tissue sections from B16F1 tumor bearing mice treated with SFM (n=9 mice) or B16F10 TCM (n=10 mice) after surgery. Data shown as mean±SEM. Two-tailed Unpaired t test was performed.
g. Kaplan-Meier analysis of survival of B16F1 tumor bearing mice treated with SFM (n=10 mice) or B16F10 TCM (n=9 mice) after surgery by Gehan-Breslow-Wilcoxon test.
To determine the importance of TDFs in the metastatic activities of malignant cells, we supplemented subcutaneous growth of B16F1 tumors with administration of highly metastatic B16F10-derived TDFs (Fig. 1d). Without accelerating growth of primary B16F1 tumors (Extended Data Fig. 1d), B16F10-derived TDFs increased the number and size of B16F1 lung metastases (Fig. 1e,f) and decreased animal survival (Fig. 1g). These results suggest that production of TDFs that can induce the generation of a pre-metastatic niche plays an important role in defining the metastatic potential of malignant cells.
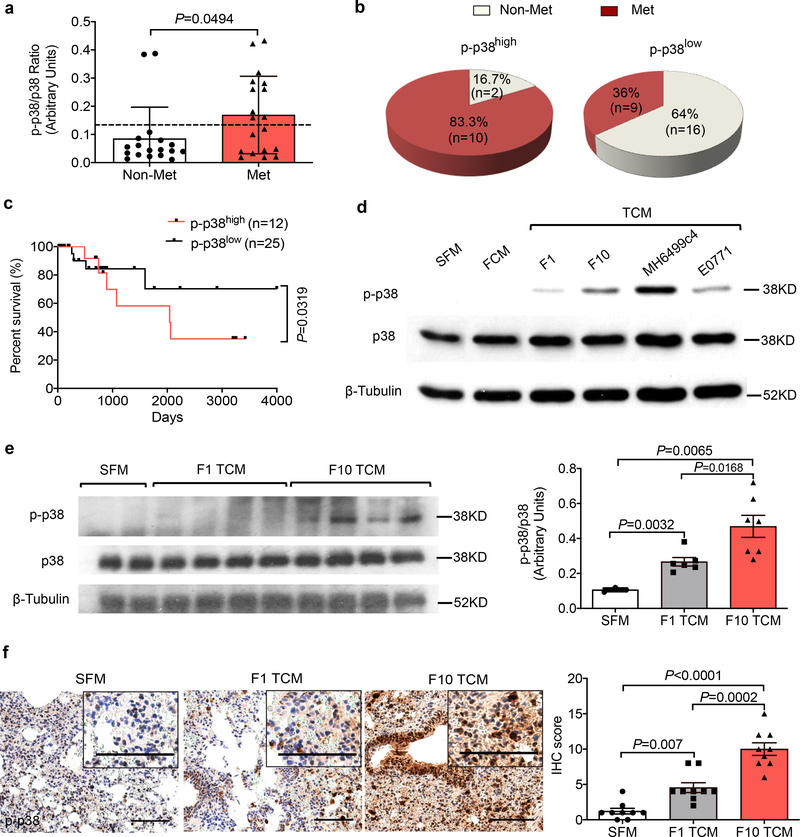
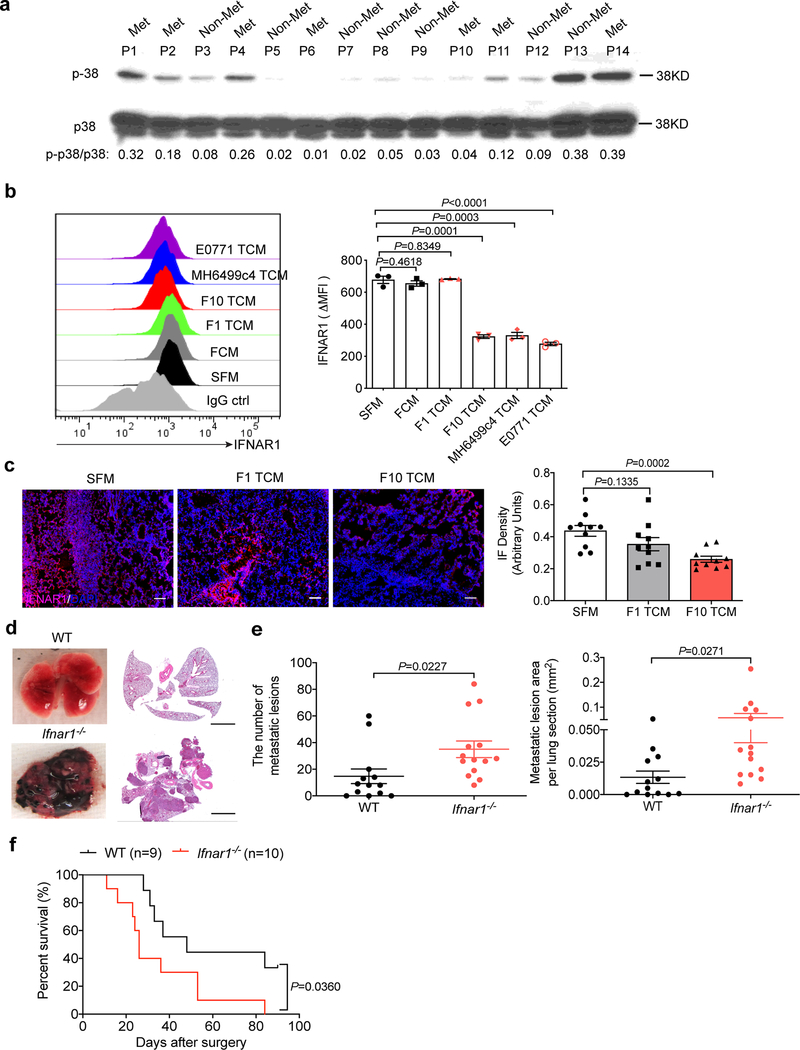
Given that p38 kinase activity can be stimulated in response to cancer cells-produced soluble factors (e.g., TNFα, IL-17,16) or extracellular vesicles18, we examined activation of p38 (assessed by its phosphorylation) in normal cells (i.e. in peripheral blood leukocytes) isolated from melanoma patients with or without metastatic disease (Extended Data Fig. 2a). Leukocytes from patients without signs of metastatic disease exhibited a significantly lower level of p38 activation (Fig. 2a). Conversely, high levels of p38 activation were associated with occurrence of metastatic disease (Fig. 2b) and poor survival of these patients (Fig. 2c). These results suggest that human metastatic melanoma-derived TDFs activate p38 in normal cells and indirectly implicate this activation in the metastatic process.
Figure 2. Tumor derived factors-induced activation of p38 kinase correlates with metastatic disease in human melanoma patients and mouse melanoma model.
a. The phospho-p38 (p-p38)/total p38 ratio in the leukocytes isolated from the peripheral blood of melanoma patients with metastasis (n=19) and without metastasis (n=18). The dash line denotes the average p-p38/p38 ratio among all melanoma patients. Data shown as mean±SEM. Two-tailed Unpaired t test was performed.
b. Documented metastases in melanoma patients whose lymphocytes had greater (p-p38/p38high) or lower (p-p38/p38low) levels of p-p38/p38 signal ratio compared to the average p-p38/p38 ratio among all melanoma patients. Fisher’s exact test was performed. P = 0.0128.
c. Kaplan-Meier analysis of survival of melanoma patients classified as p-p38/p38high (n=12) or p-p38/p38low (n=25) by Log-rank test.
d. A representative western blot analysis of p-p38 and total p38 in the WT lung fibroblasts 1 hr after SFM, conditioned media from normal lung fibroblasts (FCM), or TCM from different malignant cells including B16F1 and B16F10 melanoma, MH6499c4 pancreatic ductal adenocarcinoma and E0771 mammary adenocarcinoma cell lines. Similar results were obtained from three independent experiments.
e. A representative western blot analysis of p-p38/p38 (left) and quantification of the ratio of p-p38/p38 (right) in the lung tissue lysates isolated from WT mice treated with B16F1 TCM (n=6 mice), or B16F10 TCM (n=7 mice) or SFM (n=3 mice) as control (100 μl i.v., 3x per week for 3 weeks). Quantitative data shown as mean±SEM. Two-tailed Unpaired t test was performed for the comparisons between two groups.
f. A representative IHC staining of p-p38 (left) and quantification of IHC score for p-p38 (right) in the lung tissue sections from WT mice treated with B16F1 TCM, or B16F10 TCM or SFM as control (100 μl i.v., 3x per week for 3 weeks). Scale bar: 100 μm. Quantitative data shown as mean±SEM (n=9 mice per group). Two-tailed Unpaired t test was performed for the comparisons between two groups.
Next we sought to re-capitulate these observations from human patients in mouse models. TDFs from highly metastatic melanoma and pancreatic or mammary adenocarcinoma cells activated p38 in primary mouse lung fibroblasts in vitro (Fig. 2d). We observed a greater activation of p38 in vitro or in the lung tissues of mice, which received B16F10-derived factors compared with those from normal fibroblasts or less metastatic B16F1 melanoma cells (Fig. 2d–f). To determine whether TDFs activate pathways downstream of p38, we examined the expression of IFNAR1, which plays a role in limiting melanoma metastases17,18 and was shown to be phosphorylated, ubiquitinated and downregulated in response to soluble or vesicular TDFs in a p38-dependent manner16,18.
TDFs from metastatic pancreatic or mammary adenocarcinoma cells notably downregulated IFNAR1 in vitro (Extended Data Fig. 2b). In addition, TDFs from highly metastatic B16F10 (but not B16F1) cells significantly decreased IFNAR1 levels in vitro and in mouse lung tissues (Extended Data Fig. 2b,c). In line with these observations, a greater extent of lung metastatic lesions (Extended Data Fig. 2d,e) and poorer survival (Extended Data Fig. 2f) was observed in B16F1 tumor-bearing Ifnar1−/− mice compared to WT animals; these data further suggest an important role of IFNAR1 loss in metastatic disease.
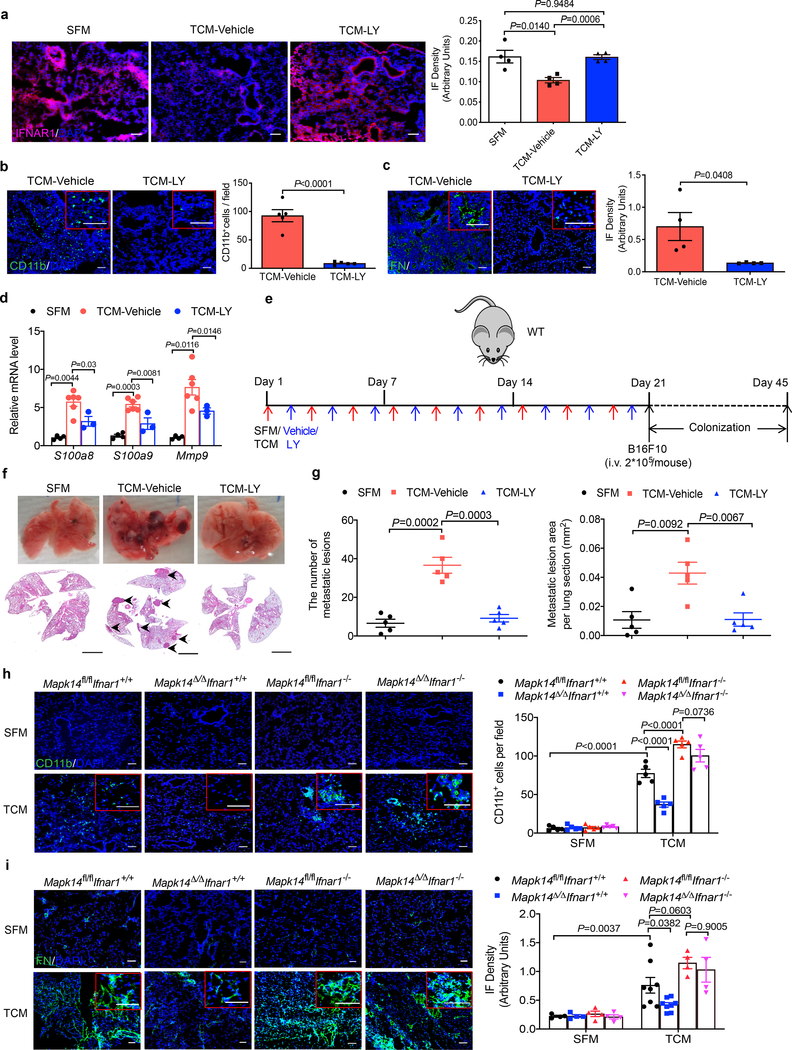
Importantly, treatment of cells or mice with the p38 inhibitor Ralimetinib (LY2228820) attenuated downregulation of IFNAR1 in vitro (Extended Data Fig. 3a) and in vivo (Fig. 3a). Ralimetinib also inhibited TDFs-induced generation of pulmonary pre-metastatic niche manifested by myeloid infiltration (Fig. 3b), accumulation of fibronectin (Fig. 3c), and increased expression of S100a8/9 and Mmp9 genes (Fig. 3d). Importantly, whereas pre-treatment of mice with B16F10 TDFs (Fig. 3e) increased the efficacy of lung colonization by intravenously injected B16F10 cells, this effect was completely reversed by addition of Ralimetinib (Fig. 3f,g).
Figure 3. P38α is essential for generation of the pre-metastatic niche.
a. A representative immunofluorescence staining of IFNAR1 (left) and quantification of IFNAR1 level (right) in the lung tissues from WT mice treated with SFM, B16F10 TCM plus vehicle or p38 inhibitor Ralimetinib (LY2228820). Scale bar: 100 μm. Quantitative data shown as mean±SEM (n=4 mice per group). Two-tailed Unpaired t test was performed for the comparisons between two groups.
b. A representative immunofluorescence staining of CD11b (left) and quantification of CD11b+ cells (right) in the lung tissues from WT mice treated with B16F10 TCM plus vehicle or p38 inhibitor LY2228820. Scale bar: 100 μm. Quantitative data shown as mean±SEM (n=5 mice per group). Two-tailed Unpaired t test was performed for the comparison.
c. A representative immunofluorescence staining of fibronectin (left) and quantification of fibronectin level (right) in the lung tissues from WT mice treated with B16F10 TCM plus vehicle or p38 inhibitor LY2228820. Scale bar: 100 μm. Quantitative data shown as mean±SEM (n=4 mice per group). Two-tailed Unpaired t test was performed for the comparison.
d. qPCR analysis of mRNA levels of the niche genes in the lung tissues from WT mice treated with SFM (control, n=4 mice), B16F10 TCM plus vehicle (n=6 mice) or LY2228820 (n=3 mice). Data shown as mean±SEM. Two-way ANOVA and Tukey’s multiple comparisons test were performed.
e. Schematic illustration for analysis of the tumor cell colonization in the lung of the mice pretreated with SFM (control), B16F10 TCM plus vehicle or LY2228820 followed by intravenous injection of 2×10⁵ B16F10 tumor cells per mouse.
f. Representative lung images and the corresponding H&E-stained lung sections from the mice pretreated with SFM (control), B16F10 TCM plus vehicle or LY2228820 followed by intravenous injection of 2×10⁵ B16F10 tumor cells as described in e. Scale bar: 1 mm. The experiment was repeated three times independently with similar results.
g. Quantification of the number of metastatic lesions and total area in the lung tissue sections of the mice as shown in f. Data shown as mean±SEM (n=5 mice per group). Two-tailed Unpaired t test was performed for the comparisons between two groups.
h. A representative immunofluorescence staining of CD11b (left) and quantification of CD11b+ cells (right) in the lung tissues from tamoxifen-treated Ubc9-CreER- Mapk14fl/fl Ifnar1+/+ (Mapk14fl/fl Ifnar1+/+), Ubc9-CreER+ Mapk14fl/fl Ifnar1+/+ (Mapk14Δ/ΔIfnar1+/+), Ubc9-CreER- Mapk14fl/fl Ifnar1−/− (Mapk14fl/flIfnar1−/−), and Ubc9-CreER+ Mapk14fl/fl Ifnar1−/− (Mapk14Δ/ΔIfnar1−/−) mice treated with SFM or B16F10 TCM (100 μl i.v., 3x per week for 3 weeks). Scale bar: 100 μm. Quantitative data shown as mean±SEM (n=5 mice per group). Two-way ANOVA and Tukey’s multiple comparisons test were performed.
i. A representative immunofluorescence staining of fibronectin (left) and the quantification of fibronectin level (right) in the lung tissues from tamoxifen-treated Ubc9-CreER- Mapk14fl/fl Ifnar1+/+ (Mapk14fl/fl Ifnar1+/+), Ubc9-CreER+ Mapk14fl/fl Ifnar1+/+ (Mapk14Δ/ΔIfnar1+/+), Ubc9-CreER- Mapk14fl/fl Ifnar1−/− (Mapk14fl/flIfnar1−/−), and Ubc9-CreER+ Mapk14fl/fl Ifnar1−/− (Mapk14Δ/ΔIfnar1−/−) mice treated with SFM or B16F10 TCM (100 μl i.v., 3x per week for 3 weeks). Scale bar: 100 μm. Quantitative data shown as mean±SEM (n=4 mice in all SFM treated group, n=8 mice in TCM treated Mapk14fl/flIfnar1+/+ and Mapk14Δ/ΔIfnar1+/+ group, n=4 mice in TCM treated Mapk14fl/flIfnar1−/− and Mapk14Δ/ΔIfnar1−/− group). Two-way ANOVA and Tukey’s multiple comparisons test were performed.
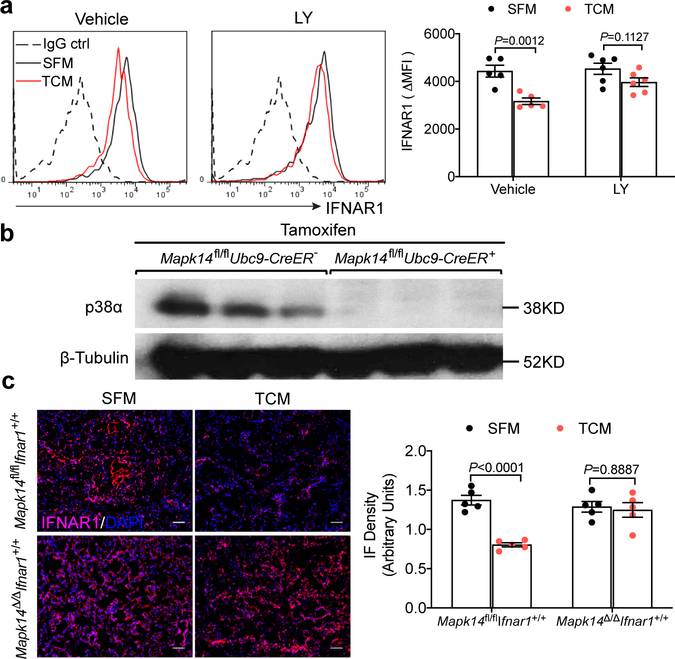
Subsequent genetic studies revealed that inducible whole body ablation of p38α/Mapk14 (Mapk14Δ/Δ; achieved by tamoxifen treatment of Ubc9-CreER Mapk14fl/fl mice, Extended Data Fig. 3b) notably attenuated TDFs-elicited events in the lungs including downregulation of IFNAR1 (Extended Data Fig. 3c), myeloid infiltration (Fig. 3h) and fibronectin accumulation (Fig. 3i). Importantly, these effects of Mapk14 ablation were reversed by additional deletion of Ifnar1 (Fig. 3h,i) indicating a pivotal role of p38 kinase and the downstream consequences of its activation (i.e. IFNAR1 downregulation) in the TDFs-stimulated generation of a pre-metastatic niche.
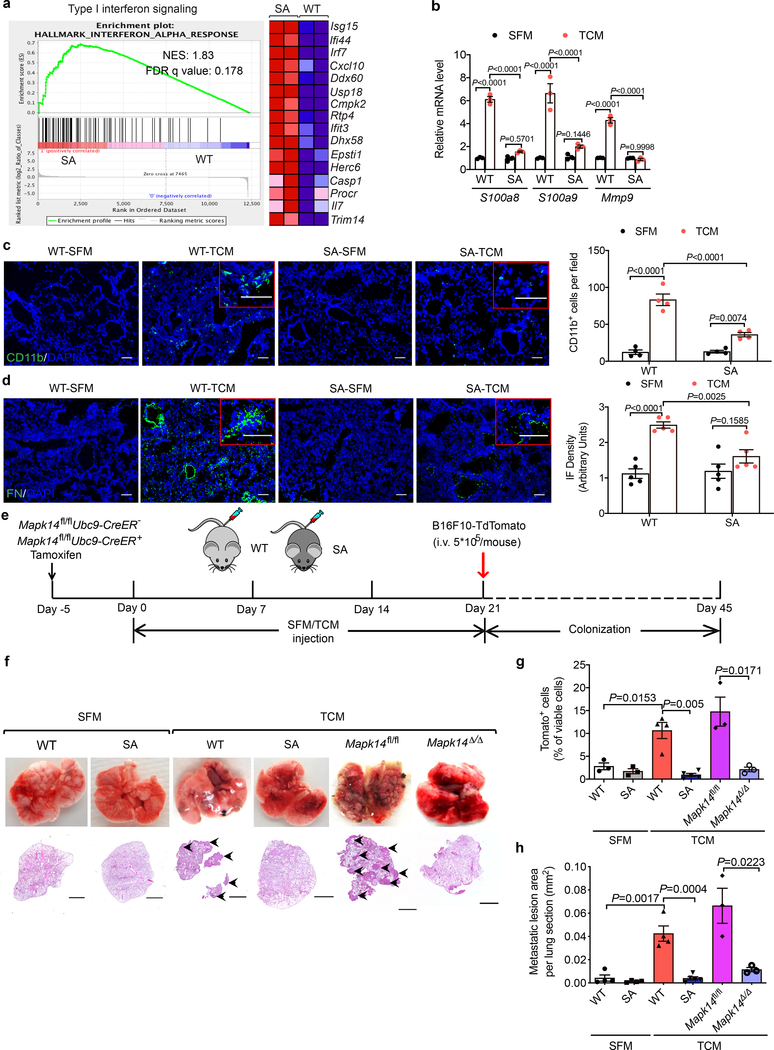
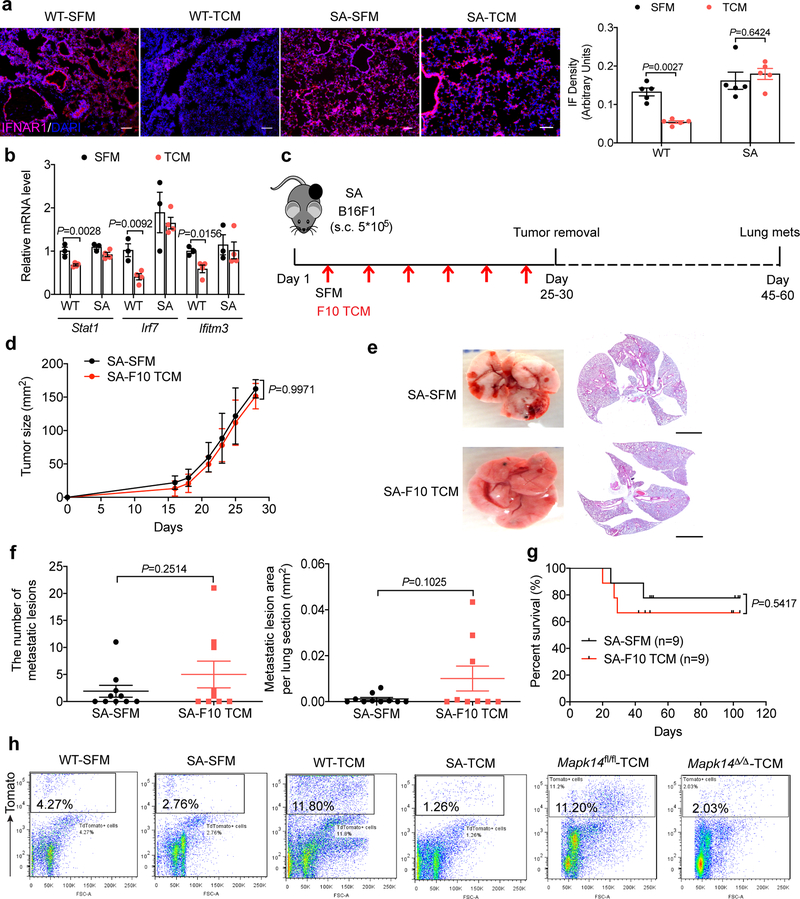
As a complementary approach, we used another mouse model (Ifnar1S526A knock-in mice, termed “SA”), where this mutation within the IFNAR1 phospho-degron renders IFNAR1 insensitive to p38-driven phosphorylation, ubiquitination and degradation23,24. These SA mice also suppress distant metastases in the genetically engineered and transplanted melanoma models17,18. Upon administration of B16F10 TDFs, lungs of these mice retained IFNAR1 (Extended Data Fig. 4a) and sustained the expression of the IFN stimulated genes (assessed by RNAseq, Fig. 4a) including Stat1, Irf7 and Ifitm3 (otherwise decreased by TDFs, Extended Data Fig. 4b). Importantly, TDFs treatment elicited a less pronounced pre-metastatic niche as in the lungs from SA (compared to WT) mice manifested by differences in expression of S100a8/9 and Mmp9 (Fig. 4b), myeloid infiltration (Fig. 4c) and fibronectin deposition (Fig. 4d). Furthermore, B16F10 TDFs did not promote metastatic disease and related death in SA mice bearing subcutaneous B16F1 tumors (Extended Data Fig. 4c–g).
Figure 4. p38α-driven inactivation of type I interferon pathway drives the formation of a pre-metastatic niche in the lungs.
a. The heatmap and GSEA analysis of type I IFN signature genes in the lung tissues of WT and SA mice treated with B16F10 TCM (100 μl i.v., 3x per week for 3 weeks). Expression values were represented as colors, where the range of colors (red, pink, light blue, dark blue) showed the range of expression values (high, moderate, low, lowest). n=2 mice per group. NES, normalized enrichment score; FDR, false discovery rate.
b. qPCR analysis of mRNA levels of indicated genes in the lung tissues from WT and SA mice treated with SFM or B16F10 TCM (100 μl i.v., 3x per week for 3 weeks). Data shown as mean±SEM (n=3 mice per group). Two-way ANOVA and Tukey’s multiple comparisons test were performed.
c. A representative immunofluorescence staining of CD11b+ (left) and quantification of CD11b+ cells (right) in the lung tissues from WT and SA mice treated with SFM or B16F10 TCM (100 μl i.v., 3x per week for 3 weeks). Scale bar: 100 μm. Quantitative data shown as mean±SEM (n=4 mice per group). Two-way ANOVA and Sidak’s multiple comparisons test were performed.
d. A representative immunofluorescence staining of fibronectin (left) and quantification of fibronectin level (right) in the lung tissues from WT and SA mice treated with SFM or B16F10 TCM (100 μl i.v., 3x per week for 3 weeks). Scale bar: 100 μm. Quantitative data shown as mean±SEM (n=5 mice per group). Two-way ANOVA and Sidak’s multiple comparisons test were performed.
e. Schematic illustration for analysis of the tumor cell colonization in the lung of WT, SA, and tamoxifen-treated Mapk14fl/flUbc9CreER- (Mapk14fl/fl) and Mapk14fl/flUbc9CreER+ (Mapk14Δ/Δ, p38α knock out in the whole body) mice pretreated with SFM or B16F10 TCM (100 μl i.v., 3x per week for 3 weeks) followed by intravenous injection of 5*105 B16F10-TdTomato cells.
f. Representative lung images and the corresponding H&E-stained lung sections of the indicated mice as described in e. Scale bar: 1 mm. Similar results were obtained from three independent experiments.
g. The percent of TdTomato+ tumor cells analyzed by flow cytometry in the lung tissues of indicated mice as described in e. Data shown as mean±SEM (n=3 mice for SFM treated WT and SA group, n=3 mice for TCM treated Mapk14fl/fl and Mapk14Δ/Δ group, n=4 mice for TCM treated WT group, n=5 for TCM treated SA group). Two-tailed Unpaired t test was performed for the comparisons between two groups.
h. Quantification of metastatic lesion area in the lung tissues of indicated mice as described in e. Data shown as mean±SEM (n=4 mice for SFM treated WT and SA group, and TCM treated WT group, n=3 mice for TCM treated Mapk14fl/fl and Mapk14Δ/Δ group, n=5 mice for TCM treated SA group). Two tailed-Unpaired t test was performed for the comparisons between groups.
In addition, pre-treatment of animals with B16F10 TDFs (Fig. 4e) followed by administration B16F10-TdTomato cells increased lung colonization in WT but not SA mice (Fig. 4f–h and Extended Data Fig. 4h). Importantly, TDFs-pre-treated SA mice displayed a notably lesser colonization compared to WT animals. A similar decrease in lung colonization was also observed in TDFs-pre-treated Mapk14Δ/Δ mice (Fig. 4f–h) further indicating that TDFs-induced p38 activation and its downstream consequences (i.e. downregulation of IFNAR1) are important for the generation of a pre-metastatic niche.
P38α-mediated induction of the neutrophil-attracting chemokines stimulates malignant cell colonization in the lungs
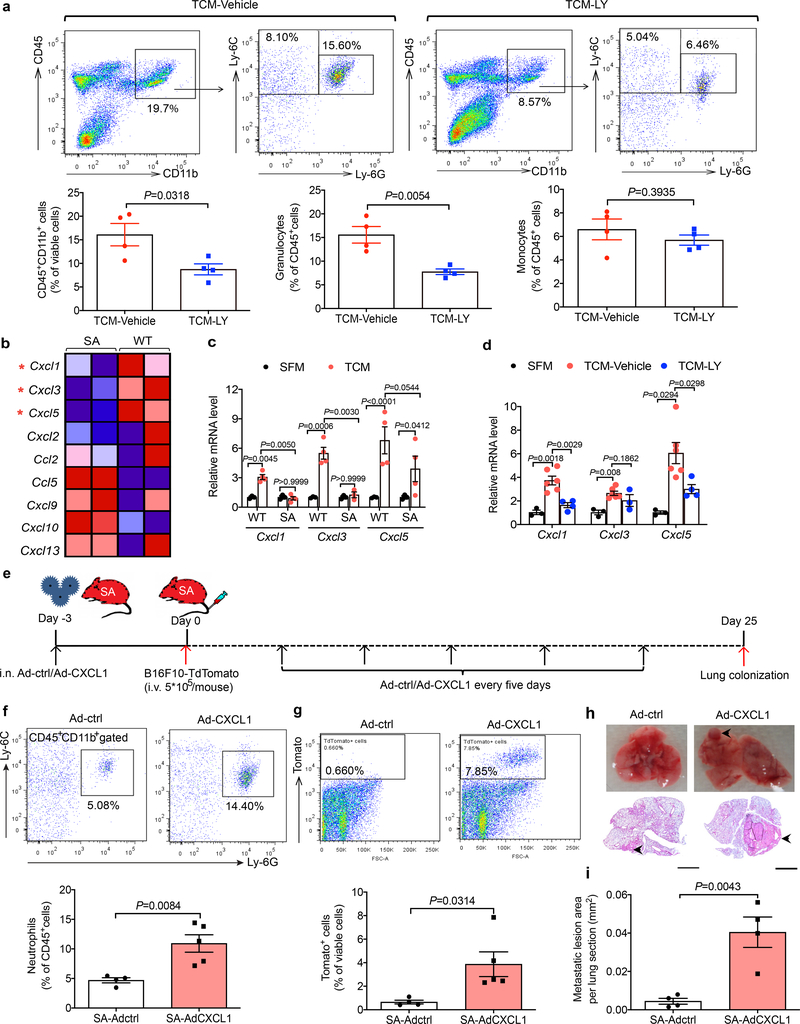
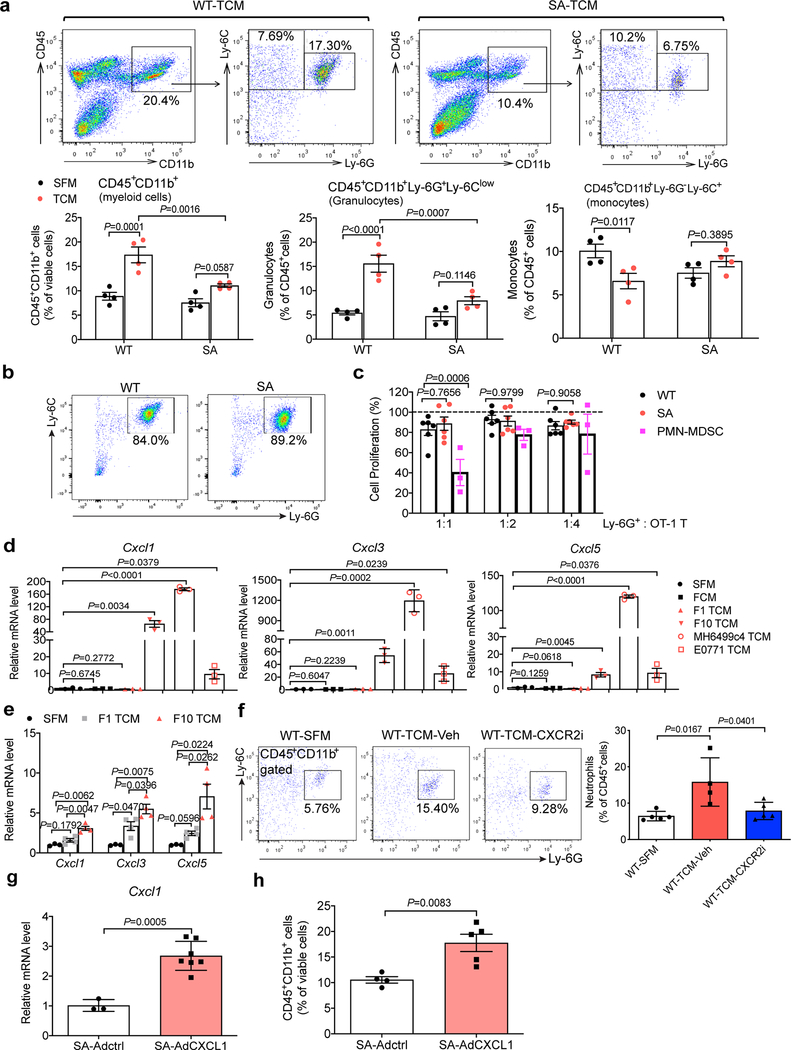
Characterization of leukocytes in the lungs of WT mice treated with TDFs revealed a predominance of polymorphonuclear myeloid cells (Extended Data Fig. 5a). Numbers of these cells were decreased in the lungs of SA mice (Extended Data Fig. 5a) or WT mice treated with p38 inhibitor (Fig. 5a). These cells exhibited neutrophil markers (CD45+CD11b+Ly6G+Ly6Clow) and undetectable immune suppressive properties ex vivo (Extended Data Fig. 5b,c) suggesting that these cells are not myeloid-derived suppressors25,26. Together with results reported in melanoma tumors-bearing Ifnar1−/− mice27, these data are consistent with neutrophils being the major type of myeloid cells that infiltrate the lungs downstream of TDFs-induced activation of p38 kinase.
Figure 5. p38α activation-mediated induction of the neutrophil-attracting chemokines stimulates melanoma cell colonization in the lungs.
a. Representative flow cytometry analysis of myeloid cell subpopulations (total myeloid cells: CD45+CD11b+; granulocytes: CD45+CD11b+Ly-6G+Ly-6Clow; monocytes: CD45+CD11b+Ly-6G-Ly-6C+) (above) and quantification of these cell subpopulations (below) in the lung tissues of WT mice treated with B16F10 TCM plus vehicle or p38 inhibitor LY2228820. Quantitative data shown as mean±SEM (n=4 mice per group). Two-tailed Unpaired t test was performed for the comparison.
b. Heatmap of gene expression of chemokines in the lung tissues of WT and SA mice treated with B16F10 TCM (100 μl i.v., 3x per week for 3 weeks). Expression values were represented as colors, where the range of colors (red, pink, light blue, dark blue) showed the range of expression values (high, moderate, low, lowest). The red asterisks denote core enriched genes in WT mice compared to SA mice.
c. qPCR analysis of mRNA levels of the indicated chemokines in the lung tissues of WT and SA mice treated with SFM or B16F10 TCM (100 μl i.v., 3x per week for 3 weeks). Data shown as mean±SEM (n=3 mice for SFM group, n=4 mice for TCM group). Two-way ANOVA and Tukey’s multiple comparisons test were performed.
d. qPCR analysis of mRNA levels of the indicated chemokines in the lung tissues of WT mice treated with SFM (n=3 mice), B16F10 TCM plus vehicle (n=6 mice) or p38 inhibitor LY2228820 (n=4 mice). Data shown as mean±SEM. Two-way ANOVA and Tukey’s multiple comparisons test were performed.
e. Schematic illustration for analysis of the tumor cell colonization in the lungs of SA mice engineered to re-express CXCL1 by intranasally delivered adenoviruses.
f. Representative flow cytometry analysis of neutrophils (above) and quantification of the percent of neutrophils (below) in the lung tissues of SA mice as described in e. Quantitative data shown as mean±SEM (n=4 mice for Adctrl group, n=5 for AdCXCL1 group). Two-tailed Unpaired t test was performed for the comparison.
g. Representative flow cytometry analysis of TdTomato+ tumor cells (above) and the quantification (below) in the lung tissues of SA mice as described in e. Quantitative data shown as mean±SEM (n=4 mice for Adctrl group, n=5 mice for AdCXCL1 group). Two-tailed Unpaired t test was performed for the comparison.
h. Representative lung images and the corresponding H&E-stained lung sections of SA mice as described in e. Scale bar: 1 mm. Similar results were obtained from three independent experiments.
i. Quantification of metastatic lesion area in the lung tissues of SA mice as shown in h. Data shown as mean±SEM (n=4 mice per group). Two-tailed Unpaired t test was performed for the comparison.
Indeed, careful examination and validation of gene expression profiles revealed increased levels of several chemokines known to attract neutrophils (including Cxcl1, Cxcl3 and Cxcl5) in the lungs of B16F10 TDFs-treated WT mice (Fig. 5b). TDFs from pancreatic and mammary adenocarcinoma cells also increased expression of these genes in vitro (Extended Data Fig. 5d). Induction of chemokine expression in vivo was notably less pronounced in either SA mice (Fig. 5b,c) or WT mice treated with B16F1 TDFs (Extended Data Fig. 5e) or WT that received B16F10 TDFs along with Ralimetinib (Fig. 5d). These results suggest that TDFs-induced p38 activation and IFNAR1 downregulation trigger elevated expression of the neutrophil-attracting chemokines. Indeed, treatment of mice with an inhibitor of CXCR2 (a receptor for CXCL1, CXCL3 and CXCL5) decreased the numbers of lung neutrophils (Extended Data Fig. 5f) suggesting an important role of the CXCR2 ligands in TDFs-induced myeloid pulmonary infiltration.
We next sought to define the mechanistic relationship between p38-driven downregulation of IFNAR1, increased expression of CXCR2-activating chemokines, pulmonary neutrophil infiltration and metastatic colonization. Adenoviral delivery of Cxcl1 to the lungs of SA mice (Fig. 5e) increased Cxcl1 expression (Extended Data Fig. 5g) and lung infiltration with myeloid cells (Extended Data Fig. 5h) including neutrophils (Fig. 5f). Remarkably, whereas lungs from SA mice intravenously inoculated with B16F10-TdTomato cells displayed few melanoma cells and virtually no macro-metastatic lesions (Fig. 4f,g), expression of Cxcl1 in the lungs of SA mice robustly reversed this phenotype and sufficed to enable the metastatic colonization in these animals (Fig. 5g–i). Collectively, these data suggest that p38-driven inactivation of IFNAR1 leads to an induction in expression of CXCL1 (and likely of similarly acting chemokines), to recruit neutrophils and, in the presence of malignant cells, to stimulate the metastatic colonization.
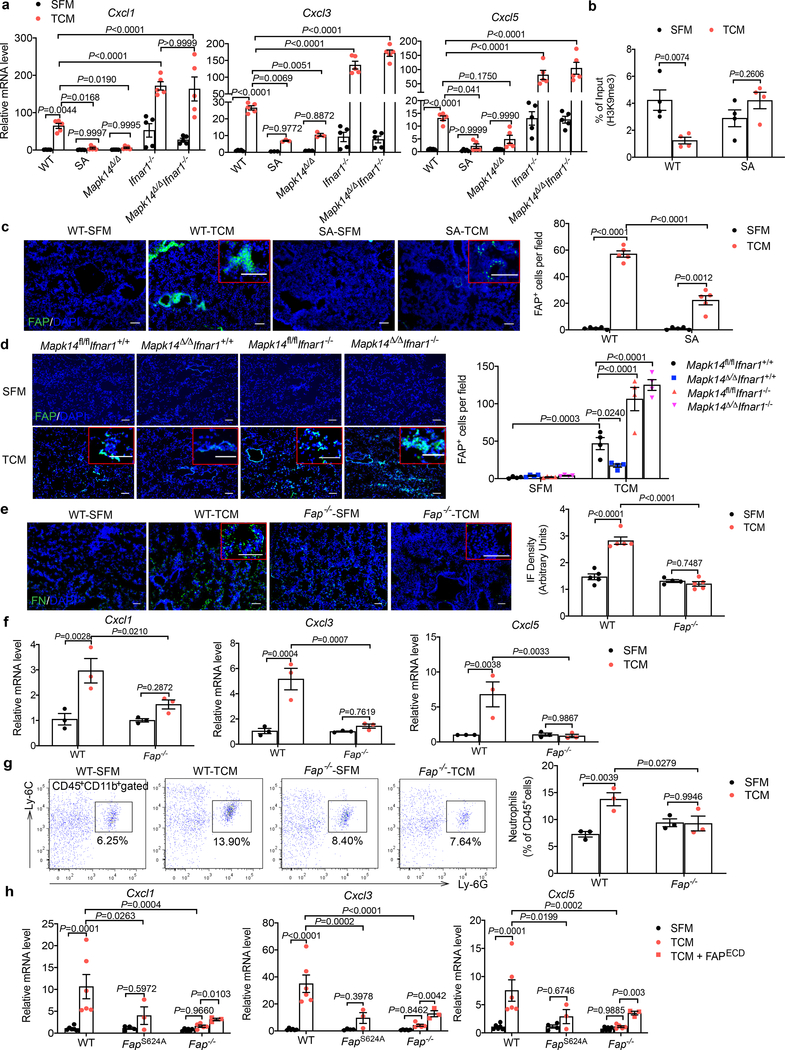
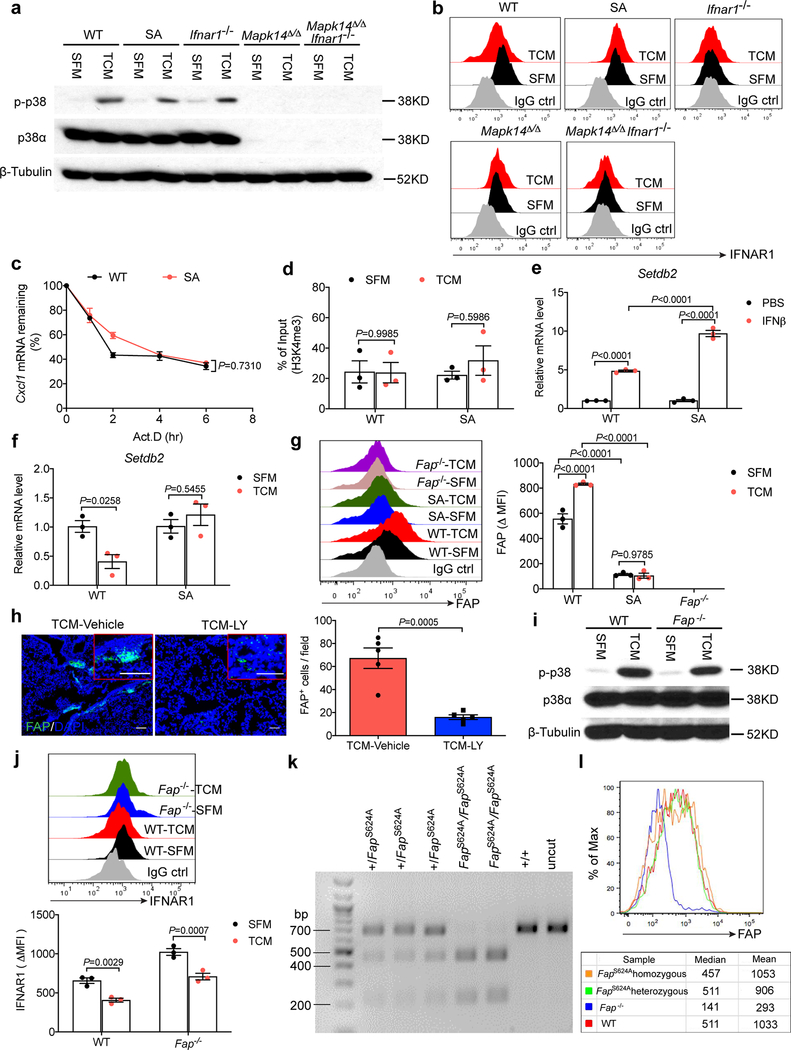
The intratumoral fibroblasts are the major source of CXCL1 that recruits the CD45+CD11b+Ly6G+Ly6Clow cells to the primary tumor microenvironment28. We found that primary WT lung fibroblasts responded to TDFs treatment in vitro with a robust induction of Cxcl1/3/5 expression; this induction was even greater in Ifnar1−/− cells (Fig. 6a). A notably less pronounced chemokine expression was observed in lung fibroblasts isolated from SA or Mapk14Δ/Δ mice but not in mice lacking both p38 and IFNAR1 (Fig. 6a). Importantly, p38 activation was not affected by the IFNAR1 status (Extended Data Fig. 6a,b). Collectively, these data suggest that p38-driven downregulation of IFNAR1 provides a license for normal lung fibroblasts to increase the expression of the neutrophil-recruiting chemokines.
Figure 6. Tumor-derived factors-induced p38α-dependent expression of FAP in the lungs plays a key role in the generation of the pre-metastatic niche.
a. qPCR analysis of indicated chemokines mRNA levels in the lung fibroblasts (from indicated mice) at 6 hr after SFM or B16F10 TCM treatment in vitro. Data shown as mean±SEM (n=5 biologically independent samples). Two-way ANOVA and Tukey’s multiple comparisons test were performed.
b. ChIP analysis of H3K9me3 binding to the Cxcl1 promoter in the isolated WT and SA lung fibroblasts treated with SFM or B16F10 TCM for 12 hr. Data shown as mean±SEM (n=4 independent experiments). Two-way ANOVA and Sidak’s multiple comparisons test were performed.
c. A representative immunofluorescence staining of FAP (left) and quantification of FAP+ cells (right) in the lung tissues of WT and SA mice treated with SFM, or B16F10 TCM (100 μl i.v., 3x per week for 3 weeks). Scale bar: 100 μm. Quantitative data shown as mean±SEM (n=5 mice per group). Two-way ANOVA and Sidak’s multiple comparisons test were performed.
d. A representative immunofluorescence staining of FAP (left) and quantification of FAP+ cells (right) in the lung tissues of indicated mice treated with SFM, or B16F10 TCM (100 μl i.v., 3x per week for 3 weeks). Scale bar: 100 μm. Quantitative data shown as mean±SEM (n=4 mice per group). Two-way ANOVA and Tukey’s multiple comparisons test were performed.
e. A representative immunofluorescence staining of fibronectin (left) and quantification of fibronectin level (right) in the lung tissues from WT and Fap−/− mice treated with SFM or B16F10 TCM (100 μl i.v., 3x per week for 3 weeks). Scale bar: 100 μm. Quantitative data shown as mean±SEM (n=5 mice per group). Two-way ANOVA and Sidak’s multiple comparisons test were performed.
f. qPCR analysis of mRNA levels of the indicated chemokines in the lung tissues of WT and Fap−/− mice treated with SFM or B16F10 TCM (100 μl i.v., 3x per week for 3 weeks). Data shown as mean±SEM (n=3 mice per group). Two-way ANOVA and Sidak’s multiple comparisons test were performed.
g. Representative flow cytometry analysis of neutrophils (left) and quantification of their percent (right) in the lung tissues of WT and Fap−/− mice treated with SFM or B16F10 TCM (100 μl i.v., 3x per week for 3 weeks). Quantitative data shown as mean±SEM (n=3 mice per group). Two-way ANOVA and Sidak’s multiple comparisons test were performed.
h. qPCR analysis of mRNA levels of the indicated chemokines in the lung fibroblasts isolated from WT, FapS624A knock-in and knockout Fap−/− mice 6 hr after SFM or B16F10 TCM treatment with or without adding FAP extracellular domain (FAPECD, 0.3 μg/ml). Data shown as mean±SEM (n=6, n=4, n=3 biological independent samples in SFM/TCM treated WT and Fap−/− cells, SFM treated FapS624A cells, TCM treated FapS624A cells and FAPECD treated Fap−/− cells respectively). Two-way ANOVA and Tukey’s multiple comparisons test were performed.
We next examined putative mechanisms underlying the regulation of chemokine expression in TDFs-treated WT and SA lung fibroblasts. No notable differences in the Cxcl1 mRNA half-life were detected under these conditions (Extended Data Fig. 6c). In pancreatic cancer cells harboring activated Myc, transcriptional activation of the Cxcl1 promoter depends on tri-methylation of Lys4 residue of histone 329; however, we did not find differences in this H3K4me3 modification between TDFs-treated WT and SA lung fibroblasts (Extended Data Fig. 6d). Instead, we found that expression of the lysine methyltransferase Setdb2 (known to be induced by type I IFN and to regulate the Cxcl1 promoter30,31) was suppressed by TDFs in WT but not SA fibroblasts (Extended Data Fig. 6e,f). Accordingly, TDFs treatment of WT (but not SA) lung fibroblasts elicited a decreased trimethylation of histone H3 Lys9 (H3K9me3) on the Cxcl1 promoter (Fig. 6b); this result is consistent with transcriptional de-repression of this gene as a putative mechanism of Cxcl1 induction.
Tumor-derived factors-induced p38α-dependent expression of FAP in the lungs plays a key role in the generation of a pre-metastatic niche
Remodeling of the extracellular matrix in a pre-metastatic niche requires activation of lung fibroblasts2,4,10,32. Intra-tumoral fibroblasts exposed to TDFs are known to become activated and express several markers of this activation including the FAP protease19–21, which in normal adult tissues is predominantly expressed in bone marrow33. Intriguingly, treatment of WT (but not SA) mice with TDFs led to expression of FAP in the lungs (Fig. 6c). Furthermore, TDFs upregulated FAP cell surface levels on WT (but not SA) lung fibroblasts in vitro (Extended Data Fig. 6g) indicating the role of IFNAR1 in suppressing FAP levels.
Accordingly, TDFs-induced expression of FAP in the lungs was notably less pronounced in SA mice (Fig. 6c), or in WT mice treated with Ralimetinib (Extended Data Fig. 6h) or upon ablation of Mapk14 (Fig. 6d). In the latter case, the phenotype was promptly reversed by genetic deletion of Ifnar1 (Fig. 6d). Remarkably, genetic ablation of Fap in mice34 notably interfered with the TDFs-induced fibronectin accumulation (Fig. 6e), expression of Cxcl1, Cxcl3 and Cxcl5 (Fig. 6f), and neutrophil infiltration (Fig. 6g) in vivo. Likewise, despite exhibiting a comparable extent of p38 activation (Extended Data Fig. 6i) and of IFNAR1 downregulation (Extended Data Fig. 6j), TDFs-treated lung fibroblasts, which either completely lacked FAP or harbored catalytically inactive FAPS624A mutant (that expressed comparable to WT levels of FAP, Extended Data Fig. 6k–l) exhibited lower levels of Cxcl1/3/5 mRNA (Fig. 6h). Conversely, treatment of FAP-null fibroblasts with a recombinant, soluble and enzymatically active extracellular domain of FAP partially increased levels of Cxcl1/3/5 (Fig. 6h). Collectively, these data suggest that TDFs-induced activation of p38 and downstream pathways in lung fibroblasts induce FAP, which plays a key role in the generation of a pre-metastatic niche.
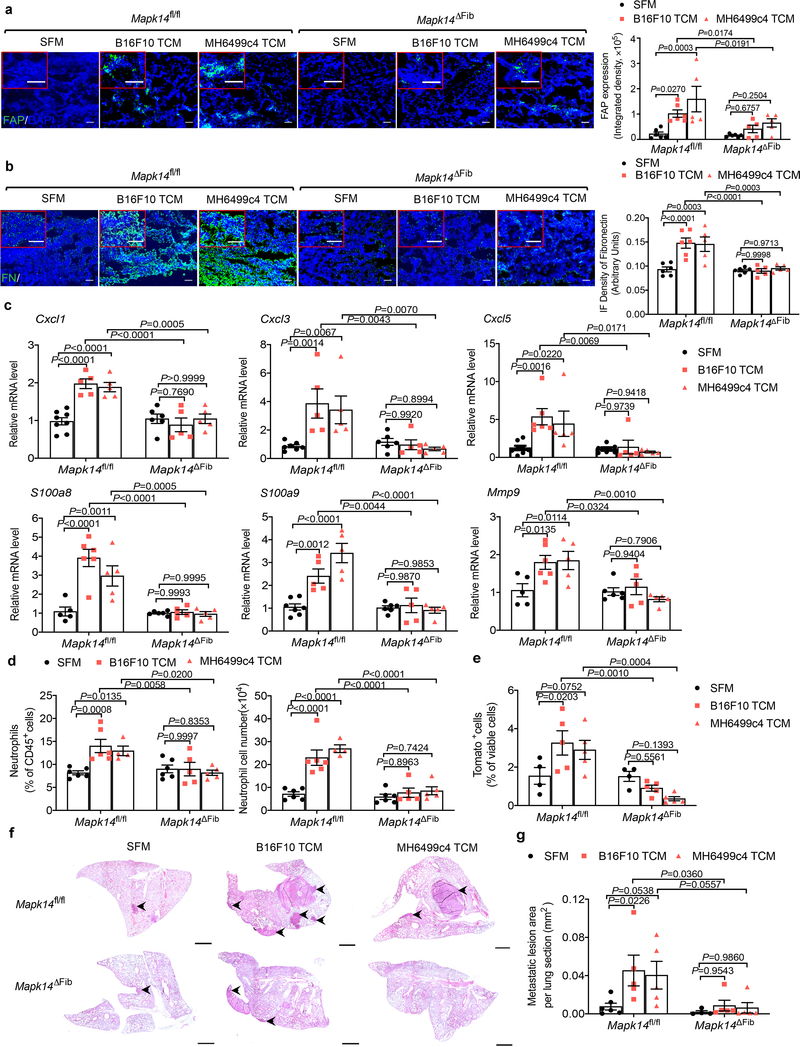
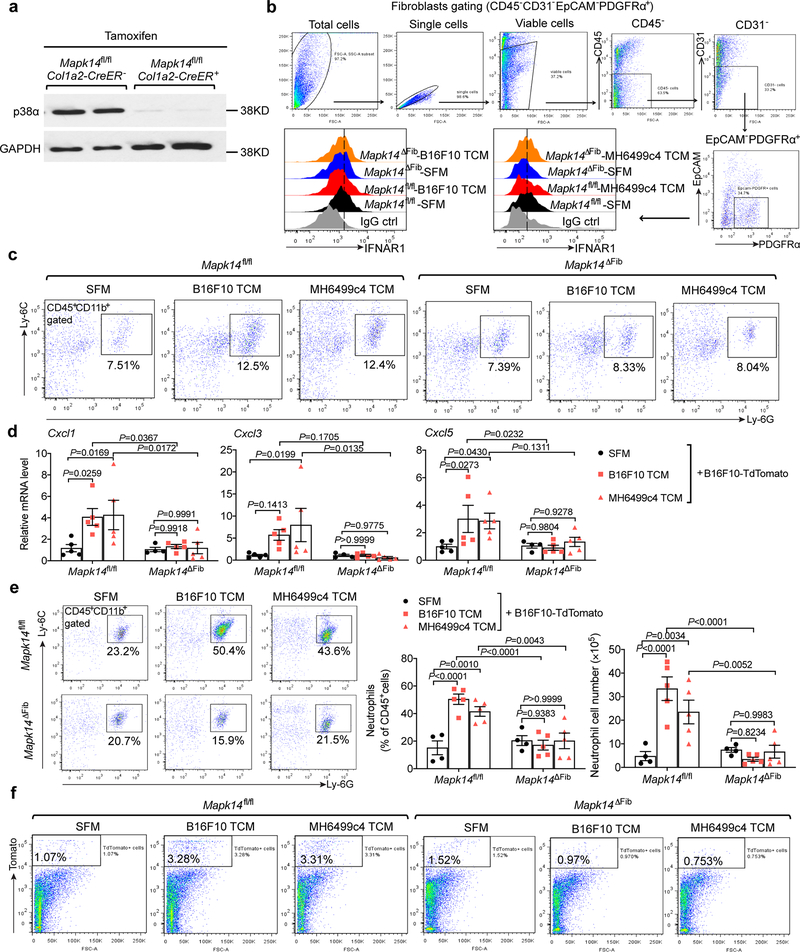
To further test this hypothesis, we ablated p38α in the fibroblasts by treating Col1a2-CreER Mapk14fl/fl mice with tamoxifen to produce Mapk14ΔFib mice (Extended Data Fig. 7a). These (and appropriate control) animals were administered with TDFs derived from metastatic B16F10 melanoma or from MH6499c4 pancreatic adenocarcinoma. Examination of the lungs of these mice revealed that ablation of p38α in the fibroblasts notably attenuated the TDFs-induced events including downregulation of IFNAR1 (Extended Data Fig. 7b), an increase in the levels of FAP (Fig. 7a) and fibronectin (Fig. 7b), expression of the niche and chemokine genes, and pulmonary neutrophil infiltration either prior or after malignant cell inoculation (Fig. 7c,d and Extended Data Fig. 7c–e). Consistent with these data, a decreased colonization of the lungs of TDFs-treated Mapk14ΔFib mice by malignant cells (Fig. 7e–g and Extended Data Fig. 7f) further indicates that p38 status in the fibroblasts is important for the formation of the pre-metastatic niche.
Figure 7. P38α deficiency specifically in fibroblasts impairs the generation of pre-metastatic niche in the lung.
a. A representative immunofluorescence staining of FAP (left) and quantification of FAP level (right) in the lung tissues of tamoxifen-treated Mapk14fl/flCol1a2-CreER- (Mapk14fl/fl) and Mapk14fl/flCol1a2-CreER+ (Mapk14ΔFib, p38α knock out specifically in fibroblasts) mice injected with SFM, B16F10 TCM, or MH6499c4 TCM (100 μl i.v., 3x per week for 3 weeks). Scale bar: 100 μm. Quantitative data shown as mean±SEM (n=6 mice for SFM and B16F10 TCM treated group, n=5 mice for MH6499c4 TCM treated group). Two-way ANOVA and Tukey’s multiple comparisons test were performed.
b. A representative immunofluorescence staining of fibronectin (left) and quantification of fibronectin level (right) in the lung tissues of Mapk14fl/fl and Mapk14ΔFib mice injected with SFM, B16F10 TCM, or MH6499c4 TCM (100 μl i.v., 3x per week for 3 weeks). Scale bar: 100 μm. Quantitative data shown as mean±SEM (n=6 mice for SFM and B16F10 TCM treated group, n=5 mice for MH6499c4 TCM treated group). Two-way ANOVA and Tukey’s multiple comparisons test were performed.
c. qPCR analysis of mRNA levels of the indicated chemokines and niche genes in the lung tissues of Mapk14fl/fl and Mapk14ΔFib mice injected with SFM, B16F10 TCM, or MH6499c4 TCM (100 μl i.v., 3x per week for 3 weeks). Data shown as mean±SEM (n=6 mice for SFM treated group, n=5 mice for B16F10 and MH6499c4 TCM treated group). Two-way ANOVA and Tukey’s multiple comparisons test were performed.
d. The percent (left) and the absolute number of neutrophils (right) analyzed by flow cytometry in the lung tissues of Mapk14fl/fl and Mapk14ΔFib mice injected with SFM, B16F10 TCM, or MH6499c4 TCM (100 μl i.v., 3x per week for 3 weeks). Data shown as mean±SEM (n=6 mice for SFM and B16F10 TCM treated group, n=5 mice for MH6499c4 TCM treated group). Two-way ANOVA and Tukey’s multiple comparisons test were performed.
e. The percent of tumor cells (TdTomato+ cells) analyzed by flow cytometry in the lung tissues of Mapk14fl/fl and Mapk14ΔFib mice injected with SFM, B16F10 TCM, or MH6499c4 TCM (100 μl i.v., 3x per week for 3 weeks) followed by intravenous injection of 5*105 B16F10-TdTomato cells. Data shown as mean±SEM (n=4 mice for SFM treated group, n=5 mice for B16F10 and MH6499c4 TCM treated group). Two-way ANOVA and Tukey’s multiple comparisons test were performed.
f. Representative lung images and the corresponding H&E-stained lung sections of Mapk14fl/fl and Mapk14ΔFib mice injected with SFM, B16F10 TCM, or MH6499c4 TCM (100 μl i.v., 3x per week for 3 weeks) followed by intravenous injection of 5*105 B16F10-TdTomato cells. Scale bar: 1 mm. Similar results were obtained from three independent experiments.
g. Quantification of metastatic lesion area in the lung sections of indicated mice as shown in f. Data shown as mean±SEM (n=6 mice for SFM treated group, n=5 mice for B16F10 and MH6499c4 TCM treated group). Two-way ANOVA and Tukey’s multiple comparisons test were performed.
Targeting p38α in the context of (neo)adjuvant therapy suppresses pulmonary melanoma metastases
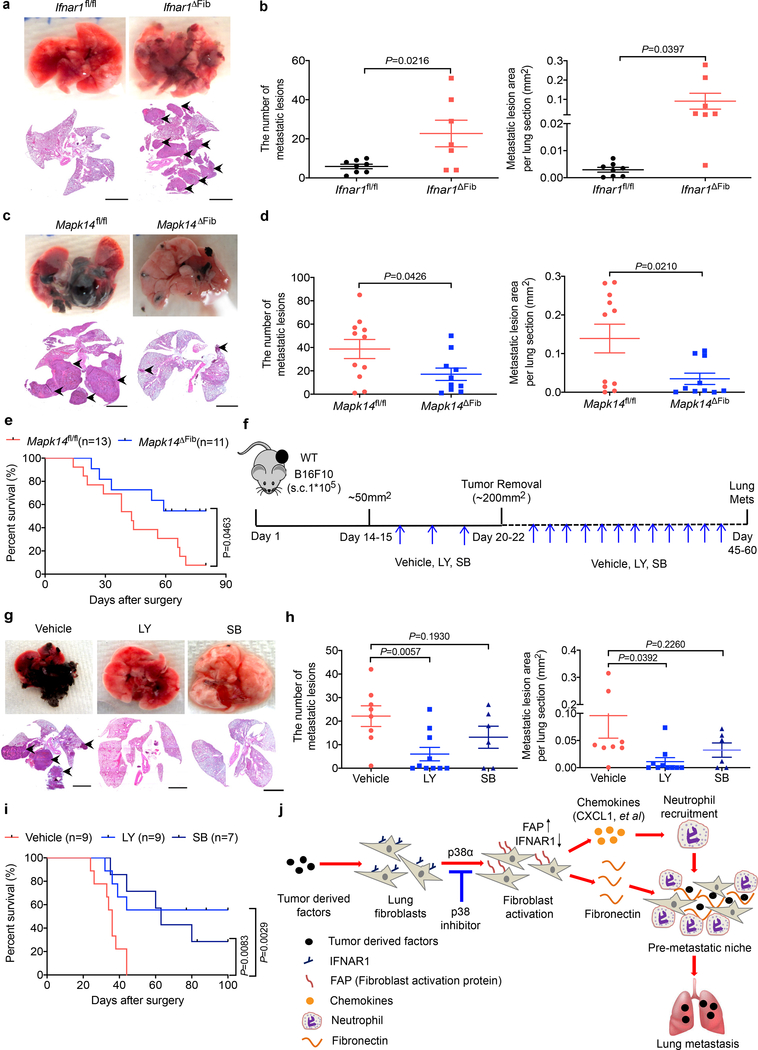
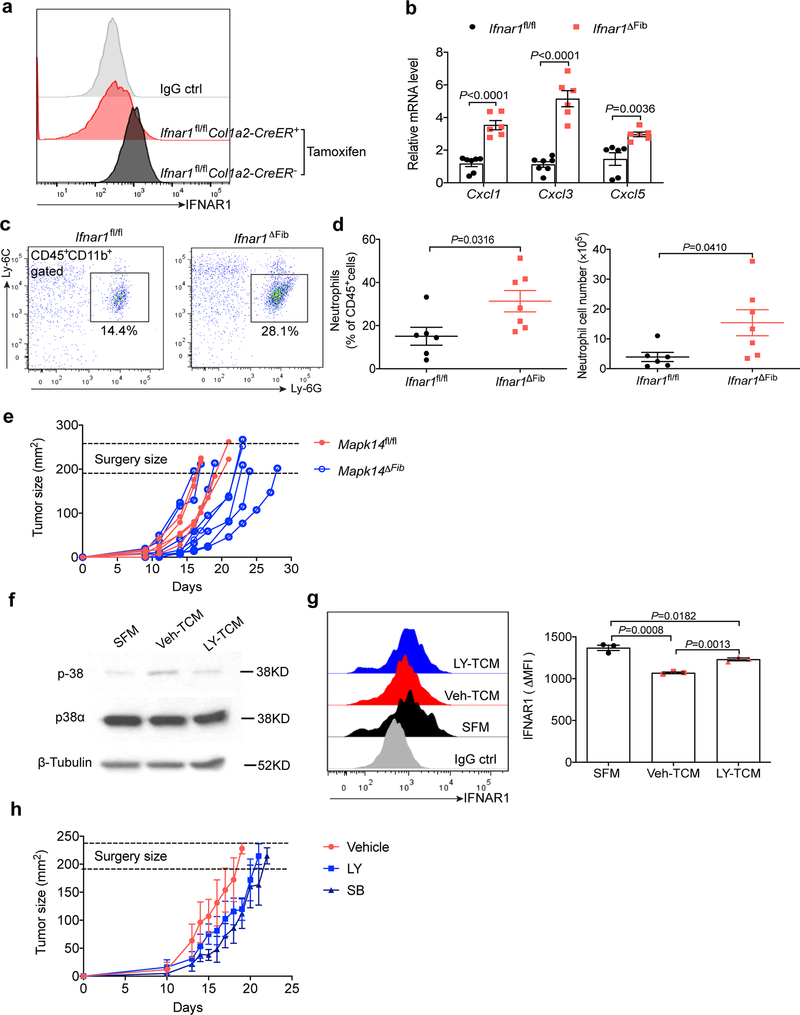
We mimicked the TDFs-induced activation of p38 and downregulation of IFNAR1 by ablating this receptor specifically in fibroblasts (Ifnar1ΔFib; achieved by tamoxifen treatment of Col1a2-CreER Ifnar1fl/fl mice, Extended Data Fig. 8a). A notably increased chemokine expression (Extended Data Fig. 8b), neutrophil infiltration (Extended Data Fig. 8c,d) as well as lung colonization by intravenously administered B16F10 cells (Fig. 8a,b) was observed in the Ifnar1ΔFib mice compared to control animals. We then assessed the importance of the p38 activation in the fibroblasts in a spontaneous metastatic process using a model wherein B16F10 tumor-bearing mice underwent survival surgery to remove primary tumors (Extended Data Fig. 8e) and then were analyzed for lung metastases and animal survival. Under these conditions, Mapk14 ablation notably decreased the number of lung lesions (Fig. 8c,d) and prolonged animal survival (Fig. 8e) further supporting an important role of p38α in fibroblasts in development of metastatic disease.
Figure 8. P38α deficiency specifically in fibroblasts attenuates lung metastasis and p38 inhibitors show efficient adjuvant therapeutic effects.
a. Representative lung images and the corresponding H&E-stained lung sections from the tamoxifen treated Ifnar1fl/flCol1a2-CreER- (Ifnar1fl/fl) and Ifnar1fl/flCol1a2CreER+ (Ifnar1ΔFib, IFNAR1 knock out specific in fibroblasts) mice after intravenous injection with B16F10 tumor cells (2×10⁵/mouse). Scale bar: 1 mm. Similar results were obtained from three independent experiments.
b. Quantification of the number of metastatic lesions and total area in the lung tissues of Ifnar1fl/fl (n=8) and Ifnar1ΔFib (n=7) mice after B16F10 tumor cells injection as shown in a. Data shown as mean±SEM. Two-tailed Unpaired t test was performed for the comparison.
c. Representative lung images and the corresponding H&E-stained lung sections from the tamoxifen-treated B16F10 tumor bearing Mapk14fl/fl and Mapk14ΔFib mice after primary tumor removal at equivalent size (~200 mm2). Scale bar: 1 mm. Similar results were obtained from three independent experiments.
d. Quantification of the number of metastatic lesions and total area in the lung tissues of Mapk14fl/fl (n=11) and Mapk14ΔFib mice (n=10) after surgery as shown in c. Data shown as mean±SEM. Two-tailed Unpaired t test was performed for the comparison.
e. Kaplan-Meier analysis of survival of B16F10 tumor bearing Mapk14fl/fl (n=13) and Mapk14ΔFib (n=11) mice after surgery by Log-rank test.
f. Schematic illustration for analysis of the effect of p38 inhibitors Ralimetinib (LY) or SB203580 (SB) as neoadjuvant/adjuvant therapeutic agents.
g. Representative lung images and the corresponding H&E-stained lung sections in the mice after surgery as described in f. Scale bar: 1 mm. Similar results were obtained from three independent experiments.
h. Quantification of the number of metastatic lesions and total area in the lung tissues of the mice after surgery as shown in g. Data shown as mean±SEM (n=8 mice in Vehicle group, n=10 mice in LY group, n=6 mice in SB group). Two-tailed Unpaired t test was performed for the comparison.
i. Kaplan-Meier analysis of survival of B16F10 tumor bearing mice after surgery as described in f by Log-rank test. Groups included 9 mice for “Vehicle” and “LY” and 7 mice for ““SB”.
j. A model highlighting the key role of p38α kinase and downstream activation of FAP in the generation of the pre-metastatic niche in lung.
This genetic evidence prompted us to examine whether pharmacologic p38 inhibitors such as Ralimetinib and SB203580 were suitable for the adjuvant therapy of melanoma (Fig. 8f). TDFs from Ralimetinib-treated B16F10 cells induced a modestly lesser activation of p38 and downregulation of IFNAR1 in vitro (Extended Data Fig. 8f,g). In vivo administration of p38 inhibitors elicited a modest effect on primary tumor growth, thus we modified the timing of the surgical resection of primary tumors to remove tumors of similar volume in all groups (Extended Data Fig. 8h) followed by additional treatments with vehicle or Ralimetinib or SB203580. Under these conditions, p38 inhibitors elicited a suppressive effect on lung metastases (Fig. 8g,h) and notably prolonged animal survival (Fig. 8i).
Discussion
Work presented here support a model (Fig. 8j) where the pro-metastatic secretome-driven activation of p38α kinase in lung fibroblasts represents a pivotal step in forming a pre-metastatic niche manifested by accumulation of fibronectin and entrapment of neutrophils. Both of these events require TDFs-stimulated expression of FAP, which also contributes to induction of the CXCR2-interacting chemokines that recruit neutrophils. Given that p38 supports growth of primary tumors35 including lung cancers36, TDFs-driven p38 activation in lung fibroblasts may generate a similar protective environment for survival and growth of cancer cells within both primary and secondary metastatic lung tumors. Indeed, p38α plays an important role in metastatic colonization (Fig. 8c–e and ref.37).
It is also plausible that epithelial and/or endothelial lung cells (implicated in the niche formation4,11) exposed to TDFs produce additional factors (e.g. cytokines) that can further activate p38α kinase in lung fibroblasts thereby amplifying the entire pro-metastatic pathway. In addition to fibroblasts, other FAP- or collagen-expressing cells (e.g. macrophages, vascular smooth muscle cells, fibrocytes or pericytes) were implicated in the development of pre-metastatic niche 38–41; the role of p38α kinase in these cells should not be ruled out.
It is likely that many diverse soluble factors and extracellular vesicles within malignant cell secretome (thoroughly catalogued in ref.3,11) are responsible for activation p38α kinase and triggering the generation of the pre-metastatic niche. For example, pro-inflammatory cytokines16, vascular endothelial growth factor42, and the ligands for the pathogen recognition receptors43 (such as lipids/protein/nucleic acids and other biomolecules present in the extracellular vesicles44–46) were all associated with p38 activation and IFNAR1 downregulation. In this context, p38 kinase acts as an integrator of inputs from malignant cells and as a key translator of these signals into downstream events leading to the formation of a pulmonary pre-metastatic niche.
Whereas genetic studies reported here emphasize the essential role of p38α/MAPK14, the importance of other p38 isoforms in the metastatic process cannot be ruled out. Phosphorylation mediated by p38α is pivotal for TDFs-driven proteolytic loss of IFNAR116,18. Consistently, current data supporting the importance of IFNAR1 inactivation in the generation of the pre-metastatic niche and stimulation of metastases are consistent with studies in melanoma and breast cancer models demonstrating that IFNAR1-null mice exhibited a greater metastatic disease27,47 and animals resistant to IFNAR1 downregulation (SA mice) were deficient in distant metastases 17,18.
TDFs induce FAP in the lungs, which otherwise express little (if any) of this protease (ref.33,48 and Fig. 6). FAP has been well characterized as a marker of activated reactive/inflammatory fibroblasts including cancer-associated fibroblasts19,21,49,50. Although FAP is found in the tumor microenvironment of many human and mouse primary tumors19,21, primary subcutaneously growing B16F10 tumors exhibited negligible levels of FAP (data not shown). It appears that fibroblasts (and possibly other cells) in the lungs display a distinct ability to respond to TDFs with an induction of FAP. Understanding of the molecular basis of these distinctive characteristics as well as how inactivation of IFNAR1 leads to FAP expression is of major interest and warrants further investigations.
FAP mediates production of fibronectin (Fig. 6); the latter along with other elements of reshaped extracellular matrix helps to entrap the recruited neutrophils in the lungs 4,10,11. Delineation of the mechanisms underlying the effects of FAP on expression of the neutrophil-attracting chemokines requires further investigation. Given that knock-in of inactive FAPS624A impeded the induction of Cxcl1/3/5 whereas treatment of FAP-null lung fibroblasts with an active recombinant FAP partially restored chemokine expression (Fig. 6h), it is plausible that protease activity of FAP toward polypeptide substrates of cell surface or/and extracellular matrix acts to produce factors stimulating expression of these chemokines. However, a non-catalytic role of FAP in neutrophil recruitment (similar to recently reported role of dipeptidase-151) should not be ruled out. Regardless of these considerations, current data clearly suggest an important mechanistic role of FAP in the formation of a pre-metastatic niche. This function is consistent with suppressed metastases of pancreatic ductal adenocarcinoma in Fap-null mice52.
Neutrophils represented the bulk of myeloid cells in the lungs from animals treated with TDFs. Elegant recent studies demonstrated that neutrophils attracted to inflamed lungs harboring already disseminated yet dormant malignant cells play a critically important role in re-awakening these cells and stimulation of lung colonization53. Future studies will be required to decipher the commonalities and dissimilarities between the mechanisms underlying stimulation of metastatic colonization in the context of either generation of a pre-metastatic niche or disruption of the dormant niche in the lungs.
Although metastases are the major cause of cancer-related patients’ death, the pace of development of therapeutic modalities targeting metastatic disease is slower than the progress achieved in the efforts to control growth of primary tumors54. It was reported that p38 inhibitors such as SB203580 administered in immune compromised settings can activate dormant cancer cells and actually stimulate lung metastatic colonization55. Yet, in the model of metastatic pulmonary colonization in immune competent mice, SB203580 decreased metastatic load56. Importantly, given the efficacy of p38 inhibitors (such as SB203580 or Ralimetinib) shown in this work, these agents might be of translational importance in the context of adjuvant or/and neo-adjuvant therapy.
Furthermore, inhibition of p38 kinase may improve the anti-tumorigenic effect of the cytotoxic lymphocytes that can kill these cancer cells57 thereby contributing to the robust anti-metastatic effects of p38 inhibitors observed in this study in an immune competent model. Whereas Ralimetinib exhibited an acceptable safety profile and modest activity in a phase I trial for aromatase refractory metastatic breast cancer58, future clinical studies are required for determining the potential of this agent (as well as other inhibitors of p38 kinases) for adjuvant treatment of metastatic melanoma and, possibly, other highly metastatic cancers.
Methods
Animal Studies
All in vivo experiments carried out on mice of C57Bl/6 background were approved by the Institutional Animal Care and Use Committee of The University of Pennsylvania. Mice were maintained in a specific pathogen-free facility in accordance with American Association for Laboratory Animal Science guidelines. Littermates Ifnar1+/+ (“WT”) and Ifnar1S526A mice (“SA”) 23 as well as Fap−/− mice34 were described previously. Ifnar1−/− mice were generously provided by Dr. Susan Weiss (University of Pennsylvania, Philadelphia, USA). Ubc9-CreER mice (gift from E. Brown, University of Pennsylvania) were crossed with Mapk14fl/fl mice (generously provided by Yibin Wang, University of California, Los Angeles) and either Ifnar1−/− mice to generate Ubc9-CreER+/0; Mapk14fl/fl; Ifnar1+/+ or Ubc9-CreER+/0; Mapk14fl/fl; Ifnar1−/− littermates. Col1a2-CreER mice (obtained from Jackson Laboratory) were crossed with Mapk14fl/fl mice or Ifnar1fl/fl mice (obtained from Jackson Laboratory) to generate Col1a2-CreER+/0; Mapk14fl/fl or Col1a2-CreER+/0; Ifnar1fl/fl littermates respectively. All these mice were viable and fertile with no reported abnormalities. The genotyping PCR primers were provided in Supplementary Table 1. Littermate animals from different cages were randomly assigned into experimental groups, which were either co-housed or systematically exposed to other groups’ bedding to ensure equal exposure to all group’s microbiota. To induce Mapk14 deletion in the whole body or specifically in fibroblasts, Mapk14fl/fl Ubc9-CreER+/0 mice or Mapk14fl/fl Col1a2-CreER+/0 mice were given tamoxifen (Sigma, dissolved in maize oil) once daily via oral gavage for 5 consecutive days at a dose of 0.2 mg/g of body weight/day.
FapS624A knock-in mice expressing FAP mutant that lacks the protease activity were generated as follows: CRISPR/CAS9 HDR targeting was used to generate a single 1 bp change at the S624 site: T to G. WT is “TCC” which codes for serine and the mutant is “GCC” which codes for alanine. The CRISPR Guide targets used were Guide#2 (sense: 5’-GATGTCTCTACAGTCCT ACGG-3’) for the F8 cell line and Guide#5 (sense: 5’-GACAATGTCTCTACAGTCCTA-3’) for the H7 cell line. The single-stranded 158mer Ultramer HDR (Homology Directed Repair template) sequence was: Sense: 5’-GTA GAC TTT AAA AAC ACA GAG ATG CTT TTG AGC TTG TGT CTG GGG CTG ACC AAT AAC AAT GTC TCT ACA GGC CTA CGG AGG TTA TGT TTC ATC CCT GGC CCT TGC ATC TGG AAC TGG TCT TTT CAA ATG TGG CAT AGC AGT GGC TCC AGT CTC CAG CT −3’. The genotyping PCR primers and sequencing primer were provided in Supplementary Table 1. The genomic DNA amplified a 677 bp fragment of both wild-type and knock-in mouse. Sequencing of this 677 bp PCR product reveals two chromatogram peaks for heterozygous (T/G), one peak in each wildtype “T” and homozygous mutant animals “G”. The S624A knock-in also generates a Stu1 restriction site (AGG|CCT) only in the knock-in mice. Digestion of PCR products with Stu1 yields 210 bp and 467 bp fragments. The FapS624A knock-in mice were backcrossed with WT C57Bl/6 mice. The homozygotes (mixed background of 129/Sv and C57Bl/6) were used for lung fibroblasts isolation.
Lung fibroblasts isolation
The lung tissues from 3–5 week old mice were washed with ice cold PBS, minced and incubated with 3 ml of solution containing Collagenase II (2 mg/ml) and DNase I (100 μg/ml) for 1 hr at 37°C. After stopping digestion by adding equal volume of FBS, cells were passed through 100 μm and 40 μm filters, spun down, washed and then re-suspended with complete media (DMEM contained 10% FBS and 1% Penicillin-Streptomycin) and cultured overnight. The next day, the non-adherent cells were thoroughly washed off with PBS and the remaining cells were cultured in complete medium for around one week before use.
Cell lines and tumor-conditioned medium (TCM) preparation
Mouse melanoma cell lines B16F1 (ATCC® CRL-6323™) and B16F10 (ATCC® CRL-6475™) were purchased from ATCC and maintained in DMEM (Gibco) supplemented with 10% FBS (HyClone) and 100 U/ml Penicillin-Streptomycin (Gibco). Mouse mammary adenocarcinoma cell line E0771 was purchased from CH3 Biosystems (Cat#940001) and maintained in RPMI 1640 medium (Gibco) supplemented with 10% FBS and 100 U/ml Penicillin-Streptomycin according to the instructions. Mouse pancreatic tumor cell clone MH6499c4 was isolated from late-stage primary tumors from a spontaneous tumor model as described before29. All the cell lines were regularly tested for Mycoplasma.
Tumor cells were plated at 150 mm cell culture plates and allowed to adhere overnight in growth medium. The next day, when the cells were 80% confluent, growth medium was removed, and the cells were washed with PBS for three times and cultured in serum free medium (SFM) for 48 hr. After that, the conditioned media were collected and filtered with a 0.22 μm filter, stored at −80°C until use. For in vivo treatment, 100 μl TCM were intravenously injected into mice three times a week for three weeks. SFM injection was set as negative control. After that, mice were euthanized and lung tissues were collected for analysis. For in vitro treatment, cells were plated at 6 well plates and treated with 1.5 ml TCM/SFM plus 0.5 ml complete medium (ratio 3:1) for 6–12 hr.
Human samples
Informed consent was obtained from all study participants. Study approval was given by the Institutional Review Board of the University of Pittsburgh. Peripheral blood was aseptically collected into (green top) Na Heparin vacutainer tubes from 40 melanoma patients (stage I, II, III or IV). The blood was then stored at room temperature (16–30°C) and processed as follows. The sample was centrifuged for 5 min at 1000 rpm and without stopping the speed was increased to 1800–2000 rpm for 20 min with the brake off. The peripheral blood leukocyte layer between the clear lymphocyte separation media and upper PBS layer was gently pipetted off. The cells were washed with PBS three times and suspended in media (Iscov’s Modified Dulbecco’s Medium, 10% Human Serum, 1% Pen-Strep solution, 1% L-Glutamine, 1% MEM non-essential amino acids 10mM, 1% HEPES Buffer solution 1M) with 10% DMSO for incubation at −80°C overnight before long term storage at −140°C. For recovery, frozen cells were thawed rapidly in a 37°C water bath. The thawed cells were slowly, but immediately, transferred into 10 ml of PBS and washed with PBS twice before lysis.
Western blot analysis
The human blood leukocytes were lysed with 60 μl RIPA lysis buffer for 30 mins on ice. All the samples were diluted into the same concentration (3 out of 40 samples had too low concentration and were excluded for the analysis). The immunoblotting analyses were carried out as previously described 16,24. The following antibodies were purchased and used : phospho-p38 (Thr180/Tyr182) (Cell Signaling Technology, Clone 28B10 cat# 9216S, 1:1000) and p38α (Santa Cruz, Clone C-20 cat#sc-535, 1:1000), GAPDH (Cell Signaling Technology, Clone D16H11 cat#5174S, 1:5000), and β-Tubulin (Cell Signaling Technology, cat#2146S, 1:5000). Goat anti-rabbit HRP-conjugated IgG (Millipore, cat#AP187P, 1:20000) or Goat anti-mouse HRP-conjugated IgG (Cell signaling technology, cat#7076S, 1:20000) were used as secondary Abs correspondingly. The intensity of the bands was analyzed by Image J and the ratio of phospho-p38 to total p38 was calculated.
Experimental tumor metastasis model
B16F1/B16F10 tumor cells in single-cell suspension (1×10⁵ in 100 μl PBS) were subcutaneously injected into the right flanks of mice. Tumors were aseptically resected at volume ~ 200 mm2. After surgery, mice were monitored and sacrificed when moribund. Lung tissues were harvested, fixed in 4% PFA-PBS (Thermo Fisher Scientific) and H&E stained for lung metastasis analysis.
For tumor cell lung colonization assay, 2×10⁵ B16F10 or 5×10⁵ B16F10-TdTomato cells per mouse were intravenously injected into mice. Around three weeks after tumor cell injection, mice were euthanized and lung tissues were harvested and fixed in 4% PFA-PBS for H&E staining.
The composite images of whole H&E stained lung sections were taken by the Leica DM6000 Widefield microscope. The number and size of tumor metastatic lesions in lung tissues were analyzed by Image J.
Adenovirus and Chemical Inhibitors treatment
Mouse CXCL1 expressing Adenovirus (Ad-CXCL1) and the control adenovirus (Ad-ctrl) were purchased from Applied Biological Materials Inc. Mice were anesthetized with ketamine & xylazine and intranasally delivered with adenoviruses (20 μl per mouse at 2×10⁸ PFU/mouse). Three days later, these mice were intravenously injected with 5×10⁵ B16F10-TdTomato cells and then continually administered with Ad-CXCL1 or Ad-ctrl every five days. At day 25 after tumor cell injection, mice were euthanized, and lung tissues were collected for FACS analysis of tumor cells (Tomato+) and fixed in 4% PFA-PBS for H&E staining.
P38 kinase inhibitor LY2228820 (Selleckchem, cat#S1494) was dissolved in 1% methylcellulose and administered by orally gavage at the dose of 10 mg/kg every other day. SB203580 hydrochloride (Tocris Biosciencec, cat#1402) were dissolved in sterile water and administered by intraperitoneal injection at the dose of 10 mg/kg every other day. CXCR2 inhibitor SB225002 (Selleckchem, cat#S7651) was dissolved in 2% DMSO + 30% PEG300 + 5% Tween 80 + ddH2O and administered by orally gavage at the dose of 10 mg/kg. For adjuvant therapy, 1×10⁵ B16F10 tumor cells were subcutaneously injected into WT mice. When the tumor size reached around 50 mm2, mice began the pre-surgical treatment with p38 inhibitors or vehicle every other day. Once the tumor size reached ~200 mm2, the primary tumors were resected. One week after surgery, the animals began the treatment with these drugs every other day for one month. When animals displayed signs of respiratory stress or became moribund, they were sacrificed and their lungs were collected and fixed in 4% PFA-PBS for H&E staining.
Immunofluorescence staining
The following antibodies were purchased and used: primary CD11b (Biolegend, Clone M1/70 cat#101202, 1:100), Fibronectin (Abcam, cat#ab23750, 1:100), IFNAR1 (Sino Biological Inc., cat#50469-RP02, 1:100), FAP (R&D, cat#AF3715, 1:100) and secondary antibodies: Alexa Fluor 488 Goat anti-Rat (Thermo Fisher Scientific, cat#A11006, 1:500) for CD11b, Alexa Fluor 488 Goat anti-Rabbit (Thermo Fisher Scientific, cat#A11070, 1:500) for fibronectin, Alexa Fluor 594 Goat anti-Rabbit (Thermo Fisher Scientific, cat#A11072, 1:500) for IFNAR1, Alexa Fluor 488 Donkey anti-sheep (Thermo Fisher Scientific, cat#A11015, 1:500) for FAP. Immunofluorescence analyses were carried out as previously described18. The images were taken using the Olympus BX51 microscope. The quantification of immunofluorescence intensity was performed by Image J. Three sections were analyzed for each mouse and six to ten fields in each section were quantified.
Flow cytometry analysis
Lung tissues were collected and washed with ice cold PBS, and then cut into small pieces, and incubated in dissociation solution with 2 mg/ml Collagenase II (MP Biomedicals), 1 mg/ml Collagenase IV (Roche) plus 100 μg/ml Dnase I (Roche) solution for around 1 hr with continuous agitation. Digestion mixture was passed through 70 μm cell strainer and washed with PBS for one time. 5 ml RBC lysis buffer was added into cells and incubated for 5 mins to lysis red blood cells. The cells were washed with PBS for one time and re-suspended with 1% BSA-PBS contained 1 mM EDTA. The isolated cells were incubated with anti-mouse CD16/CD32 antibody (Biolegend, Clone 93 cat#101302, 1:50) for 15 min at room temperature to block non-specific Fc receptor binding. Cells were then stained with cell surface markers anti-CD45-FITC (Biolegend, Clone 30-F11 cat# 103108, 1:500), anti-CD11b-APC (Biolegend, Clone M1/70 cat# 101212, 1:500), anti-Ly-6C-PE (Biolegend, Clone HK1.4 cat#128007, 1:500), anti-Ly-6G-APC/Cy7 (Biolegend, clone 1A8 cat#127624, 1:500), or anti-CD45-APC/Cy7 (Biolegend, Clone 30-F11 cat#103115, 1:500), anti-CD31-AF488 (Biolegend, Clone MEC13.3 cat#102513, 1:500), anti-EpCAM (CD326)-PE/Cy7 (Biolegend, Clone G8.8 cat#118216, 1:500), anti-PDGFRα (CD140a)-APC (Biolegend, Clone APA5 cat#135908, 1:500), anti-IFNAR1 (Biolegend, clone MAR1–5A3 cat#127312, 1:500) and incubated on ice for 30 mins. After washing with PBS, cells were re-suspended with FACS buffer contained with DAPI (1:2000) for 10 min and acquired on LSRFortessa flow cytometry (BD Biosciences). Data were analyzed with FlowJo software (Tree Star).
For IFNAR1 and FAP staining on the isolated lung fibroblasts in vitro, cells were incubated with cell dissociation buffer (Gibco, cat#13150–016) for 15 min at 37°C and dispersed into single-cell suspension. After washing with PBS, cells were stained with PE conjugated anti-mouse IFNAR1 (Biolegend, clone MAR1–5A3 cat#127312, 1:400) for 30 mins, or biotinylated anti-mouse FAP (Dr. Puré lab home-made, 1:400) for 30 mins followed by a secondary streptavidin-APC (Biolegend, cat#405207, 1:500) staining for another 30 mins. Cells stained with PE conjugated IgG-ctrl (Biolegend, clone MOPC-21 cat# 400112) or only secondary staining was as negative control. After washing, cells were re-suspended with FACS buffer contained with DAPI (1:2000) for 10 min and acquired on LSRFortessa flow cytometer (BD Biosciences). Data were analyzed with FlowJo software (Tree Star).
Immunohistochemistry (IHC) staining
The IHC staining for phospho-p38 (Thr180/Tyr182) (Cell signaling technology, Clone 12F8 cat#4631S, 1:400) of paraffin-embedded lung tissue sections was performed by the Histology core at the School of Veterinary Medicine, University of Pennsylvania. The IHC score was assessed blindly by two pathologists who calculated both the percentage of stained cells and the intensity of staining as follows: the proportion of positive cells was estimated and given a percentage score on a scale from 1 to 6 (1 = 1–10%; 2 = 11–20%; 3 = 21–40%; 4 = 41–60%; 5 = 61–80%; and 6 =81–100%). The average intensity of the positively staining cells was given an intensity score from 0 to 3 (0 = no staining; 1 = weak, 2 = moderate, and 3 = strong staining). The final IHC score was then calculated by multiplying the percentage score by the intensity score to yield a minimum value of 0 and a maximum value of 18.
Ex vivo immunosuppression assay
Granulocytes (Ly-6G+) were purified from the lungs of mice that were administered with B16F10 TCM or from the spleens of MC38 tumor-bearing mice using MACS Separation kit (Miltenyi Biotec). 1×10⁵ isolated granulocytes cells were incubated with OT-1 WT splenocytes by different ratio 1:1, 1:2, 1:4. The mixed cells were co-cultured in 96 well plate with SIINFEKL (0.5 ng/μl) peptide stimulation for 48 hr, and then 3H thymidine (PerkinElmer) was added (1 μl/well for 24 hr). The radioactivity of samples was counted with a TopCount NXT instrument (PerkinElmer) as previously described59.
Quantitative RT–PCR
Total RNA were extracted by using Trizol Reagent (Invitrogen). High-Capacity RNA-to-cDNA Kit (Applied Biosystems) was used to make cDNA. Real-time PCR was performed by using SYBR Green Master Mix reagents (Applied Biosystems). The expression of each gene was calculated based on the cycle threshold (CT), set within the linear range of DNA amplification. The relative expression was calculated by Ct method, with normalization of raw data to a housekeeping gene (Gapdh). The primer sequences were provided in Supplementary Table 2.
Purification of FAP extracellular domain (ECD)
The 6xHistidine-tagged FAP ECD recombinant protein was expressed in 293 T cells and purified on a Ni-NTA agarose column (Qiagen, cat#30210). Briefly, 293 T cells expressing His-FAP ECD were expanded in T225 flasks at ~80% confluency (~1.5×10⁶ cells). Cells were harvested and resuspended in 90 ml 293 SFM II (Invitrogen, cat#11686029), and incubated at 37°C and 8% CO2 with vigorous shaking. Cells were harvested, spun down and resuspended in 30 ml fresh media every two days until the cells looked round and bright. 15 ml cells (1.5–2×10⁶cells/ml) were added into the growth compartment and 975 ml media into the nutrient compartment in the bioreactor flask after equilibrium by adding 25 ml media and incubation at 37°C for 15 min. After 72 hr, cells were harvested and the supernatant was collected and subjected to dialysis against PBS. The dialyzed supernatant was incubated with washed Ni-Agarose slurry (Qiagen, cat#30210) for 1 hr at 4°C with rocking. The incubation mix was added into a column followed by washing and elution with the corresponding buffer according to the manufactures’ instructions. Purity of this protein was assessed by SDS-PAGE followed by silver staining. FAP ECD was used in the in vitro assays at 0.3 μg/ml.
Chromatin immunoprecipitation (ChIP) analysis
ChIP analysis was performed in the lung fibroblasts treated with TCM or SFM for 12 hr as previously described29 using the following antibodies: H3K4me3 (Abcam, cat#ab8580), H3K9me3 (Abcam, cat#ab8898), isotype control (Abcam, cat#ab171870). The following primers were used as described31: Cxcl1 promoter region, 5′-CCTCTTCACATGCCTCCCTG-3′ (forward) and 5′-CGGGGATGGAAGCTTGTCTT-3′ (reverse); Actb promoter region, 5′-CCTCTGGGTGTGGATGTCAC-3′ (forward) and 5′-TGTCCATTCAATCCAGGCCC-3′ (reverse).
RNA Sequencing
WT and SA mice were intravenously injected with B16F10 TCM three times a week for three weeks. After injection, mice were euthanized. Lung tissues were collected and snap freezed in liquid nitrogen. Total RNA of the lung tissue was isolated with miRNeasy mini kit (QIAGEN). Biotin-labeled cRNA preparations were obtained using TargetAmp™-Nano Labeling Kit (Epicentre) as recommended by the manufacturer. Thereafter 0.75 μg cRNA was hybridized to Illumina Sentrix Mouse-6 v.1 BeadChips, which were scanned with an Illumina BeadStation 500 (both from Applied Biosystems-Life Technologies Inc.). Data were collected with Illumina BeadStudio 3.1.1.0 software, and statistical analyses were conducted on the IlluminaGUI R-package. Gene Set Enrichment Analysis (GSEA) was performed for overlap with curated data sets (C5, H) in MSigDB using the web interface available at http://www.broadinstitute.org/gsea/msigdb/index.jsp.
Statistics and reproducibility
All described results are representative of at least three independent experiments. Statistical analyses and the number of samples (n) were described in detail for each figure panel. No statistical method was used to predetermine sample size. Data were presented as average ± S.E.M. Statistical analysis was performed using Microsoft Excel (Microsoft) or GraphPad Prism 8 software (GraphPad Prism Software Inc). Two-tailed Unpaired Student t test was used for the comparison between two groups. One-way ANOVA or two-way ANOVA analysis followed by the Sidak’s or Tukey’s test were used for the multiple comparisons. Repeated-measure two-way ANOVA (mixed-model) followed by the Sidak’s multiple comparisons was used for the analysis of tumor growth curve. The Kaplan-Meier curves were used to depict the survival function from lifetime data for mice and human patients; the Log-rank test or Gehan-Breslow-Wilcoxon test was used to analyze the differences between the groups. The Fisher’s test was used for other comparisons. A value of P <0.05 was considered significant. Mice that died within 24 h after surgery were assumed to have died because of procedure-related complications and were excluded from analysis. In Western blot analysis of human blood leukocytes, three samples were excluded due to the low amount of protein (< 1μg). No other data were excluded. The experiments were not randomized, except that the mice were randomly grouped before treatment. Investigators were not blinded to allocation during the experiments and outcome assessment except for the IHC score analysis.
Reporting Summary
Further information on research design is available in the Nature Research Reporting Summary linked to this article.
Data availability statement
RNA-sequencing data that support the findings of this study have been deposited in the Gene Expression Omnibus (GEO) under accession code GSE133781. Source data for Figs. 1–8 and Extended Data Figs. 1–8 have been provided as Source Data files. All other data supporting the findings of this study are available from the corresponding author upon reasonable request.
Extended Data
Extended Data Fig. 1: Characterization of the metastasis in the lung tissues of B16F1 and B16F10 tumor bearing mice.
a. The primary tumor growth in WT mice s.c injected with 1*105 B16F1 or B16F10 tumor cells prior to surgery at equivalent tumor size (~200 mm2). Data shown as mean±SEM (n=7 mice per group). Repeated-measure two-way ANOVA and Sidak’s multiple comparisons test were performed. b. A representative lung images and the corresponding H&E stained lung sections in the B16F1 and B16F10 tumor bearing mice after surgery. Scale bar: 1 mm. This experiment was repeated three times independently with similar results. c. Quantification of the number of metastatic lesions and total area in the lung tissues from B16F1 and B16F10 tumor bearing mice after surgery as shown in b. Data shown as mean±SEM (n=7 mice per group). Two-tailed Unpaired t test was performed for the comparison. d. The primary tumor growth in the B16F1 tumor bearing mice treated with SFM or B16F10 TCM prior to surgery (100 μl every other day until primary tumor removal upon reaching the size ~200 mm2). n=5 mice per group.
Extended Data Fig. 2: Tumor derived factors induce p38 activation and IFNAR1 downregulation.
a. A representative western blot analysis of p-p38 and total p38 in the leukocytes isolated from the peripheral blood of melanoma patients with metastasis (Met) and without metastasis (Non-Met). The ratio of p-38 to p38 was shown at bottom for each patient. This experiment was repeated three times independently with similar results. b. A representative flow cytometry histogram (left) and the quantification of surface IFNAR1 level (right) in WT lung fibroblasts 2 hr after SFM, conditioned media from normal lung fibroblasts (FCM), or TCM from different tumor cells including B16F1, B16F10, MH6499c4, and E0771. Quantitative data shown as mean±SEM (n=3 biologically independent samples). Two- tailed Unpaired t test was performed for the comparisons between two groups. c. A representative immunofluorescence staining of IFNAR1 (left) and the quantification of IFNAR1 level (right) in the lung tissues from WT mice treated with SFM, B16F1 TCM or B16F10 TCM (100 μl i.v., 3x per week for 3 weeks). Scale bar: 100 μm. Quantitative data shown as mean±SEM (n=10 mice per group). Two-tailed Unpaired t test was performed for the comparisons between two groups. d. Representative lung images and the corresponding H&E-stained lung sections in WT and Ifnar1−/− B16F1 tumor bearing mice after surgery. Lung metastases were analyzed around 30–60 days after primary tumor removal upon reaching the size ~200mm2. Scale bar: 1 mm. This experiment was repeated three times independently with similar results. e. Quantification of the number of metastatic lesions and total area in the lung tissues from WT (n=13 mice) and Ifnar1−/− (n=14 mice) B16F1 tumor bearing mice after surgery. Data shown as mean±SEM. Two-tailed Unpaired t test was performed for the comparison. f. Kaplan-Meier analysis of survival of WT (n=9 mice) and Ifnar1−/− (n=10 mice) B16F1 tumor bearing mice after surgery by Log-rank test.
Extended Data Fig. 3: p38α inhibition or gene deletion impede tumor derived factors-induced downregulation of IFNAR1.
a. A representative flow cytometry analysis (left) and the quantification of surface IFNAR1 level (right) in WT lung fibroblasts pretreated with vehicle (DMSO) or p38 inhibitor Ralimetinib (LY2228820, 4 μM for 2 hr) followed by SFM, or B16F10 TCM treatment for additional 2 hr. Quantitative data shown as mean±SEM (n=5,and n=6 biologically independent samples in Vehicle and LY treated group). Two-way ANOVA and Sidak’s multiple comparisons test were performed. b. A representative western blot analysis of total p38α protein level in the lung tissues of Mapk14fl/fl Ubc9-CreER- and Mapk14fl/flUbc9-CreER+ mice after tamoxifen treatment. Similar results were obtained from three independent experiments. c. A representative immunofluorescence staining of IFNAR1 (left) and the quantification of IFNAR1 level (right) in the lung tissues from Mapk14 competent mice (Mapk14fl/fl) and Mapk14 deleted mice (Mapk14Δ/Δ) treated with SFM or B16F10 TCM (100 μl i.v., 3x per week for 3 weeks). Scale bar: 100 μm. Quantitative data shown as mean±SEM (n=5 mice per group). Two-way ANOVA and Sidak’s multiple comparisons test were performed.
Extended Data Fig. 4: p38α-mediated IFNAR1 downregulation drives the formation of pre-metastatic niche in the lungs.
a. A representative immunofluorescence staining of IFNAR1 (left) and the quantification of IFNAR1 level (right) in the lung tissues from WT and SA mice treated with SFM or B16F10 TCM. Scale bar: 100 μm. Quantitative data shown as mean±SEM (n=5 mice per group). Two-way ANOVA and Sidak’s multiple comparisons test were performed. b. qPCR analysis of mRNA levels of indicated interferon stimulated genes in the lung tissues of WT and SA mice treated with SFM or B16F10 TCM. Data shown as mean±SEM (n=3, n=4 mice in SFM and TCM treated group respectively). Two-way ANOVA and Tukey’s multiple comparisons test were performed. c. Schematic illustration for analysis of the lung metastasis in the B16F1 tumor bearing SA mice treated with SFM or B16F10 TCM (100 μl i.v. every other day until primary tumor removal upon reaching the size ~200 mm2). d. The primary tumor growth of B16F1 in SA mice treated with SFM or B16F10 TCM prior to surgery. Data shown as mean±SEM (n=4 mice per group). Repeated-measure two-way ANOVA and Sidak’s multiple comparisons test were performed. e. Representative lung images and the corresponding H&E-stained lung sections of indicated mice as described in c. Scale bar: 1 mm. Similar results were obtained from three independent experiments. f. Quantification of the number of metastatic lesions and total area in the lung tissues from B16F1 tumor bearing SA mice treated with SFM (n=10 mice) or B16F10 TCM (n=9 mice) after surgery. Data shown as mean±SEM. Two-tailed Unpaired t test was performed for the comparison. g. Kaplan-Meier analysis of survival of B16F1 tumor bearing SA mice treated with SFM (n=9 mice) or B16F10 TCM (n=9 mice) after surgery by Log-rank test. h. Representative flow cytometry analysis of tumor cells (TdTomato+) in the lung tissues of WT, SA, and tamoxifen treated-Mapk14fl/flUbc9-CreER- (Mapk14fl/fl) and Mapk14fl/flUbc9-CreER+ (Mapk14Δ/Δ) mice pretreated with SFM or B16F10 TCM followed by intravenous injection of 5*105 B16F10-TdTomato cells. Similar results were obtained from three independent experiments.
Extended Data Fig. 5: p38α-mediated IFNAR1 downregulation induces CXCL1/CXCL3/CXCL5-CXCR2 axis which is critical for the neutrophil recruitment.
a. Representative flow cytometry analysis of myeloid cell subpopulations (above) and the quantification of these cell subpopulations (below) in the lung tissues of WT and SA mice treated with SFM or B16F10 TCM. Quantitative data shown as mean±SEM (n=4 mice per group). Two-way ANOVA and Sidak’s multiple comparisons test were performed. b. Representative flow cytometry analysis of the purity of the isolated granulocytes from lung tissues of WT and SA mice treated with B16F10 TCM. Similar results were obtained from three independent experiments. c. Antigen-specific proliferation of CD8+ T cells in the presence of isolated granulocytes (Ly-6G+) from the lung tissues of WT and SA mice treated with B16F10 TCM at a ratio of 1:1, 1:2 or 1:4 measured as the uptake of 3H thymidine and presented relative to that in the absence of granulocytes which set as 100%. Splenic PMN-MDSC isolated from MC38 tumor-bearing mice served as a positive control for the suppression. Data shown as mean±SEM (n=6 mice for WT and SA group, n=3 mice for PMN-MDSC). Two-way ANOVA and Sidak’s multiple comparisons test were performed. d. qPCR analysis of mRNA levels of the indicated chemokines in WT lung fibroblasts 6 hr after SFM, conditioned media from normal lung fibroblasts (FCM), or TCM from different tumor cells including B16F1, B16F10, MH6499c4, and E0771. Data shown as mean±SEM (n=3 biologically independent samples). Two-tailed Unpaired t test was performed for the comparisons between two groups. e. qPCR analysis of mRNA levels of the indicated chemokines in the lung tissues of WT mice treated with SFM (n=3 mice), B16F1 TCM (n=4 mice) or B16F10 TCM (n=4 mice). Data shown as mean±SEM. Two-way ANOVA and Tukey’s multiple comparisons test were performed. f. Representative flow cytometry analysis (left) and the quantification of percent of neutrophils (right) in the lung tissues of WT mice treated with SFM (n=5 mice), B16F10 TCM plus vehicle (n=4 mice) or CXCR2 inhibitor (n=5 mice). Quantitative data shown as mean±SEM. Two-tailed Unpaired t test was performed for the comparisons between two groups. g. qPCR analysis of mRNA level of Cxcl1 in the lung tissues of SA mice intranasally administered with control (n=3 mice) or CXCL1 (n=7 mice) expressing adenovirus. Data shown as mean±SEM. Two-tailed Unpaired t test was performed for the comparison. h. The percent of total myeloid cells in the lung tissues of SA mice intranasally administered with control (n=4 mice) or CXCL1 (n=5 mice) expressing adenovirus. Data shown as mean±SEM. Two-tailed Unpaired t test was performed for the comparison.
Extended Data Fig. 6: p38α-mediated IFNAR1 downregulation induces FAP expression.
a. A representative western blot analysis of p-p38 and total p38 in the lung fibroblasts of WT, SA, Ifnar1 null (Ifnar1−/−), Mapk14 deletion (Mapk14Δ/Δ), Mapk14 deletion along with Ifnar1 null (Mapk14Δ/Δ Ifnar1−/−) 1 hr after SFM or B16F10 TCM treatment in vitro. b. A representative flow cytometry analysis of surface IFNAR1 level in the lung fibroblasts of WT, SA, Ifnar1−/−, Mapk14Δ/Δ, Mapk14Δ/Δ Ifnar1−/− 2 hr after SFM or B16F10 TCM treatment in vitro. c. The decay of Cxcl1 mRNA in WT and SA lung fibroblasts treated with SFM, or B16F10 TCM for 12 hr, then exposed to Actinomycin D (5 μg/ml) to terminate transcription. Cxcl1 mRNA level was determined by qPCR. Data shown as mean±SEM (n=3 independent experiments). Repeated-measure two-way ANOVA and Sidak’s multiple comparisons test were performed. d. ChIP analysis of H3K4me3 binding to the Cxcl1 promoter in the isolated WT and SA lung fibroblasts treated with SFM or B16F10 TCM for 12 hr. Data shown as mean±SEM (n=3 independent experiments). Two-way ANOVA and Sidak’s multiple comparisons test were performed. e. The mRNA level of Setdb2 in WT and SA lung fibroblasts treated with PBS or murine IFNβ (1000 IU/ml) for 4 hr. Data shown as mean±SEM (n=3 biologically independent samples). Two-way ANOVA and Sidak’s multiple comparisons test were performed. f. The mRNA level of Setdb2 in WT and SA lung fibroblasts treated with SFM or B16F10 TCM for 4 hr. Data shown as mean±SEM (n=3 biologically independent samples). Two-way ANOVA and Sidak’s multiple comparisons test were performed. g. A representative flow cytometry histogram (left) and the quantification of FAP expression (right) in the lung fibroblasts of WT, SA, and Fap−/− 24 hr after SFM or B16F10 TCM treatment. Quantitative data shown as mean±SEM (n=3 biologically independent samples). Two-way ANOVA and Sidak’s multiple comparisons test were performed. h. A representative immunofluorescence staining of FAP (left) and the quantification of FAP+ cells (right) in the lung tissues from WT mice treated with B16F10 TCM plus vehicle or p38 inhibitor LY2228820. Scale bar: 100 μm. Quantitative data shown as mean±SEM (n=5 mice per group). Two-tailed Unpaired t test was performed for the comparison. i. A representative western blot analysis of p-p38 and total p38 in the lung fibroblasts of WT and Fap−/− 1 hr after SFM or B16F10 TCM treatment in vitro. j. A representative flow cytometry histogram (above) and the quantification of surface IFNAR1 level (bottom) in the lung fibroblasts of WT and Fap−/− 2 hr after SFM or B16F10 TCM treatment in vitro. Quantitative data shown as mean±SEM (n=3 biologically independent samples). Two-way ANOVA and Sidak’s multiple comparisons test were performed. k. Genotyping of FapS624A mutant mice. A 677 bp amplicon was amplified by PCR both in the wild-type and FapS624A knock-in mouse. The 1 bp change generated a Stu1 restriction site (AGG|CCT) only in the knock-in mice. The PCR products were cleaned up and then digested with Stu1 producing the cut size of 210 bp and 467 bp. l. A representative flow cytometry analysis of FAP levels in the adult dermal fibroblasts isolated from Fap+/+, Fap−/−, FapS624A/S624A and FapS624A/+ mice. The experiments in a, b, i, k, l were repeated three times independently with similar results, and the results of one representative experiment are shown.
Extended Data Fig. 7: P38α expression in fibroblasts is critical for the generation of pre-metastatic.
a. Representative western blot analysis of p38α protein level in the isolated lung fibroblasts from tamoxifen-treated Mapk14fl/flCol1a2-CreER- (Mapk14fl/fl) and Mapk14fl/flCol1a2-CreER+ (Mapk14ΔFib, p38α knock out specific in fibroblasts) mice. b. A representative flow cytometry gating and histogram of IFNAR1 level in the lung fibroblasts of Mapk14fl/fl and Mapk14ΔFib mice injected with SFM, B16F10 TCM, or MH6499c4 TCM. c. Representative flow cytometry analysis of neutrophils in the lung tissues of Mapk14fl/fl and Mapk14ΔFib mice injected with SFM, B16F10 TCM, MH6499c4 TCM. d. qPCR analysis of the indicated chemokines in the lung tissues of Mapk14fl/fl and Mapk14ΔFib mice pretreated with SFM, B16F10 TCM, or MH6499c4 TCM followed by intravenous injection of 5*105 B16F10-TdTomato cells. Data shown as mean±SEM (n=4 mice for SFM treated Mapk14ΔFib group, n=5 mice for all the other groups). Two-way ANOVA and Tukey’s multiple comparisons test were performed. e. Representative flow cytometry analysis (left) and the quantification of percent and absolute number (right) of neutrophils in the lung tissues of Mapk14fl/fl and Mapk14ΔFib mice pretreated with SFM, B16F10 TCM, MH6499c4 TCM followed by intravenous injection of 5*105 B16F10-TdTomato cells. Quantitative data shown as mean±SEM (n=4 mice for SFM treated group, n=5 mice for TCM treated group). Two-way ANOVA and Tukey’s multiple comparisons test were performed. f. Representative flow cytometry analysis of tumor cells (TdTomato+) in the lung tissues of Mapk14fl/fl and Mapk14ΔFib mice pretreated with SFM, B16F10 TCM, or MH6499c4 TCM followed by intravenous injection of 5*105 B16F10-TdTomato cells. The experiments in a, b, c, f were repeated three times independently with similar results, and the results of one representative experiment are shown.
Extended Data Fig. 8: The effect of p38α deficiency specifically in fibroblasts and p38 inhibitors on the primary tumor.
a. Representative flow cytometry analysis of IFNAR1 level in the isolated lung fibroblasts from tamoxifen treated Ifnar1fl/flCol1a2-CreER- (Ifnar1fl/fl) and Ifnar1fl/flCol1a2-CreER+ (Ifnar1ΔFib, Ifnar1 knock out specific in fibroblasts) mice. Similar results were obtained from three independent experiments. b. qPCR analysis of the indicated chemokines in the lung tissues of Ifnar1fl/fl (n=7 mice) and Ifnar1ΔFib mice (n=6 mice) after intravenous injection with 5*105 B16F10-TdTomato cells. Data shown as mean±SEM. Two-way ANOVA and Sidak’s multiple comparisons test were performed. c. Representative flow cytometry analysis of neutrophils in the lung tissues of Ifnar1fl/fl and Ifnar1ΔFib mice after intravenous injection with 5*105 B16F10-TdTomato cells. Similar results were obtained from three independent experiments. d. Quantification of the percent (left) and the absolute number of neutrophils (right) in the lung tissues as described in c. Data shown as mean±SEM (n=6 mice for Ifnar1fl/fl group, n=7 for Ifnar1ΔFib group). Two-tailed Unpaired t test was performed for the comparison. e. The primary tumor growth of B16F10 in the Mapk14fl/fl (n=5 mice) and Mapk14ΔFib (n=8 mice) mice s.c injected with 1×10⁵ B16F10 tumor cells prior to surgery at equivalent tumor size (~200 mm2). f. A representative western blot analysis of p-p38 and total p38 in the WT lung fibroblasts 1 hr after treatment with SFM, or TCM from B16F10 tumor cells pretreated with vehicle (DMSO) or p38 inhibitor LY2228820 (4 μM) for 24 hr. Similar results were obtained from three independent experiments. g. A representative flow cytometry histogram (left) and the quantification of surface IFNAR1 level (right) in WT lung fibroblasts 2 hr after treatment with SFM, or TCM from B16F10 tumor cells pretreated with vehicle (DMSO) or p38 inhibitor LY2228820 (4 μM) for 24 hr. Quantitative data shown as mean±SEM (n=3 biologically independent samples). Two- tailed Unpaired t test was performed for the comparisons between two groups. h. Primary tumor growth of B16F10 in mice that received vehicle, LY2228820 (LY), or SB203580 (SB) treatment prior to surgery at equivalent tumor size (~200 mm2). Data shown as mean±SEM (n=6 mice per group).
Supplementary Material
Acknowledgements
This work was supported by the PA Department of Health 2017 Health Research Formula Fund (to S.Y.F.), by the NIH/NCI R01 grants CA216936 (to S.Y.F. and D.I.G.), CA092900 (to S.Y.F.), CA229803 (to B.Z.S) and P01 CA165997 grant (to C.K., J.A.D., and S.Y.F.) as well as by additional support from F32 CA206431 (to A.O.), T32 CA009140 (to K.V.K.) and CA121973 (to J.M.K.). We thank Y. Wang, S. Weiss and E. Brown for the reagents, and A. Gamero (Temple University) and the members of the Gabrilovich, Fuchs, Diehl, and Koumenis labs for critical suggestions.
Footnotes
Competing Interests Statement
The authors have declared that no conflict of interest exists
References
- 1.Joyce JA & Pollard JW Microenvironmental regulation of metastasis. Nat Rev Cancer 9, 239–252 (2009). [DOI] [PMC free article] [PubMed] [Google Scholar]
- 2.Kaplan RN, et al. VEGFR1-positive haematopoietic bone marrow progenitors initiate the pre-metastatic niche. Nature 438, 820–827 (2005). [DOI] [PMC free article] [PubMed] [Google Scholar]
- 3.Peinado H, Lavotshkin S & Lyden D The secreted factors responsible for pre-metastatic niche formation: old sayings and new thoughts. Semin Cancer Biol 21, 139–146 (2011). [DOI] [PubMed] [Google Scholar]
- 4.Peinado H, et al. Pre-metastatic niches: organ-specific homes for metastases. Nat Rev Cancer 17, 302–317 (2017). [DOI] [PubMed] [Google Scholar]
- 5.Francia G, Cruz-Munoz W, Man S, Xu P & Kerbel RS Mouse models of advanced spontaneous metastasis for experimental therapeutics. Nat Rev Cancer 11, 135–141 (2011). [DOI] [PMC free article] [PubMed] [Google Scholar]
- 6.Woodard PK, Dehdashti F & Putman CE Radiologic diagnosis of extrathoracic metastases to the lung. Oncology (Williston Park) 12, 431–438; discussion 441–432, 444 (1998). [PubMed] [Google Scholar]
- 7.Kim S, et al. Carcinoma-produced factors activate myeloid cells through TLR2 to stimulate metastasis. Nature 457, 102–106 (2009). [DOI] [PMC free article] [PubMed] [Google Scholar]
- 8.Peinado H, et al. Melanoma exosomes educate bone marrow progenitor cells toward a pro-metastatic phenotype through MET. Nat Med 18, 883–891 (2012). [DOI] [PMC free article] [PubMed] [Google Scholar]
- 9.Liu Y, et al. Tumor Exosomal RNAs Promote Lung Pre-metastatic Niche Formation by Activating Alveolar Epithelial TLR3 to Recruit Neutrophils. Cancer Cell 30, 243–256 (2016). [DOI] [PubMed] [Google Scholar]
- 10.Erler JT, et al. Hypoxia-induced lysyl oxidase is a critical mediator of bone marrow cell recruitment to form the premetastatic niche. Cancer Cell 15, 35–44 (2009). [DOI] [PMC free article] [PubMed] [Google Scholar]
- 11.Liu Y & Cao X Characteristics and Significance of the Pre-metastatic Niche. Cancer Cell 30, 668–681 (2016). [DOI] [PubMed] [Google Scholar]
- 12.Arthur JS & Ley SC Mitogen-activated protein kinases in innate immunity. Nat Rev Immunol 13, 679–692 (2013). [DOI] [PubMed] [Google Scholar]
- 13.Cuadrado A & Nebreda AR Mechanisms and functions of p38 MAPK signalling. Biochem J 429, 403–417 (2010). [DOI] [PubMed] [Google Scholar]
- 14.Hui L, Bakiri L, Stepniak E & Wagner EF p38alpha: a suppressor of cell proliferation and tumorigenesis. Cell Cycle 6, 2429–2433 (2007). [DOI] [PubMed] [Google Scholar]
- 15.Wagner EF & Nebreda AR Signal integration by JNK and p38 MAPK pathways in cancer development. Nat Rev Cancer 9, 537–549 (2009). [DOI] [PubMed] [Google Scholar]
- 16.Huangfu WC, et al. Inflammatory signaling compromises cell responses to interferon alpha. Oncogene 31, 161–172 (2012). [DOI] [PMC free article] [PubMed] [Google Scholar]
- 17.Katlinskaya YV, et al. Suppression of Type I Interferon Signaling Overcomes Oncogene-Induced Senescence and Mediates Melanoma Development and Progression. Cell Rep 15, 171–180 (2016). [DOI] [PMC free article] [PubMed] [Google Scholar]
- 18.Ortiz A, et al. An Interferon-Driven Oxysterol-Based Defense against Tumor-Derived Extracellular Vesicles. Cancer Cell 35, 33–45 e36 (2019). [DOI] [PMC free article] [PubMed] [Google Scholar]
- 19.Fearon DT The carcinoma-associated fibroblast expressing fibroblast activation protein and escape from immune surveillance. Cancer Immunol Res 2, 187–193 (2014). [DOI] [PubMed] [Google Scholar]
- 20.Kraman M, et al. Suppression of antitumor immunity by stromal cells expressing fibroblast activation protein-alpha. Science 330, 827–830 (2010). [DOI] [PubMed] [Google Scholar]
- 21.Pure E & Blomberg R Pro-tumorigenic roles of fibroblast activation protein in cancer: back to the basics. Oncogene 37, 4343–4357 (2018). [DOI] [PMC free article] [PubMed] [Google Scholar]
- 22.Fidler IJ & Nicolson GL Organ selectivity for implantation survival and growth of B16 melanoma variant tumor lines. J Natl Cancer Inst 57, 1199–1202 (1976). [DOI] [PubMed] [Google Scholar]
- 23.Bhattacharya S, et al. Triggering ubiquitination of IFNAR1 protects tissues from inflammatory injury. EMBO Mol Med 6, 384–397 (2014). [DOI] [PMC free article] [PubMed] [Google Scholar]
- 24.Bhattacharya S, et al. Role of p38 protein kinase in the ligand-independent ubiquitination and down-regulation of the IFNAR1 chain of type I interferon receptor. J Biol Chem 286, 22069–22076 (2011). [DOI] [PMC free article] [PubMed] [Google Scholar]
- 25.Tcyganov E, Mastio J, Chen E & Gabrilovich DI Plasticity of myeloid-derived suppressor cells in cancer. Curr Opin Immunol 51, 76–82 (2018). [DOI] [PMC free article] [PubMed] [Google Scholar]
- 26.Zhou J, Nefedova Y, Lei A & Gabrilovich D Neutrophils and PMN-MDSC: Their biological role and interaction with stromal cells. Semin Immunol 35, 19–28 (2018). [DOI] [PMC free article] [PubMed] [Google Scholar]
- 27.Andzinski L, et al. Type I IFNs induce anti-tumor polarization of tumor associated neutrophils in mice and human. Int J Cancer 138, 1982–1993 (2016). [DOI] [PubMed] [Google Scholar]
- 28.Kumar V, et al. Cancer-Associated Fibroblasts Neutralize the Anti-tumor Effect of CSF1 Receptor Blockade by Inducing PMN-MDSC Infiltration of Tumors. Cancer Cell 32, 654–668 e655 (2017). [DOI] [PMC free article] [PubMed] [Google Scholar]
- 29.Li J, et al. Tumor Cell-Intrinsic Factors Underlie Heterogeneity of Immune Cell Infiltration and Response to Immunotherapy. Immunity 49, 178–193 e177 (2018). [DOI] [PMC free article] [PubMed] [Google Scholar]
- 30.Kroetz DN, et al. Type I Interferon Induced Epigenetic Regulation of Macrophages Suppresses Innate and Adaptive Immunity in Acute Respiratory Viral Infection. PLoS Pathog 11, e1005338 (2015). [DOI] [PMC free article] [PubMed] [Google Scholar]
- 31.Schliehe C, et al. The methyltransferase Setdb2 mediates virus-induced susceptibility to bacterial superinfection. Nat Immunol 16, 67–74 (2015). [DOI] [PMC free article] [PubMed] [Google Scholar]
- 32.Hoye AM & Erler JT Structural ECM components in the premetastatic and metastatic niche. Am J Physiol Cell Physiol 310, C955–967 (2016). [DOI] [PubMed] [Google Scholar]
- 33.Roberts EW, et al. Depletion of stromal cells expressing fibroblast activation protein-alpha from skeletal muscle and bone marrow results in cachexia and anemia. J Exp Med 210, 1137–1151 (2013). [DOI] [PMC free article] [PubMed] [Google Scholar]
- 34.Santos AM, Jung J, Aziz N, Kissil JL & Pure E Targeting fibroblast activation protein inhibits tumor stromagenesis and growth in mice. J Clin Invest 119, 3613–3625 (2009). [DOI] [PMC free article] [PubMed] [Google Scholar]
- 35.Alspach E, et al. p38MAPK plays a crucial role in stromal-mediated tumorigenesis. Cancer Discov 4, 716–729 (2014). [DOI] [PMC free article] [PubMed] [Google Scholar]
- 36.Brichkina A, et al. p38MAPK builds a hyaluronan cancer niche to drive lung tumorigenesis. Genes Dev 30, 2623–2636 (2016). [DOI] [PMC free article] [PubMed] [Google Scholar]
- 37.Matsuo Y, et al. Involvement of p38alpha mitogen-activated protein kinase in lung metastasis of tumor cells. J Biol Chem 281, 36767–36775 (2006). [DOI] [PubMed] [Google Scholar]
- 38.Chen XW, et al. CYP4A in tumor-associated macrophages promotes pre-metastatic niche formation and metastasis. Oncogene 36, 5045–5057 (2017). [DOI] [PMC free article] [PubMed] [Google Scholar]
- 39.Correa D, Somoza RA, Lin P, Schiemann WP & Caplan AI Mesenchymal stem cells regulate melanoma cancer cells extravasation to bone and liver at their perivascular niche. Int J Cancer 138, 417–427 (2016). [DOI] [PMC free article] [PubMed] [Google Scholar]
- 40.Murgai M, et al. KLF4-dependent perivascular cell plasticity mediates pre-metastatic niche formation and metastasis. Nat Med 23, 1176–1190 (2017). [DOI] [PMC free article] [PubMed] [Google Scholar]
- 41.van Deventer HW, Palmieri DA, Wu QP, McCook EC & Serody JS Circulating fibrocytes prepare the lung for cancer metastasis by recruiting Ly-6C+ monocytes via CCL2. J Immunol 190, 4861–4867 (2013). [DOI] [PMC free article] [PubMed] [Google Scholar]
- 42.Zheng H, et al. Vascular endothelial growth factor-induced elimination of the type 1 interferon receptor is required for efficient angiogenesis. Blood 118, 4003–4006 (2011). [DOI] [PMC free article] [PubMed] [Google Scholar]
- 43.Qian J, et al. Pathogen recognition receptor signaling accelerates phosphorylation-dependent degradation of IFNAR1. PLoS Pathog 7, e1002065 (2011). [DOI] [PMC free article] [PubMed] [Google Scholar]
- 44.Kalluri R The biology and function of exosomes in cancer. J Clin Invest 126, 1208–1215 (2016). [DOI] [PMC free article] [PubMed] [Google Scholar]
- 45.Lobb RJ, Lima LG & Moller A Exosomes: Key mediators of metastasis and pre-metastatic niche formation. Semin Cell Dev Biol 67, 3–10 (2017). [DOI] [PubMed] [Google Scholar]
- 46.Sceneay J, Smyth MJ & Moller A The pre-metastatic niche: finding common ground. Cancer Metastasis Rev 32, 449–464 (2013). [DOI] [PubMed] [Google Scholar]
- 47.Rautela J, et al. Loss of Host Type-I IFN Signaling Accelerates Metastasis and Impairs NK-cell Antitumor Function in Multiple Models of Breast Cancer. Cancer Immunol Res 3, 1207–1217 (2015). [DOI] [PubMed] [Google Scholar]
- 48.Feig C, et al. Targeting CXCL12 from FAP-expressing carcinoma-associated fibroblasts synergizes with anti-PD-L1 immunotherapy in pancreatic cancer. Proc Natl Acad Sci U S A 110, 20212–20217 (2013). [DOI] [PMC free article] [PubMed] [Google Scholar]
- 49.Ohlund D, Elyada E & Tuveson D Fibroblast heterogeneity in the cancer wound. J Exp Med 211, 1503–1523 (2014). [DOI] [PMC free article] [PubMed] [Google Scholar]
- 50.Ohlund D, et al. Distinct populations of inflammatory fibroblasts and myofibroblasts in pancreatic cancer. J Exp Med 214, 579–596 (2017). [DOI] [PMC free article] [PubMed] [Google Scholar]
- 51.Choudhury SR, et al. Dipeptidase-1 Is an Adhesion Receptor for Neutrophil Recruitment in Lungs and Liver. Cell 178, 1205–1221 e1217 (2019). [DOI] [PubMed] [Google Scholar]
- 52.Lo A, et al. Fibroblast activation protein augments progression and metastasis of pancreatic ductal adenocarcinoma. JCI Insight 2(2017). [DOI] [PMC free article] [PubMed] [Google Scholar]
- 53.Albrengues J, et al. Neutrophil extracellular traps produced during inflammation awaken dormant cancer cells in mice. Science 361(2018). [DOI] [PMC free article] [PubMed] [Google Scholar]
- 54.Steeg PS Targeting metastasis. Nat Rev Cancer 16, 201–218 (2016). [DOI] [PMC free article] [PubMed] [Google Scholar]
- 55.Bragado P, et al. TGF-beta2 dictates disseminated tumour cell fate in target organs through TGF-beta-RIII and p38alpha/beta signalling. Nat Cell Biol 15, 1351–1361 (2013). [DOI] [PMC free article] [PubMed] [Google Scholar]
- 56.Wu X, et al. Ubiquitin-conjugating enzyme Ubc13 controls breast cancer metastasis through a TAK1-p38 MAP kinase cascade. Proc Natl Acad Sci U S A 111, 13870–13875 (2014). [DOI] [PMC free article] [PubMed] [Google Scholar]
- 57.Katlinski KV, et al. Inactivation of Interferon Receptor Promotes the Establishment of Immune Privileged Tumor Microenvironment. Cancer Cell 31, 194–207 (2017). [DOI] [PMC free article] [PubMed] [Google Scholar]
- 58.Patnaik A, et al. A First-in-Human Phase I Study of the Oral p38 MAPK Inhibitor, Ralimetinib (LY2228820 Dimesylate), in Patients with Advanced Cancer. Clin Cancer Res 22, 1095–1102 (2016). [DOI] [PubMed] [Google Scholar]
- 59.Kumar V, et al. CD45 Phosphatase Inhibits STAT3 Transcription Factor Activity in Myeloid Cells and Promotes Tumor-Associated Macrophage Differentiation. Immunity 44, 303–315 (2016). [DOI] [PMC free article] [PubMed] [Google Scholar]
Associated Data
This section collects any data citations, data availability statements, or supplementary materials included in this article.
Supplementary Materials
Data Availability Statement
RNA-sequencing data that support the findings of this study have been deposited in the Gene Expression Omnibus (GEO) under accession code GSE133781. Source data for Figs. 1–8 and Extended Data Figs. 1–8 have been provided as Source Data files. All other data supporting the findings of this study are available from the corresponding author upon reasonable request.


