Abstract
Recent development of visible-light optical coherence tomography (vis-OCT) has introduced new applications for noninvasive spectroscopic imaging. However, the measured spectra may be altered by spectrally dependent roll-off (SDR). We formulated a mathematical model for SDR that accounted for nonuniform wavenumber spacing, optical aberrations, and misalignments in the spectrometer. We simulated SDR based on this model and found strong agreement with measurements from a vis-OCT system. We verified that SDR altered spectroscopic measurements of fully oxygenated blood. We corrected these alterations by normalizing each spectrally dependent A-line by the measured SDR of the spectrometer. Our investigations develop and verify a quantitative description of SDR critical for informing OCT spectrometer design, alignment, and spectroscopic measurements.
Optical coherence tomography (OCT) [1] uses low-coherence interferometry to depth-resolve backscattered photons in biological tissue. Such capability enables noninvasive cross-sectional imaging at microscopic resolution. This has led to valuable clinical applications, particularly in the retina [2]. Visible-light OCT (vis-OCT) [3, 4] is an emerging OCT technology that uses the visible-light wavelength range to achieve ultrahigh axial resolution and perform spectroscopic analysis of tissue, such as measuring retinal blood vessel oxygen saturation (sO2) [5]. Presently, vis-OCT builds on spectral-domain OCT (SD-OCT) technology to obtain structural and spectral information. SD-OCT uses a spectrometer to spatially disperse the interfered beam across multiple wavelengths and focus them onto a 1D array camera. A Fourier transform (FT) of interference across the full spectral band enables reconstruction of ultrahigh-resolution structural information. Applying a Short-Time Fourier transform (STFT) across a series of sub-band windows enables extraction of depth-resolved spectral information at an axial resolution trade-off.
Accurate spectral measurements must account for spectral alterations not associated with light-tissue interaction. One potential source of spectral alteration is OCT signal roll-off [6], which is caused by low-pass filtering by the finite sampling elements of the spectrometer. Decay of the structural image with depth, which we refer to as full-spectrum roll-off (FSR), has been thoroughly investigated and modeled [7–10]. However, the spectral dependence of signal roll-off is not well understood although it has been well recognized [11–13]. We refer to this phenomenon as spectrally dependent roll-off (SDR). A quantitative description of SDR is critical for quantitative studies that use spectroscopic OCT.
In this Letter, we investigate the origins of SDR and its impacts on spectroscopic vis-OCT. For the first time, we establish an analytical model for SDR. Next, we introduce simulations to test our model using vis-OCT reconstruction software. Then, we measure the FSR and SDR of our vis-OCT system at different imaging depths. Finally, we investigate the influence of SDR on the measured spectrum of fully oxygenated blood and correct for the known SDR. These investigations build the foundation for understanding spectroscopic vis-OCT and other OCT systems.
In SD-OCT, interference can be considered a function of wavenumber k = 2π/λ, where λ is wavelength, since the depth-resolved OCT signal is the Fourier transform of the k domain interference fringe. The interference fringe can be expressed as
| (1) |
where z is the round-trip depth of each collected photon from the sample; Ssamp(k,z) is the power spectrum of light back scattered at depth z; Sref(k) is the reference arm power spectrum; zmax is the maximum imaging depth. We neglect the DC and autocorrelation terms in Eq. 1 since they are removed after post-processing [14]. In SD-OCT, a grating-based spectrometer spatially disperses S(k) across a 1-D detector array. The array contains pixels indexed j = 1,2,3,…,N, where N is number of pixels in the array. The width of each pixel is Δx. The dispersion of the spectrum in space closely follows the grating equation [8]. Here, we use the coordinate x to denote the spatial position of the dispersed interference spectrum, S(x). S(x) starts at x = 0 and ends at x = NΔx (neglecting the gap between pixels). The spectrometer’s impulse response is approximated by convolution of the two finite sampling elements
| (2) |
The first convolution term represents the spatial distribution of the Gaussian beam with respect to the center of each pixel as
| (3) |
Where aj is the full-width-at-half-maximum (FWHM) spot size of the beam at pixel j. Note that aj is assumed to be constant at a single pixel, but may vary across different pixels due to spectrometer optics aberrations or misalignments. The second term is the rectangular shape of each pixel’s integration surface,
| (4) |
The fringe is measured by integrating S(x) about H(x,j) for each pixel at index j as
| (5) |
Eq. 5 represents sampling the convolution of the spectrometer’s finite elements at each pixel index. This can be written as
| (6) |
Where Ω(x,j) is Dirac’s comb of period Δx. Following interpolation of S[j] to linear k domain and taking the discrete Fourier transform (DFT), the 1D depth-resolved OCT signal (A-line) is expressed as
| (7) |
Where i is the index of each sampled imaging depth, S[i], G[i], R[i], and Ω[i] are the DFT’s of the fringe, Gaussian beam, Rectangle, and Dirac’s comb functions, respectively. Convolution with Ω[i]is omitted at the end, as this term represents imaging depths outside of the Nyquist-limited imaging range. Only S[i] contains depth information from the sample. Thus, S[i] is modulated with depth by the term G[i]R[i], which is the FSR. The normalized FSR is
| (8) |
which is a low-pass filter that attenuates S[i] with depth. Spectrally varying spot size, aj, can be simplified an effective constant term across the wavelength range of interest, aeff [8]. Here, we found an explicit value, , using the first terms of the Taylor series expansion of the Gaussian function.
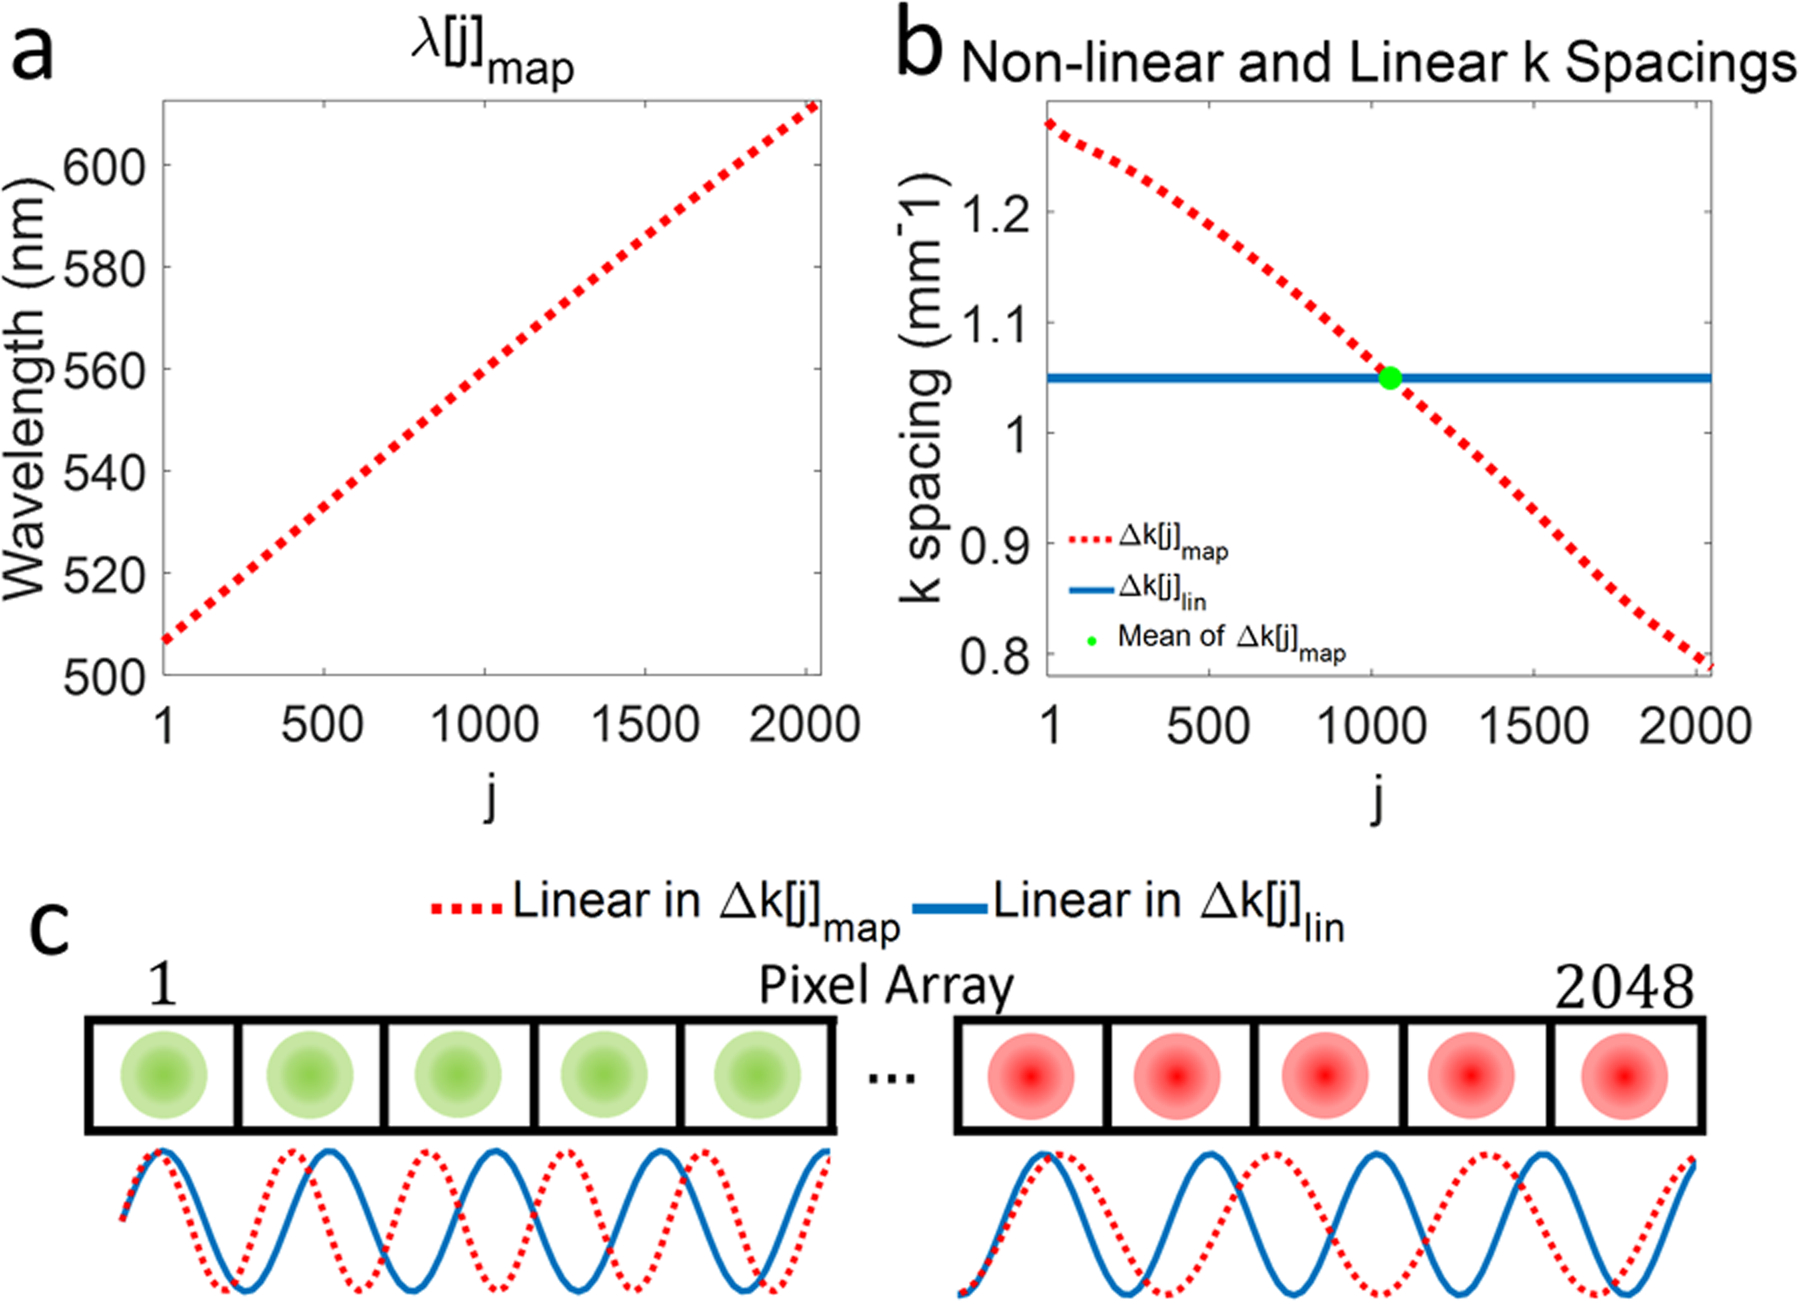
We investigated the spectral dependence of the spectrometer’s sampling. In practice, x is highly linear in the λ domain according to the grating equation [8, 10]. However, S(k) (Eq. 1) must be linearized in the k domain, creating a mismatch with the spectrometer’s sampling. Fig. 1a shows the wavelength-to-pixel mapping, λ[j]map, for a vis-OCT spectrometer (Blizzard SR, Opticent Health, Evanston, IL). The spectrometer covers the wavelength range λ1=506 nm to λ2=613 nm, which is from 12.42 μm−1 to 10.25 μm−1 in the k domain, and has N = 2048 pixels. The spacing between the centers of adjacent pixels of the spectrometer in the k domain, Δk[j]map, is shown in Fig. 1b (red dashed line). The k spacing between pixels is not constant and monotonically decreases (approximately linearly) with the pixel index. In contrast, linear k domain mapping on an N-pixel array with a spectrum ranging from λ1 to λ2,
| (9) |
has constant k spacing of . However, the mean values of Δk[j]map and Δk[j]lin are the same (green dot in Fig. 1b).
Fig. 1.

(a) Wavelength-to-pixel mapping (λ[j]map) in vis-OCT spectrometer; (b) k spacing(Δk[j]map) calculated from (λ[j]map) (red dashed line) in (a) and linear k spacing (k[j]lin, solid blue line) for the same wavelength range as λ[j]map. The green dot indicates the mean value of Δk[j]map coinciding with a constant k[j]lin; (c) Illustration of spectrometer pixel array (rectangles) and focal spots (green circles for shorter wavelengths [pixels 1–5] and red circles for longer wavelength [pixels 2044–2048]). The sine waves representing S(x) plotted as a function of Δk[j]map (red dashed line) and k[j]lin (solid blue line).
We illustrate sampling of S(x) in Fig. 1c. The top panel in Fig. 1c illustrates a 1D spectrometer pixel array (rectangles numbered from 1 to 2048) with optical focal spots (green and red circles). The solid blue sine wave (below the pixel array) represents a hypothetical S(x) with one frequency dispersed linearly with Δk[j]lin, while the red dashed sine wave (below pixel array) shows the same function dispersed linearly with Δk[j]map. The linear-in-k S(x) has a uniform frequency across the whole array. On the other hand, the non-linear-in-k S(x) has a higher frequency than the linear-in-k counterpart at the beginning of the array (left, green circles, shorter wavelengths). This follows the sparser-than-mean (green dot in Fig. 1b) k spacing. Likewise, at the end of the array (right, red focal spots, longer wavelengths), the non-linear-in-k S(x) has a lower frequency than the linear-in-k counterpart. This follows denser-than-mean k spacing in Fig. 1b. Therefore, in general, an OCT spectrometer disperses S(x)at higher frequencies for shorter wavelengths and at lower frequencies for longer wavelengths. An equivalent representation of this effect is to scale the finite sampling elements, G(x,j) and R(x,j), by the k spacing of the spectrometer. Indeed, despite not changing their physical dimensions, the focal spots and pixels ‘expand’ and ‘contract’ relative to the mean k spacing. We refer to the mean-normalized dimensionless version of Δk[j]map as Δk*[j]map Decomposing F[i] into spectrally-localized pixel range jstart to jend (and equivalent λstart to λend) yields the SDR
| (10) |
where Δj is the STFT range including all pixel indices in the range jstart to jend; aeff [Δj] is the effective spot size localized to Δj; and is the effective (by the same principle as aeff), mean-normalized k spacing localized toΔj. Both aeff [Δj] and are constants only across Δj. Since aeff [Δj] and vary with different Δj, different wavelengths will experience different low-pass filtering functions, thereby decaying the measured spectrum at different rates.
We simulated SDR for the Blizzard SR spectrometer, where spectral analysis was performed from 523 nm to 591 nm. S(x) was a sine wave of varying frequencies, representing different imaging depths. We generated S(x) as a function of the measured Δk[j]map and upsampled it to simulate continuous space. We simulated the impulse responses of the spectrometer according to Eqs. 1–5 for a constant spot size aj = aeff = 8.8 μm and pixel width Δx = 10 μm. We calculated S[j] according to Eq. 5 and interpolated it from linear in k[j]map to linear in k[j]lin. Next, we took the DFT of the full spectrum with a Gaussian window and discrete STFT using 24 Gaussian-window sub-bands spaced equidistantly from 523 nm to 591 nm (12.01 μm−1 to 10.63 μm−1 in k space). Each sub-band had the same bandwidth (FWHM) of 0.134 μm−1, corresponding to an 11-nm bandwidth for a sub-band centered at 556 nm.
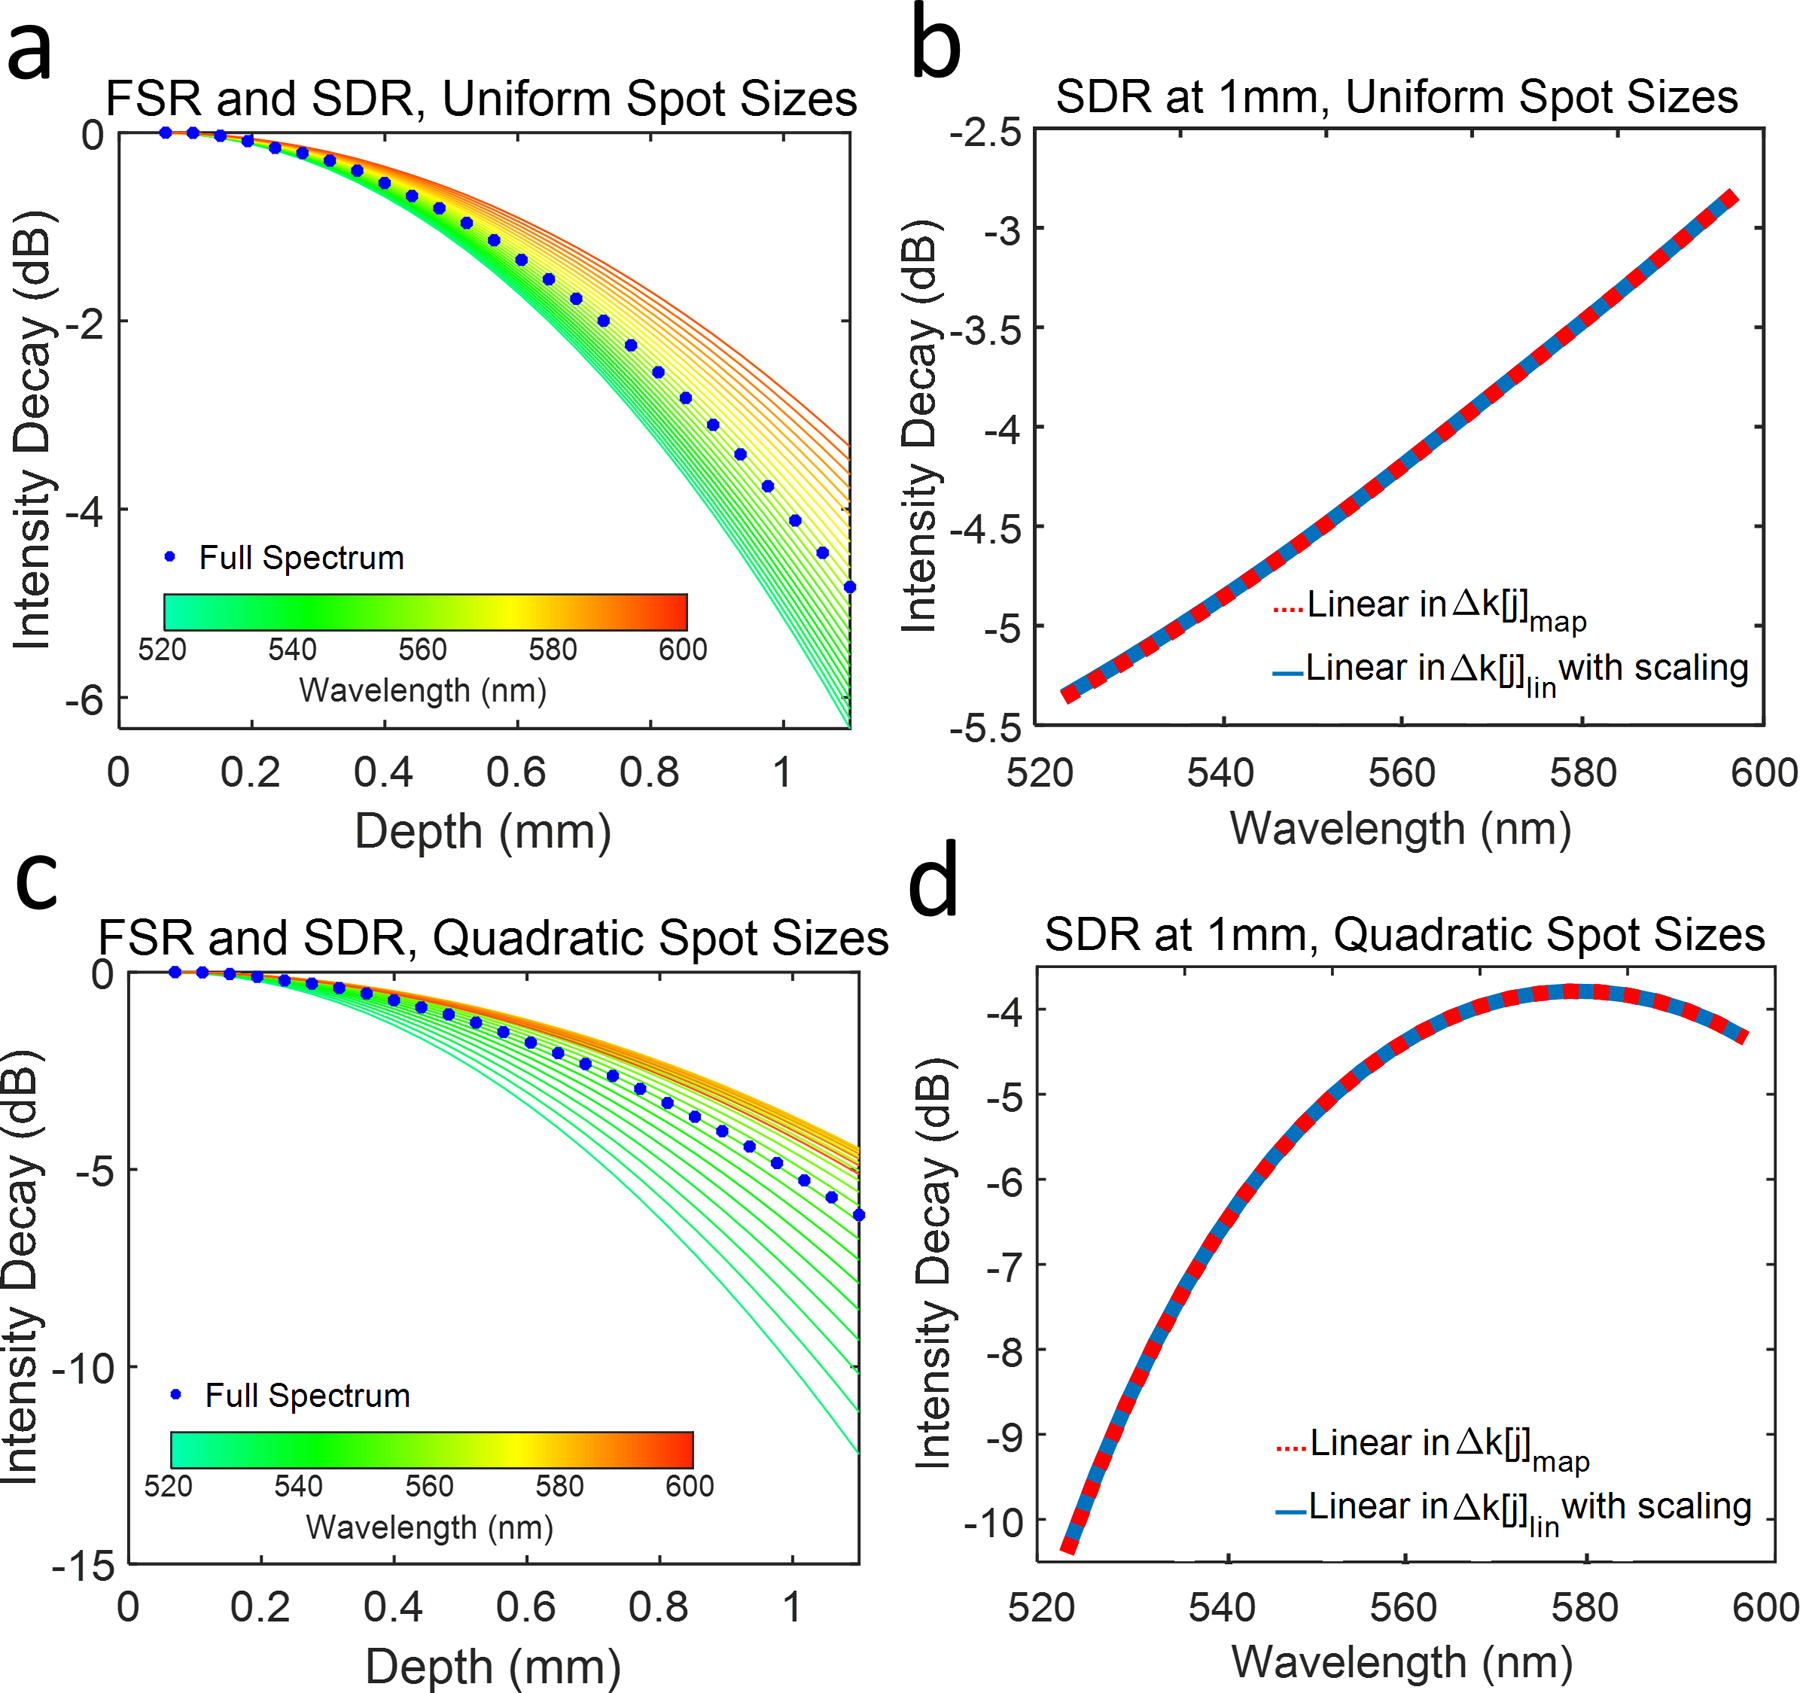
The simulated SDR values for depths up to 1.1 mm are shown in Fig. 2a. Note that the SDR for shorter wavelengths are more rapid than for longer wavelengths. Furthermore, SDR for bands near the center of the spectrum follow the FSR (blue dots) closely. These trends are explained by the spectrometer’s Δk[j]map (Fig. 1b). The simulated SDR at 1 mm is plotted in Fig. 2b (red dashed line). SDR is −5.4 dB at 523 nm and −2.8 dB at 591 nm, a 2.6-dB difference between the two sub-bands.
Fig. 2.

(a) Simulated FSR (blue dots) and SDR for uniform FWHM focal spot sizes incident on the pixel array. The color of each SDR curve reflects the central wavelength of the corresponding sub-band shown in the color bar. (b) SDR (red dashed line) and equivalent simulation (solid blue line) at 1-mm depth as a function of the central wavelength of each sub band (S(x) linear in Δk[j]map); (c) Simulated FSR (blue dots) and SDR for spot sizes varying quadratically with pixel index at an imaging depth up to 1.1 mm; (d) SDR (red dashed line) and equivalent simulation (solid blue line) at 1 mm imaging depth as a function of the central wavelength of each sub band (S(x) linear in Δk[j]lin).
We verified Eq. 10 by generating S(x) directly as a function of k[j]lin, rather than as a function of Δk[j]map. Then, we applied spectrally dependent scaling factor Δk*[j]map. The rest of the simulation was replicated, except for the interpolation step, as previously described. Identical results to the previous simulation were achieved (plotted as solid blue line in Fig. 2b).
Additionally, we simulated the influence of non-uniformly focused spot sizes (aj not constant) on SDR. We simulated spherical aberration influence on SDR by varying a[j] quadratically from 8.8 μm to 18.6 μm across the pixel array, with the minimum value at the central pixel of the array. The normalized roll-offs for depths up to 1.1 mm are plotted in Fig. 2c. Unlike in Fig. 2a, transition of SDR between shorter wavelengths (green) and longer wavelengths (orange) is less uniform. Shorter wavelengths decay more rapidly than longer wavelengths. Additionally, the FSR (blue dots) is biased more closely towards the longer wavelength sub-bands. SDR at 1 mm depth is illustrated in Fig. 2d. Here, SDR is −10.4 dB at 523 nm and − 4.3 dB at 591 nm, a 6.1-dB difference. Notably, SDR at 1-mm depth, shown in Fig. 2d (red dashed line), does not follow a perfectly quadratic shape centered at the central sub-band, as one might expect. Rather, it follows the multiplication of spectrally varying a[j], with k*[j]map, as predicted by Eq. 10.
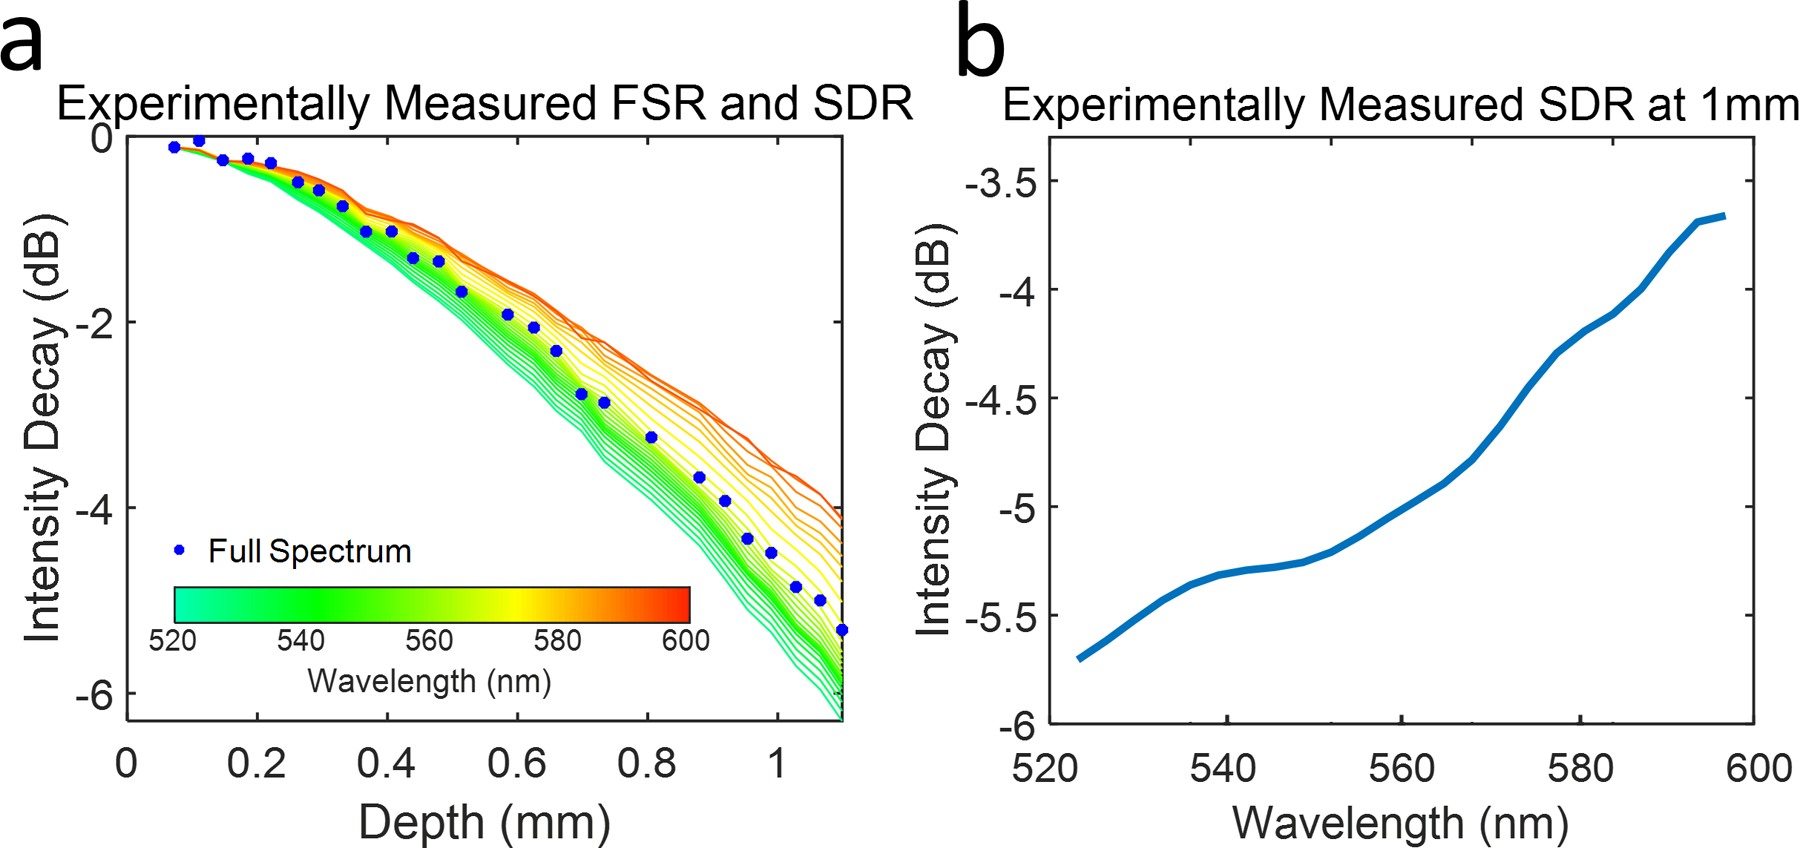
We experimentally verified our simulation in the Blizzard SR spectrometer. Briefly, we aligned a mirror in the sample arm of a vis-OCT Michelson interferometer. The mirror was placed near the zero-delay position. The reference arm was tuned in ~ 40 μm increments to an imaging depth of 1.1 mm. For each depth, we recorded 5000 background spectra from the sample and reference arms, followed by 5000 interference fringes at 25 kHz acquisition rate. We subtracted and divided each fringe by its DC component and digitally compensated for dispersion mismatch. Following interpolation to the linear k domain, we took the DFT and discrete STFT, respectively, of the interference signal for each mirror position using the same bands described in the simulation. Each A-line was averaged 5000 times for each recorded fringe. The experimentally measured SDRs shown in Figs. 3a and 3b follow a similar trend to our simulation for uniform spot sizes (Figs. 2a and 2b). SDR for shorter wavelengths (green) are more rapid than longer wavelengths (orange). SDR for sub-bands near the center of the full spectrum (yellow) follow the FSR (blue dots) closely. Measured SDR is −5.7 dB at 523 nm and −3.7 dB at 591 nm, showing a 2.0-dB difference. We noted that longer wavelengths decay more rapidly than the simulation for uniform spot sizes (e.g. −3.7 dB measured vs. −2.8 dB predicted at 591 nm), indicating that aeff [Δj] is larger of longer wavelengths. Potentially, a small tilt in the camera focal plane may have caused a defocusing for longer wavelengths. We investigated the influence of SDR on vis-OCT measured spectra of blood in glass tubes (100-μm inner diameter). Briefly, we oxygenated bovine blood (Sigma Aldrich, St. Louis, MO) with hematocrit 47 % to > 99% sO2 (measured with Rapidlab 248, Siemens Healthcare Diagnostics, Malvern, PA) by exposing it to a constant stream of oxygen. Then, we secured the tube in a homemade well filled with immersion oil (refractive index = 1.52) at 300 μm below the oil surface. We coated the inner wall of the tube with a heparin-PBS solution to prevent blood clotting.
Fig. 3.

(a) Measured FSR (blue dots) and SDR form a commercial vis-OCT spectrometer. The color of each SDR curve reflects the central wavelength of its sub band as shown by the color bar; (b) SDR at 1 mm imaging depth as a function of the central wavelength of each sub band.
During imaging, we filled the tube with oxygenated blood and flowed it at ~0.03 mm/s to prevent clotting and sedimentation. An objective lens with a 39-mm effective focal length (LSM03-vis, Thorlabs) focused 1.25 mW of light onto the tube. We imaged the tube using a 512 × 512 raster scan and adjusted the reference arm to acquire OCT-images with tube top wall positioned at 0.120 mm, 0.375 mm, 0.725 mm, and 1.025 mm from zero-delay position, respectively. Before processing of the fringes, we normalized by the DC spectrum and numerically compensated for dispersion mismatch. We applied STFTs to the normalized fringes to reconstruct a depth-resolved spectrum. For each image, we spatially averaged the spectra in the tube across 50 B-scans (~50,000 image pixels). Pixels were selected from the same location in the tube from each image to ensure a fair comparison.
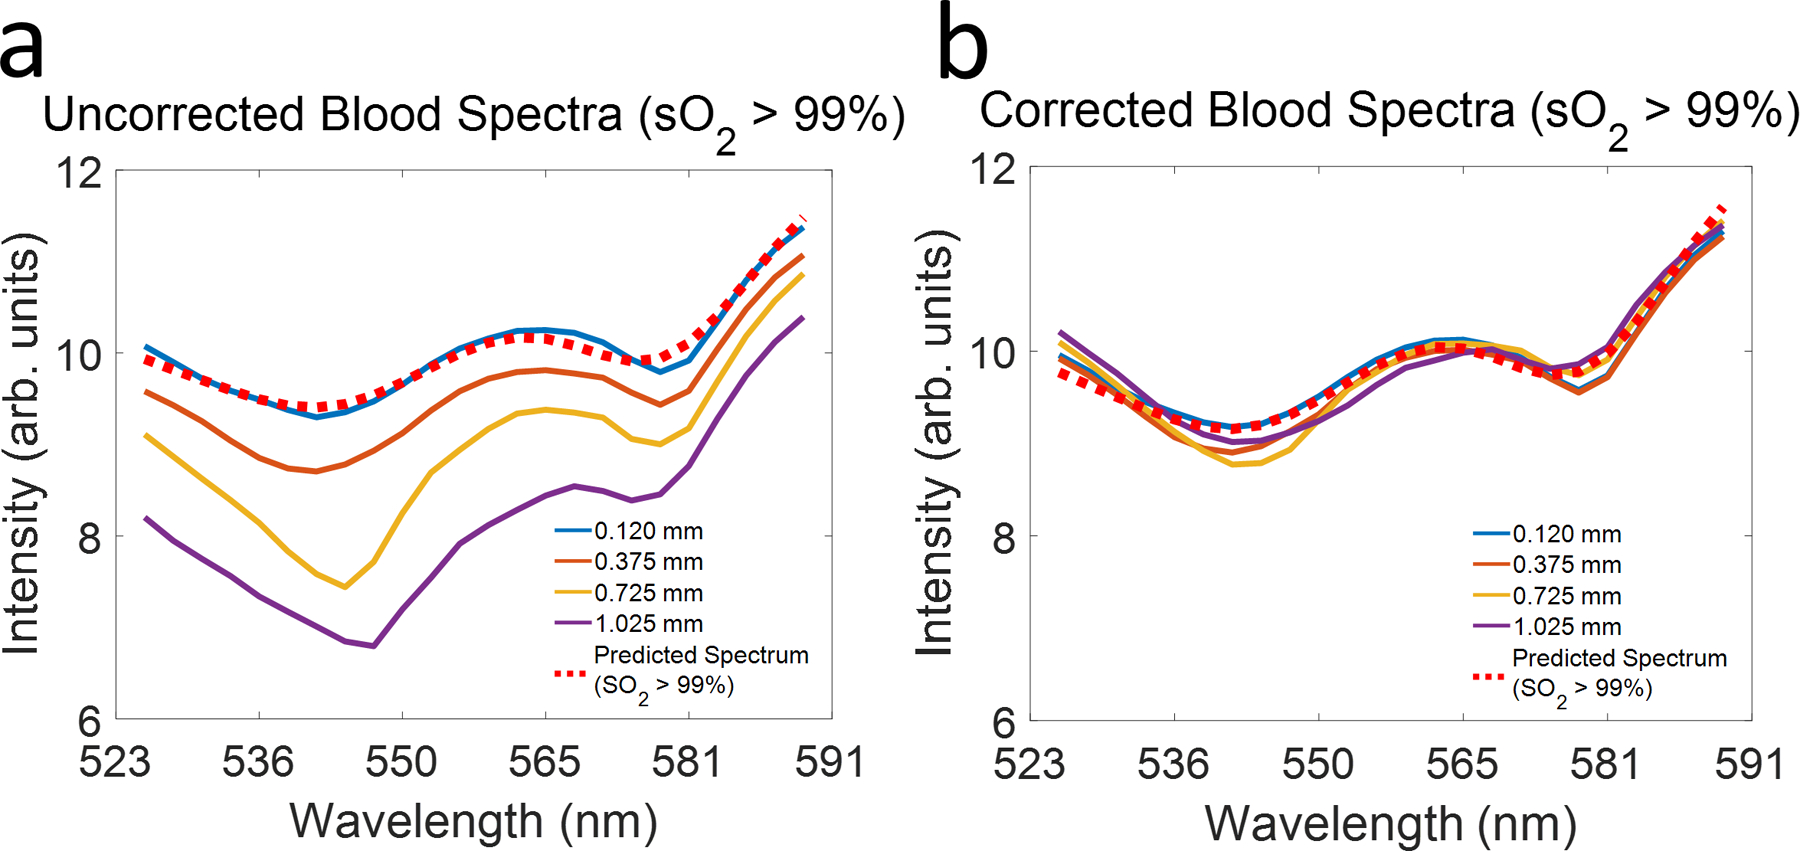
The measured blood spectra at selected depths are plotted in Fig. 4a, alongside that of reported oxygenated hemoglobin [15]. The spectrum at 0.120 mm (blue solid line) closely matches the reported spectrum. However, increasing depth alters the measured spectra. Specifically, shorter wavelengths decay more rapidly than longer ones, consistent with Figs. 2 & 3. We corrected this by dividing each sub-band A-line by measured SDR (Fig. 3). The measured SDR was fitted with a 4th order polynomial to extrapolate all depths. Fig. 4b shows the blood spectra at different depths after SDR correction. Comparing with Fig. 4a, all spectra have approximately same mean intensity and closely match the reported spectrum. Note that this correction does not increase the signal-to-noise-ratio of the spectrum.
Fig. 4.

(a) Comparing measured spectra (solid lines) of oxygenated blood at different depths with reported spectrum of oxygenated hemoglobin (red dotted line); (b) Spectra of oxygenated blood at different depths after SDR correction.
In summary, we presented an analytical model that describes SDR as a function of the nonlinear k spacing in a grating-based spectrometer and nonuniform spot sizes on the detector array. We validated our model using numerical simulation. We measured SDR from a commercial vis-OCT spectrometer and found agreement with our simulation and model. Finally, we verified the influence of SDR on vis-OCT measured spectrum of oxygenated blood. Together, these results suggest that our model and simulation can better inform spectrometer design, diagnose misalignments, or enhance spectroscopic measurements. First, the predicted SDR for uniform spot sizes (Fig. 2a) can be an ideal target in the design or alignment process. Deviation from expected SDR can inform the nature of aberration or misalignment. This approach is superior to simply minimizing the FSR, which does not contain spectrally dependent information. In another application, one may shape the laser spectrum for higher power at shorter wavelengths to ensure that signal-to-noise ratio (SNR) is comparable along all wavelengths. This can be especially useful in vis-OCT, where biological substances are highly attenuating. Finally, since k spacing varies more rapidly with λ for shorter wavelengths than longer ones, SDR is intrinsically more intense in vis-OCT than NIR OCT, assuming similar bandwidths are used. Since SDR is associated with the multiplication of k*[j]map with the spot size on the pixel array, the influence of aberrations or misalignments on SDR are exaggerated in the visible-light spectral range. Therefore, careful spectrometer design and alignment is likely most critical for vis-OCT.
When imaging near the zero-delay is challenged, such as in human eyes due to motions and curvature [16], a correction using measured SDR must be applied. The correction is limited to depths with sufficiently high SNR. We believe that the best solution to minimize influence from SDR, especially in vis-OCT, is the hardware design. A linear-in-k spectrometer [10] or a linear-in-k swept-source [14] (presently only available in NIR) will largely remove the influences of SDR due to highly uniform k space sampling.
Acknowledgements:
The authors acknowledge support from NIH Grants, R01EY026078, DP3DK108248, R01EY029121, R01EY028304, R44EY026466, and T32EY25202.
Disclosures:
HFZ has financial interest in Opticent Health, which did not support this work.
References:
- 1.Huang D, Swanson EA, Lin CP, Schuman JS, Stinson WG, Chang W, Hee MR, Flotte T, Gregory K, Puliafito CA, and Fujimoto JG, “Optical Coherence Tomography,” Science 254, 1178–1181 (1991). [DOI] [PMC free article] [PubMed] [Google Scholar]
- 2.Hee MR, Izatt JA, Swanson EA, Huang D, Schuman JS, Lin CP, Puliafito CA, and Fujimoto JG, “Optical Coherence Tomography of the Human Retina,” Arch Ophthalmol-Chic 113, 325–332 (1995). [DOI] [PubMed] [Google Scholar]
- 3.Shu X, Beckmann L, and Zhang HF, “Visible-light optical coherence tomography: a review,” J Biomed Opt 22 (2017). [DOI] [PMC free article] [PubMed] [Google Scholar]
- 4.Shu X, Beckmann L, Wang YB, Rubinoff I, Lucy K, Ishikawa H, Wollstein G, Fawzi AA, Schuman JS, Kuranov RV, and Zhang HF, “Designing visible-light optical coherence tomography towards clinics,” Quant Imag Med Surg 9, 769–781 (2019). [DOI] [PMC free article] [PubMed] [Google Scholar]
- 5.Yi J, Wei Q, Liu WZ, Backman V, and Zhang HF, “Visible-light optical coherence tomography for retinal oximetry,” Opt Lett 38, 1796–1798 (2013). [DOI] [PMC free article] [PubMed] [Google Scholar]
- 6.Izatt JA, and Choma MA, “Theory of Optical Coherence Tomography,” Biol Med Phys Biomed, 47–72 (2008). [Google Scholar]
- 7.Dorrer C, Belabas N, Likforman JP, and Joffre M, “Spectral resolution and sampling issues in Fourier-transform spectral interferometry,” J Opt Soc Am B 17, 1795–1802 (2000). [Google Scholar]
- 8.Hu ZL, Pan YS, and Rollins AM, “Analytical model of spectrometer-based two-beam spectral interferometry,” Appl Optics 46, 8499–8505 (2007). [DOI] [PubMed] [Google Scholar]
- 9.Lee SW, Jeong HW, Kim BM, Ahn YC, Jung W, and Chen ZP, “Optimization for Axial Resolution, Depth Range, and Sensitivity of Spectral Domain Optical Coherence Tomography at 1.3 mu m,” J Korean Phys Soc 55, 2354–2360 (2009). [DOI] [PMC free article] [PubMed] [Google Scholar]
- 10.Lan GP, and Li GQ, “Design of a k-space spectrometer for ultra-broad waveband spectral domain optical coherence tomography,” Sci Rep-Uk 7 (2017). [DOI] [PMC free article] [PubMed] [Google Scholar]
- 11.Veenstra C, Kruitwagen S, Groener D, Petersen W, Steenbergen W, and Bosschaart N, “Quantification of total haemoglobin concentrations in human whole blood by spectroscopic visible-light optical coherence tomography,” Sci Rep-Uk 9 (2019). [DOI] [PMC free article] [PubMed] [Google Scholar]
- 12.Winkelmann JA, Eid A, Spicer G, Almassalha LM, Nguyen TQ, and Backman V, “Spectral contrast optical coherence tomography angiography enables single-scan vessel imaging,” Light-Sci Appl 8 (2019). [DOI] [PMC free article] [PubMed] [Google Scholar]
- 13.Lichtenegger A, Harper DJ, Augustin M, Eugui P, Muck M, Gesperger J, Hitzenberger CK, Woehrer A, and Baumann B, “Spectroscopic imaging with spectral domain visible light optical coherence microscopy in Alzheimer’s disease brain samples,” Biomed Opt Express 8, 4007–4025 (2017). [DOI] [PMC free article] [PubMed] [Google Scholar]
- 14.Wojtkowski M, “High-speed optical coherence tomography: basics and applications,” Appl Optics 49, D30–D61 (2010). [DOI] [PubMed] [Google Scholar]
- 15.Faber DJ, Aalders MCG, Mik EG, Hooper BA, van Gemert MJC, and van Leeuwen TG, “Oxygen saturation-dependent absorption and scattering of blood,” Phys Rev Lett 93 (2004). [DOI] [PubMed] [Google Scholar]
- 16.Rubinoff I, Beckmann L, Wang Y, Fawzi AA, Liu X, Tauber J, Jones K, Ishikawa H, Schuman JS, Kuranov R, Zhang HF, “Speckle reuction in visible-light optical coherence tomography using scan modulation,” Neuophotonics 6, 041107 (2019). [DOI] [PMC free article] [PubMed] [Google Scholar]


